. 2019 Jun 4;8(11):e011260.
doi: 10.1161/JAHA.118.011260.

O-GlcNAc Transferase Promotes Compensated Cardiac Function and Protein Kinase A O-GlcNAcylation During Early and Established Pathological Hypertrophy From Pressure Overload

Affiliations

O-GlcNAc Transferase Promotes Compensated Cardiac Function and Protein Kinase A O-GlcNAcylation During Early and Established Pathological Hypertrophy From Pressure Overload

Wei-Zhong Zhu et al. J Am Heart Assoc. .

Abstract

Background Protein posttranslational modifications by O-linked β-N-acetylglucosamine (O-GlcNAc) increase with cardiac hypertrophy, yet the functional effects of these changes are incompletely understood. In other organs, O-GlcNAc promotes adaptation to acute physiological stressors; however, prolonged O-GlcNAc elevations are believed to be detrimental. We hypothesize that early O-GlcNAcylation improves cardiac function during initial response to pressure overload hypertrophy, but that sustained elevations during established pathological hypertrophy negatively impact cardiac function by adversely affecting calcium handling proteins. Methods and Results Transverse aortic constriction or sham surgeries were performed on littermate controls or cardiac-specific, inducible O-GlcNAc transferase knockout (OGTKO) mice to reduce O-GlcNAc levels. O-GlcNAc transferase deficiency was induced at different times. To evaluate the initial response to pressure overload, OGTKO was completed preoperatively and mice were followed for 2 weeks post-surgery. To assess prolonged O-GlcNAcylation during established hypertrophy, OGTKO was performed starting 18 days after surgery and mice were followed until 6 weeks post-surgery. In both groups, OGTKO with transverse aortic constriction caused significant left ventricular dysfunction. OGTKO did not affect levels of the calcium handling protein SERCA2a. OGTKO reduced phosphorylation of phospholamban and cardiac troponin I, which would negatively impact cardiac function. O-GlcNAcylation of protein kinase A catalytic subunit, a kinase for phospholamban, decreased with OGTKO. Conclusions O-GlcNAcylation promotes compensated cardiac function in both early and established pathological hypertrophy. We identified a novel O-GlcNAcylation of protein kinase A catalytic subunit, which may regulate calcium handling and cardiac function.

Keywords: OGT; O‐GlcNAc; cardiac failure; cardiac hypertrophy; pressure overload; protein kinase A phosphorylation.


Figures

Figure 1
Figure 1
Diagram of the experimental protocol for (A) early hypertrophy and (B) established hypertrophy. Echo indicates echocardiogram; surgery, transverse aortic constriction or sham surgeries; TAM, 4‐hydroxytamoxifen.
Figure 2
Figure 2
O‐linked β‐N‐acetylglucosamine (O‐GlcNAc) transferase (OGT) and O‐GlcNAc protein levels in early hypertrophy. Immunoblot results are shown for OGT (A), total protein O‐GlcNAc levels (B), and O‐GlcNAc levels at the indicated specific molecular weight ranges (C). Values are arbitrary units reported as mean±standard error of the mean. n=3 control sham, n=3 OGT knockout (OGTKO) sham, n=4 control transverse aortic constriction (TAC), n=4 OGTKO TAC. In (A and B) *P<0.05 between groups indicated with the bar. In (C) *P<0.05 for control sham vs control TAC in same molecular weight range; P<0.05 for control sham vs OGTKO sham in the same molecular weight range; § P<0.05 for control TAC vs OGTKO TAC at the same molecular weight range; P<0.05 for OGTKO sham vs OGTKO TAC at the same molecular weight range. For (B) control sham vs OGTKO sham, P value from t test=0.039 and P value from Tukey procedure=0.14. For (C) >150 kDa OGTKO sham vs OGTKO TAC, P value from t test=0.023 and P value from Tukey procedure=0.12. For (C) 150 to 75 kDa control sham vs OGTKO sham, P value from t test=0.022 and P value from Tukey procedure=0.25.
Figure 3
Figure 3
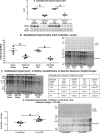
O‐linked β‐N‐acetylglucosamine (O‐GlcNAc) transferase (OGT) and O‐GlcNAc protein levels in established hypertrophy. Immunoblot results are shown for OGT (A), total protein O‐GlcNAc levels (B), O‐GlcNAc levels at the indicated specific molecular weight ranges (C), and O‐GlcNAc protein levels at molecular weights <100 kDa in control (cont) sham and control transverse aortic constriction (TAC) (D). Values are arbitrary units reported as mean±standard error of the mean. For (A through C) n=3 control sham, n=3 O‐GlcNAc transferase knockout (OGTKO) sham, n=4 control TAC, n=4 OGTKO TAC. For D, n=7 control sham and n=7 control TAC. In (A, B, and D) *P<0.05 between groups indicated with the bar. In (C) P<0.05 for control sham vs OGTKO sham at the same molecular weight range; § P<0.05 for control TAC vs OGTKO TAC at the same molecular weight range; P<0.05 for OGTKO sham vs OGTKO TAC at the same molecular weight range. For (C) >150 kDa control sham vs OGTKO sham, P value from t test=0.072 and P value from Tukey procedure=0.027. For (C) >150 kDa OGTKO sham vs OGTKO TAC, P value from t test=0.025 and P value from Tukey procedure=0.25.
Figure 4
Figure 4
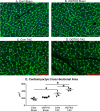
O‐linked β‐N‐acetylglucosamine transferase knockout (OGTKO) increases cardiomyocyte cross‐sectional area during established hypertrophy in sham and transverse aortic constriction (TAC) hearts. Representative sections from the indicated established hypertrophy groups stained for wheat germ agglutinin and DAPI are shown in (A through D). E, Quantification of the cross‐sectional areas for the experimental groups. Values are expressed as mean±standard error of the mean. n=4 per group. Red bar indicates 50 μm. *P<0.05 between groups indicated with the bar.
Figure 5
Figure 5
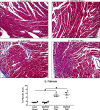
O‐linked β‐N‐acetylglucosamine transferase knockout (OGTKO) does not alter histological marker of fibrosis by Masson's trichrome staining during established hypertrophy. Representative sections with Masson's trichrome staining from the indicated established hypertrophy groups are shown in (A through D). E, Quantification of the percent fibrotic area for the experimental groups. n=4 per group. Black bar indicates 50 μm. Values are mean±standard error of the mean. *P<0.05 between groups indicated with the bar. TAC indicates transverse aortic constriction.
Figure 6
Figure 6
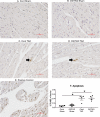
O‐linked β‐N‐acetylglucosamine transferase knockout (OGTKO) does not alter histological markers of apoptosis during established hypertrophy. Sections of terminal deoxynucleotidyl transferase dUTP nick end‐labeling (TUNEL)–stained hearts from the indicated established hypertrophy groups are shown in (A through D). TUNEL‐positive nuclei in (C and D) are shown by the arrow. Because of the low number of TUNEL‐positive nuclei, these images are not representative of the overall results. E, Positive control myocardium demonstrating multiple TUNEL‐positive nuclei. F, Quantification of the percent TUNEL‐positive nuclei (% TUNEL+ nuclei) for the experimental groups. n=4 per group. Red bar indicates 50 μm. Values are expressed as mean±standard error of the mean. *P<0.05 between groups indicated with the bar. TAC indicates transverse aortic constriction.
Figure 7
Figure 7
Sarco/endoplasmic reticulum Ca2+‐ATPase 2a (SERCA2a) protein levels and phospholamban phosphorylation (pPLN) in early and established hypertrophy. Immunoblots from early and established hypertrophy for total SERCA2a protein levels (A, B) and phosphorylated phospholamban Ser16 to total phospholamban (PLN) (C through E). For (A through E) n=3 control sham, n=3 O‐linked β‐N‐acetylglucosamine transferase knockout (OGTKO) sham, n=4 control transverse aortic constriction (TAC), n=4 OGTKO TAC. For (D) n=7 control sham, n=7 control TAC. Values are arbitrary units reported as mean±standard error of the mean. *P<0.05 between groups indicated with the bar. For (C) control sham vs OGTKO sham, P value from t test=0.013 and P value from Tukey procedure=0.0522. For (E) control sham vs OGTKO sham, P value from t test=0.0014 and P value from Tukey procedure=0.22.
Figure 8
Figure 8
Protein kinase A catalytic subunit (PKAc) phosphorylation (pPKAc) and O‐GlcNAcylation in early hypertrophy. Immunoblots for phosphorylated PKAc at Thr197 normalized to total PKAc in the indicated early hypertrophy groups (A through C). Immunoprecipitation for PKAc with subsequent immunoblotting for O‐linked β‐N‐acetylglucosamine (O‐GlcNAc) and PKAc (for normalization) in early hypertrophy (D). In (D) input lane 1 is the whole cell lysate from control transverse aortic constriction (TAC) and input lane 2 is the whole cell lysate from O‐GlcNAc transferase knockout (OGTKO) TAC. n=7 per group for A–C. n=3 per group in (D). Values are arbitrary units reported as mean±standard error of the mean. *P<0.05 between groups indicated with the bar. @ P value from t test=0.058 and P value from Tukey procedure=0.57 between the groups indicated with the bar. For (D) control sham vs OGTKO sham, P value from t test=0.028 and P value from Tukey procedure=0.20. WB indicates Western blot.
Figure 9
Figure 9
Protein kinase A catalytic subunit (PKAc) phosphorylation (pPKAc) and O‐GlcNAcylation in established hypertrophy. Immunoblots for phosphorylated PKAc at Thr197 normalized to total PKAc in the indicated established hypertrophy groups (A through C). Immunoprecipitation for PKAc with subsequent immunoblotting for O‐linked β‐N‐acetylglucosamine (O‐GlcNAc) and PKAc (for normalization) in established hypertrophy (D). In (D) input lane 1 is the whole cell lysate from control transverse aortic constriction (TAC) and input lane 2 is the whole cell lysate from O‐GlcNAc transferase knockout (OGTKO) TAC. n=7 per group for (A through C). n=3 per group in (D). Values are arbitrary units reported as mean±standard error of the mean. *P<0.05 between groups indicated with the bar. @ P value from t test=0.076 and P value from Tukey procedure=0.056 between the groups indicated with the bar. WB indicates Western blot.
Figure 10
Figure 10
Phosphorylation of cardiac troponin I (p‐cTnI) in early and established hypertrophy. Immunoblots from the indicated early and established hypertrophy groups are show for p‐cTnI Ser23/24 to total cardiac troponin I (cTnI) (A through F). n=7 per group for (A through F). Values are arbitrary units reported as mean±standard error of the mean. *P<0.05 between groups indicated with the bar. OGTKO indicates O‐linked β‐N‐acetylglucosamine transferase knockout; TAC, transverse aortic constriction.

Similar articles

Cited by

References

    1. Torres CR, Hart GW. Topography and polypeptide distribution of terminal N‐acetylglucosamine residues on the surfaces of intact lymphocytes. Evidence for O‐linked GlcNAc. J Biol Chem. 1984;259:3308–3317. - PubMed
    1. Butkinaree C, Park K, Hart GW. O‐linked beta‐N‐acetylglucosamine (O‐GlcNAc): extensive crosstalk with phosphorylation to regulate signaling and transcription in response to nutrients and stress. Biochim Biophys Acta. 2010;1800:96–106. - PMC - PubMed
    1. Hanover JA, Krause MW, Love DC. The hexosamine signaling pathway: O‐GlcNAc cycling in feast or famine. Biochim Biophys Acta. 2010;1800:80–95. - PMC - PubMed
    1. Hart GW, Slawson C, Ramirez‐Correa G, Lagerlof O. Cross talk between O‐GlcNAcylation and phosphorylation: roles in signaling, transcription, and chronic disease. Annu Rev Biochem. 2011;80:825–858. - PMC - PubMed
    1. Hu P, Shimoji S, Hart GW. Site‐specific interplay between O‐GlcNAcylation and phosphorylation in cellular regulation. FEBS Lett. 2010;584:2526–2538. - PubMed

Publication types

MeSH terms

Substances