. 2020 Mar 1;69(2):325-344.
doi: 10.1093/sysbio/syz038.

A Simulation-Based Evaluation of Tip-Dating Under the Fossilized Birth-Death Process

Affiliations

A Simulation-Based Evaluation of Tip-Dating Under the Fossilized Birth-Death Process

Arong Luo et al. Syst Biol. .

Abstract

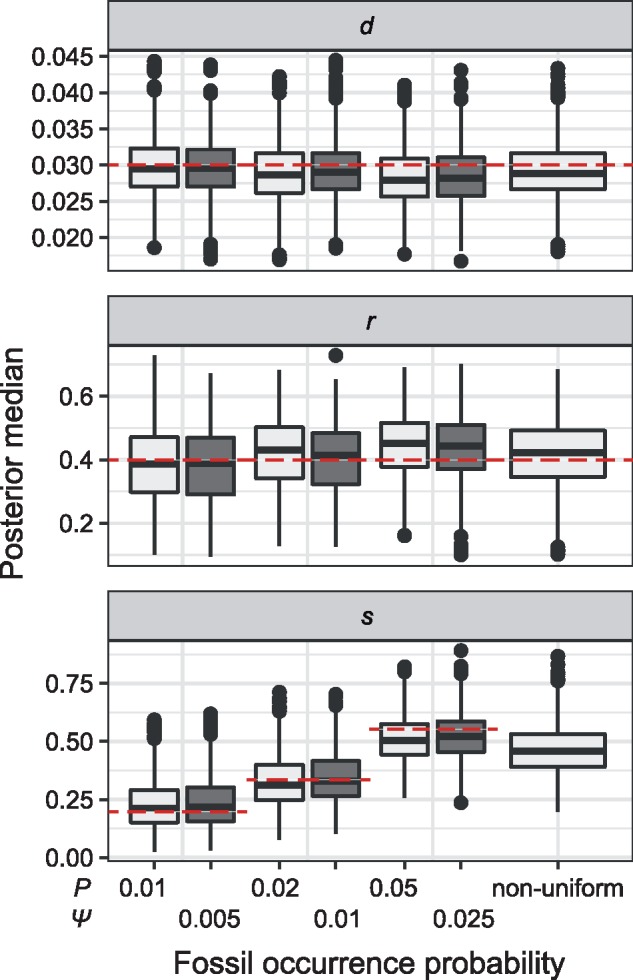
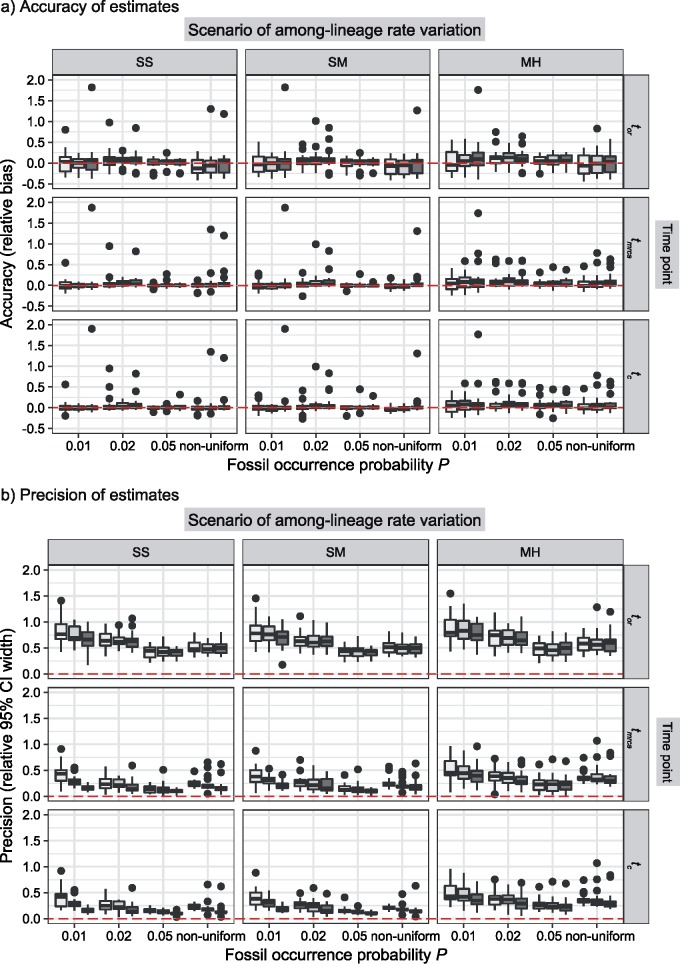
Bayesian molecular dating is widely used to study evolutionary timescales. This procedure usually involves phylogenetic analysis of nucleotide sequence data, with fossil-based calibrations applied as age constraints on internal nodes of the tree. An alternative approach is tip-dating, which explicitly includes fossil data in the analysis. This can be done, for example, through the joint analysis of molecular data from present-day taxa and morphological data from both extant and fossil taxa. In the context of tip-dating, an important development has been the fossilized birth-death process, which allows non-contemporaneous tips and sampled ancestors while providing a model of lineage diversification for the prior on the tree topology and internal node times. However, tip-dating with fossils faces a number of considerable challenges, especially, those associated with fossil sampling and evolutionary models for morphological characters. We conducted a simulation study to evaluate the performance of tip-dating using the fossilized birth-death model. We simulated fossil occurrences and the evolution of nucleotide sequences and morphological characters under a wide range of conditions. Our analyses of these data show that the number and the maximum age of fossil occurrences have a greater influence than the degree of among-lineage rate variation or the number of morphological characters on estimates of node times and the tree topology. Tip-dating with the fossilized birth-death model generally performs well in recovering the relationships among extant taxa but has difficulties in correctly placing fossil taxa in the tree and identifying the number of sampled ancestors. The method yields accurate estimates of the ages of the root and crown group, although the precision of these estimates varies with the probability of fossil occurrence. The exclusion of morphological characters results in a slight overestimation of node times, whereas the exclusion of nucleotide sequences has a negative impact on inference of the tree topology. Our results provide an overview of the performance of tip-dating using the fossilized birth-death model, which will inform further development of the method and its application to key questions in evolutionary biology.

Keywords: Bayesian phylogenetics; evolutionary simulation; fossilized birth–death process; molecular clock; tip-dating; total-evidence dating.


Figures

Figure 1.
Figure 1.
a) Illustration of a complete tree generated under the birth–death process. Lineage diversification is controlled by birth rate formula image, death rate formula image, and sampling fraction formula image. From the origin time (formula image to the present-day (formula image, fossils have been sampled at formula image, formula image, and formula image, with one (denoted by the upward triangle) leaving an extant descendant (denoted by solid circle) and the other two (denoted by downward triangles) leaving no extant descendants. With complete sampling of present-day taxa (formula image = 1), the age of the crown group formula image remains the same, whereas the age of the root formula image depends on whether fossils are sampled between formula image and formula image’. b) The FBD tree depicting the reconstructed history of present-day taxa and sampled fossil taxa based on the complete species tree in (a). c) Flowchart showing the simulation pipelines and analyses conducted in this study. A detailed explanation of each step is provided in Materials and Methods section. Briefly, we obtained the FBD trees by simulating speciation using the birth–death process, with the probability of fossil occurrences based on either formula image and formula image. Among these FBD trees, the 80 trees with fossil occurrences sampled by formula image were the main basis of this study. These trees provided the fossil ages and topologies. We simulated the evolution of nucleotide sequences and morphological characters on these trees, under various models of rate variation among lineages. We carried out series of Bayesian dating analyses under a range of settings and using various subsets of the data. These analyses yielded estimates of the posterior distribution of tree topologies, node times, and model parameters.
Figure 2.
Figure 2.
Posterior medians of the FBD model parameters from our evaluation of the FBD process, while conditioning on fixed tree topologies and branch lengths. The three panels show boxplot summaries of posterior estimates of net diversification rate (formula image = formula image - formula image), turnover rate (formula image = formula image/formula image), and fossil sampling proportion (formula image = formula image/(formula image)). Each summary is based on a set of 1000 FBD trees, which were derived from fossil occurrences sampled by formula image (light grey shading) or formula image (dark grey shading) on our 20 simulated species trees. The dashed horizontal lines indicate the true values of formula image, formula image, and formula image that were used for simulation.
Figure 3.
Figure 3.
Performance of tip-dating in our core analyses in topological inference. Dashed horizontal lines indicate the target values for the metrics in each of the plots. Plots show corrected R-F distances between maximum-clade-credibility trees and true trees, while (a) excluding fossil taxa or (b) including fossil taxa. c) Recovery rates of correct phylogenetic positions for fossil taxa that have left extant descendants. d) Ratios of placing all sampled fossils as SA in maximum-clade-credibility trees to the true numbers of sampled ancestors. Each panel shows the results from a different model of among-lineage rate variation for the molecular and morphological data: strict clock and strict clock (SS); strict clock and moderate rate variation (SM); and moderate rate variation and high rate variation (MH). Within each panel, boxplot summaries are shown for the 20 FBD trees under each model of fossil occurrence probability (formula image, 0.02, 0.05, and nonuniform). For each fossil occurrence probability, results are shown for three different sizes of morphological characters (formula image, 200, 1000 from left to right, in increasingly dark shades of grey).
Figure 4.
Figure 4.
Performance of tip-dating in our core analyses in estimating origin time (formula image, root age (formula image, and crown age (formula image Dashed horizontal lines indicate the target values in each of the plots. a) Accuracy of estimates, as measured by relative bias (distance between posterior median and true value, divided by the true value). b) Precision in estimates, as measured by relative 95% CI width (posterior 95% CI width divided by the true value). Each column of panels shows the results from a different model of among-lineage rate variation for the molecular and morphological data: strict clock and strict clock (SS); strict clock and moderate rate variation (SM); and moderate rate variation and high rate variation (MH). Within each panel, boxplot summaries are shown for the 20 FBD trees under each model of fossil occurrence probability (formula image, 0.02, 0.05, and nonuniform). For each fossil occurrence probability, results are shown for three different sizes of morphological characters (formula image, 200, 1000 from left to right, in increasingly dark shades of grey)
Figure 5.
Figure 5.
Posterior estimates for origin time (formula image, root age (formula image, and crown age (formula image in the analyses when morphological data were excluded. For each fossil occurrence probability (formula image, 0.02, 0.05, and nonuniform), the left boxplot (light grey shading) shows estimates for molecular data that have evolved under a strict clock, whereas the right boxplot (dark grey shading) shows estimates that have evolved under moderate rate variation across branches. Dashed horizontal lines indicate the target values in each of the plots. a) Accuracy of estimates, as measured by relative bias. b) Precision in estimates, as measured by relative 95% credibility interval width.
Figure 6.
Figure 6.
Posterior estimates in topological inference when molecular data were excluded. Dashed horizontal lines indicate the target values for the metrics in each of the plots. a) Corrected Robinson–Foulds distances between maximum-clade-credibility trees and true trees with fossil taxa excluded. b) Corrected Robinson–Foulds distances with fossil taxa included. Each panel shows the results from a different model of among-lineage rate variation for the molecular and morphological data: strict clock and strict clock (SS); strict clock and moderate rate variation (SM); and moderate rate variation and high rate variation (MH). Within each panel, boxplot summaries are shown for the 20 FBD trees for each model of fossil occurrence probability (formula image, 0.02, 0.05, and nonuniform). For each fossil occurrence probability, results are shown for three different sizes of morphological characters (formula image, 200, 1000 from left to right, in increasingly dark shades of grey).
Figure 7.
Figure 7.
Performance of tip-dating under variations on the conditions of the core analyses. Results are shown for: counterpart analyses in the core analyses (denoted by “control”); those when binary morphological characters were replaced by four-state morphological characters (denoted by “four states”); those when the Mk model was used to analyse the full morphological data sets, rather than using the Mkv model to analyse only the variable morphological characters (denoted by “Mk”); and those when the uncertainty in fossil ages was taken into account (denoted by “uncertainty”). Dashed horizontal lines indicate the target values for the metrics in each of the plots. a) Accuracy of posterior medians, as measured by relative bias, for origin time (formula image, root age (formula image, and crown age (formula image. b) Precision in date estimates, as measured by relative 95% credibility interval width. c) Corrected Robinson–Foulds distances between the maximum-clade-credibility trees and the trees used for simulation. d) Absolute Robinson–Foulds distance between maximum-clade-credibility trees derived from control analyses and those derived from the analyses taking into account fossil age uncertainty, based on either all taxa or only extant taxa. For each of the four treatments within each panel in (a), (b), and (c) and for the two treatments in (d), boxplots summarize the results for three different sizes of morphological characters (formula image, 200, 1000 from left to right, in increasingly dark shades of grey).
Figure 8.
Figure 8.
Posterior medians of the fossilized birth–death model parameters net diversification rate (formula image, turnover rate (formula image, and fossil sampling proportion (formula image from all dating analyses. Results are shown for the core analyses (“core”), analyses without morphological characters (“no morpho”), analyses without nucleotide sequences (“no mol”), analyses conditioned on fixed tree topologies (“fixed tree”), and analyses under other variations on the conditions of the core analyses (“others”). Boxplots summarize the estimates from analyses grouped according to the formula image models used for simulation (formula image, 0.02, 0.05, and nonuniform from left to right, in increasingly dark shades of grey). The dashed horizontal lines indicate the true values of formula image, formula image, and formula image that were used for simulation.

References

    1. Álvarez-Carretero S.,, Goswami A.,, Yang Z.,, dos Reis M. 2019. Bayesian estimation of species divergence times using correlated quantitative characters. Syst. Biol. 10.1093/sysbio/syz015 - DOI - PubMed
    1. Arcila D.,, Pyron R.A.,, Tyler J.C.,, Orti G.,, Betancur-R R. 2015. An evaluation of fossil tip-dating versus node-age calibrations in tetraodontiform fishes (Teleostei: Percomorphaceae). Mol. Phylogenet. Evol. 82:131–145. - PubMed
    1. Arcila D.,, Tyler J.C. 2017. Mass extinction in tetraodontiform fishes linked to the Palaeocene-Eocene thermal maximum. Proc. R. Soc. B. 284:20171771. - PMC - PubMed
    1. Bapst D.W.,, Wright A.M.,, Matzke N.J.,, Lloyd G.T. 2016. Topology, divergence dates, and macroevolutionary inferences vary between different tip-dating approaches applied to fossil theropods (Dinosauria). Biol. Lett. 12:20160237. - PMC - PubMed
    1. Barido-Sottani J.,, Aguirre-Fernández G.,, Hopkins M.,, Stadler T.,, Warnock R. 2019. Ignoring stratigraphic age uncertainty leads to erroneous estimates of species divergence times under the fossilized birth-death process. Proc. R. Soc. B. 286:20190685. - PMC - PubMed

Publication types