. 2019 May 27;17(1):72.
doi: 10.1186/s12951-019-0504-0.

Extracellular vesicles from regenerative human cardiac cells act as potent immune modulators by priming monocytes

Affiliations

Extracellular vesicles from regenerative human cardiac cells act as potent immune modulators by priming monocytes

Christien M Beez et al. J Nanobiotechnology. .

Abstract

Background: Nano-sized vesicles, so called extracellular vesicles (EVs), from regenerative cardiac cells represent a promising new therapeutic approach to treat cardiovascular diseases. However, it is not yet sufficiently understood how cardiac-derived EVs facilitate their protective effects. Therefore, we investigated the immune modulating capabilities of EVs from human cardiac-derived adherent proliferating (CardAP) cells, which are a unique cell type with proven cardioprotective features.

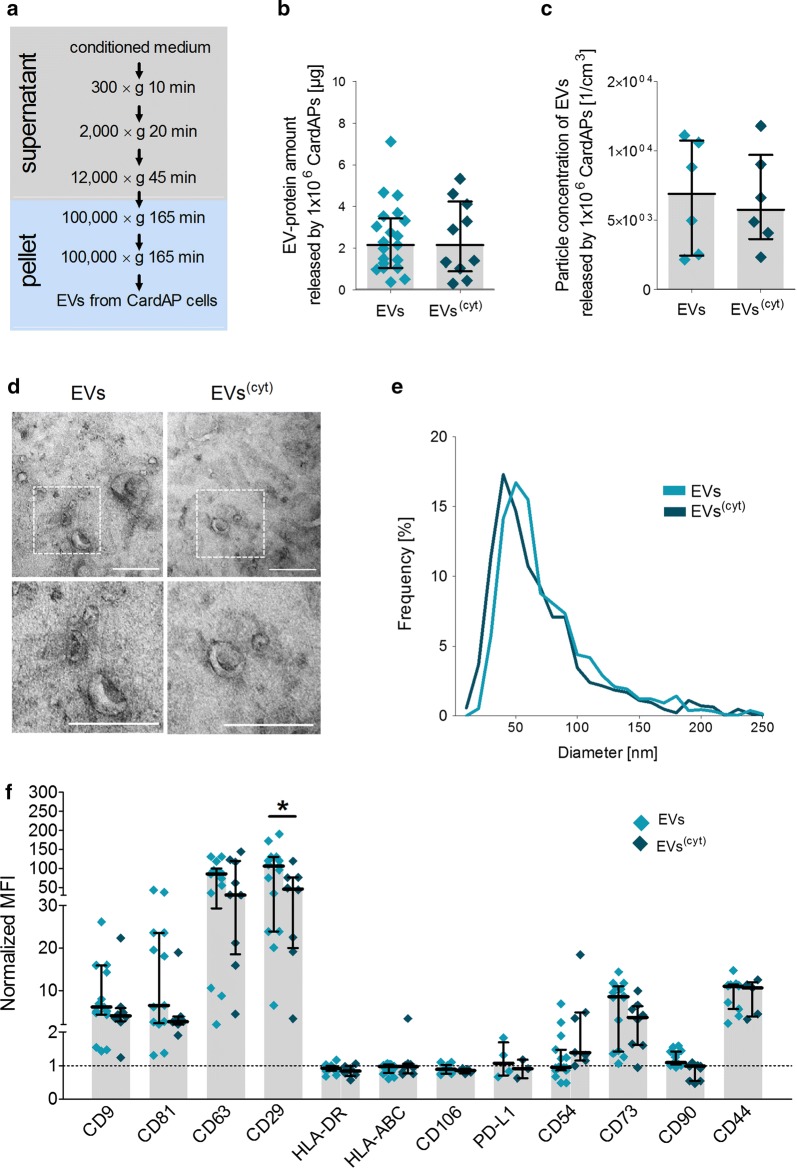
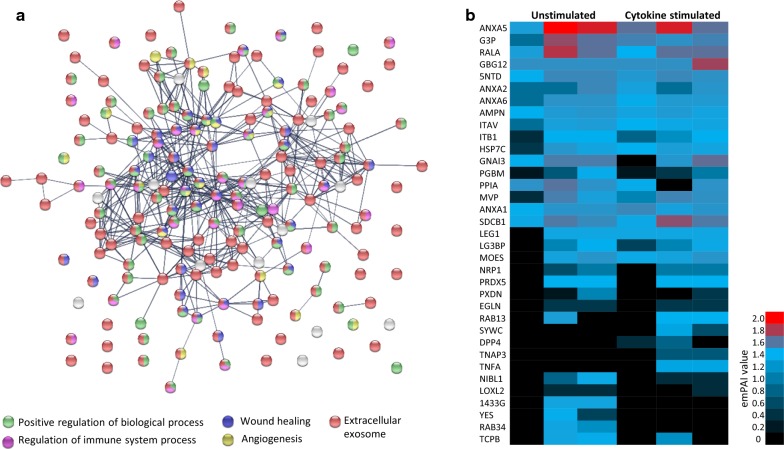
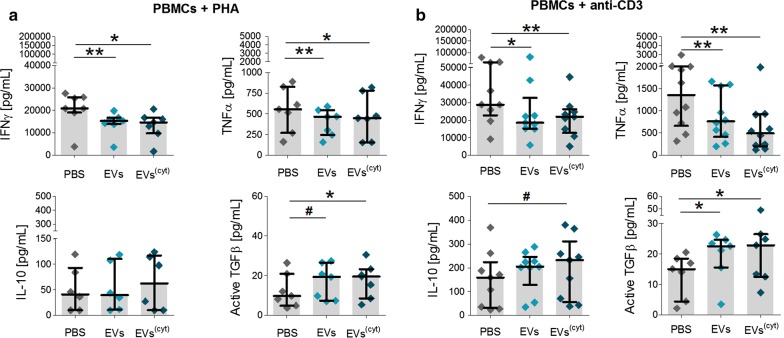
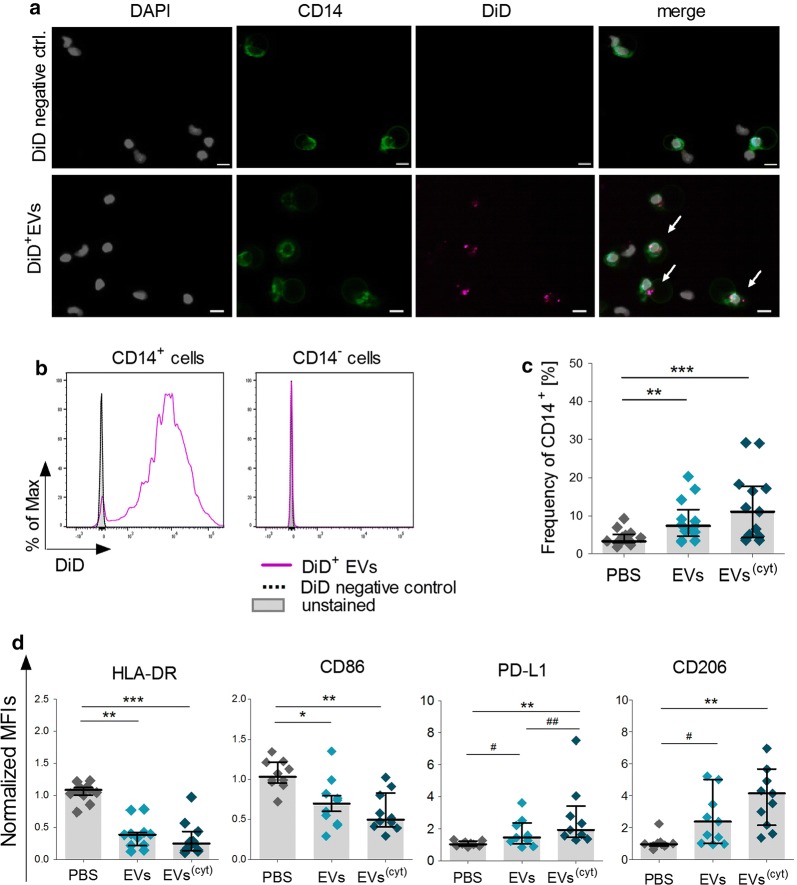
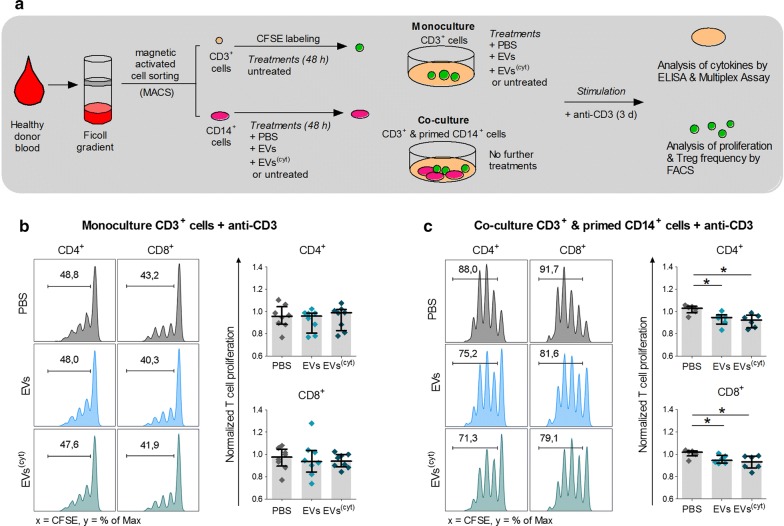
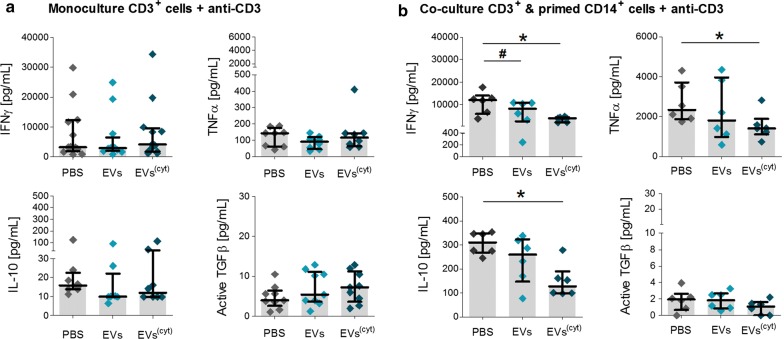
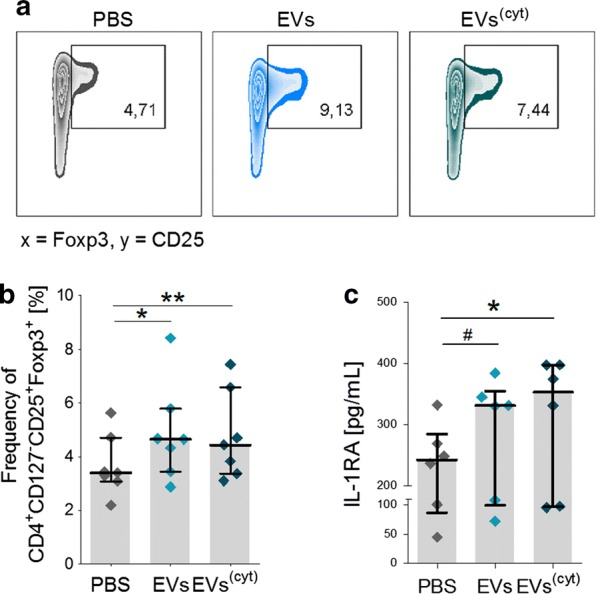
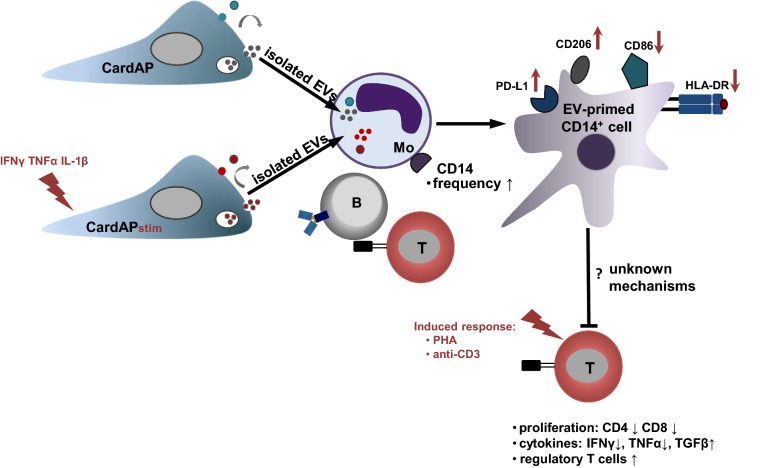
Results: Differential centrifugation was used to isolate EVs from conditioned medium of unstimulated or cytokine-stimulated (IFNγ, TNFα, IL-1β) CardAP cells. The derived EVs exhibited typical EV-enriched proteins, such as tetraspanins, and diameters mostly of exosomes (< 100 nm). The cytokine stimulation caused CardAP cells to release smaller EVs with a lower integrin ß1 surface expression, while the concentration between both CardAP-EV variants was unaffected. An exposure of either CardAP-EV variant to unstimulated human peripheral blood mononuclear cells (PBMCs) did not induce any T cell proliferation, which indicates a general low immunogenicity. In order to evaluate immune modulating properties, PBMC cultures were stimulated with either Phytohemagglutin or anti-CD3. The treatment of those PBMC cultures with either CardAP-EV variant led to a significant reduction of T cell proliferation, pro-inflammatory cytokine release (IFNγ, TNFα) and increased levels of active TGFβ. Further investigations identified CD14+ cells as major recipient cell subset of CardAP-EVs. This interaction caused a significant lower surface expression of HLA-DR, CD86, and increased expression levels of CD206 and PD-L1. Additionally, EV-primed CD14+ cells released significantly more IL-1RA. Notably, CardAP-EVs failed to modulate anti-CD3 triggered T cell proliferation and pro-inflammatory cytokine release in monocultures of purified CD3+ T cells. Subsequently, the immunosuppressive feature of CardAP-EVs was restored when anti-CD3 stimulated purified CD3+ T cells were co-cultured with EV-primed CD14+ cells. Beside attenuated T cell proliferation, those cultures also exhibited a significant increased proportion of regulatory T cells.

Conclusions: CardAP-EVs have useful characteristics that could contribute to enhanced regeneration in damaged cardiac tissue by limiting unwanted inflammatory processes. It was shown that the priming of CD14+ immune cells by CardAP-EVs towards a regulatory type is an essential step to attenuate significantly T cell proliferation and pro-inflammatory cytokine release in vitro.

Keywords: CD14+ myeloid suppressive cells; Cardiac cells; Exosomes; Extracellular vesicles; Immunomodulation; Monocytes.


Conflict of interest statement

The authors declare that they have no competing interests.

Figures

Fig. 1
Fig. 1
Inflammatory cues change the phenotype of CardAP-EVs. a The differential ultracentrifugation protocol is shown to isolate EVs from the conditioned medium under unstimulated (EVs) or cytokine stimulated conditions (EVs(cyt)). b EV protein amount released from 1 × 106 CardAP cells is presented as median with interquartile range (n = 10–21; six different CardAP donors). c Particle concentration of EVs released by 1 × 106 CardAP cells is presented as median with interquartile range (n = 6; three different CardAP donors). d Representative transmission electron microscopy (TEM) images (upper row) with an enlarged region (white square) of interest (lower row) are displayed for both EV variants; scale bars represent 200 nm. e The diameter distribution as observed by TEM is shown for both EV variants of one CardAP donor. f Flow cytometric analyses are presented as median with interquartile range of normalized geometrical mean fluorescence intensities (normalized MFI calculated as ratio of stained to unstained) for tetraspanins (CD9, CD81, CD63), immunological relevant markers (CD54, PD-L1, CD106, HLA-ABC, HLA-DR) and mesenchymal markers (CD29, CD73, CD44, CD90) (n = 5–16; at least three different CardAP donors). Mann–Whitney U-test; ***p < .001, **p < .01, *p < .05
Fig. 2
Fig. 2
The inflammatory cue changes slightly the proteome of CardAP-EVs. Peptides were derived from unstimulated EVs (unstimulated) and cytokine stimulated EVs (cytokine stimulated) by an overnight digestion with trypsin. By liquid chromatography/electron spray ionization mass spectrometry (LC/ES MS) obtained mass spectra were evaluated by MASCOT software searching for protein matches in the SwissProt 51.9 database. a The interaction of proteins was visualized with the help of String database. Protein interactions were shown as connecting lines and were categorized as known interactions (grey connecting lines). The detected proteins are shown as nodes, which appear coloured due to their biological process or localisation (extracellular exosome = red, positive regulation of cellular process = green, angiogenesis = yellow, wound healing = blue, regulation of immune system process = magenta). b Shown is a heat map of the exponentially modified protein abundance index (emPAI) for 35 selected proteins from in total 186 detected proteins and for both EV variants from three CardAP donors. Not detected proteins corresponds to an emPAI value of 0
Fig. 3
Fig. 3
CardAP-EVs diminish PHA and anti-CD3 induced T cell proliferation in PBMC cultures. 3x10⁵ CFSE-labelled PBMCs were stimulated with PHA or anti-CD3, treated with either unstimulated (EVs) or cytokine stimulated (EVs(cyt)) EVs, PBS in equal volume of the EVs (PBS) or left untreated and analysed after 3–5 days by flow cytometry. T cell proliferation frequencies were normalized to the untreated control. a The general immune assay design is shown. b, d Representative flow cytometric plots display the frequencies of proliferated CD4+ and CD8+ T cells in PHA stimulated PBMCs (b) or in in anti-CD3 stimulated PBMCs (d). The normalized proliferation of CD4+ (left) and CD8+ (right) T cells in PHA stimulated PBMCs (c) or in anti-CD3 stimulated PBMCs (e) is presented for the treatment with either CardAP-EV variant and PBS as median with interquartile range (PHA n = 11; four different CardAP donors; five different PBMC donors) (anti-CD3 n = 9; four different CardAP donors; five different PBMC donors). Friedman Test with Dunn’s multiple comparison test: ***p < .001, **p < .01, *p < .05 or Wilcoxon matched-pairs signed rank test; ###p < .001, ##p < .01, #p < .05
Fig. 4
Fig. 4
CardAP-EVs attenuate the PHA and anti-CD3 induced pro-inflammatory cytokine release in PBMC cultures. 3x10⁵ CFSE-labelled PBMCs were stimulated with PHA or anti-CD3 antibody and treated with either unstimulated (EVs) or cytokine stimulated (EVs(cyt)) EVs, PBS in equal volume of the EVs (PBS) or left untreated and analysed after 3–5 days. The cytokines of the supernatants were analysed by ELISA (IFNγ, active TGFβ) or Multiplex (IL-10, TNFα). Concentrations for all tested cytokines are presented for PHA stimulated PBMC cultures (a) or anti-CD3 stimulated PBMC cultures (b) as median with interquartile range (PHA n = 6–7, five different CardAP donors, five different PBMC donors) (anti-CD3 n = 8; four different CardAP donors, four different PBMC donors). Friedman Test with Dunn´s multiple comparison test: ***p < .001, **p < .01, *p < .05 or Wilcoxon matched-pairs signed rank test; ###p < .001, ##p < .01, #p < .05
Fig. 5
Fig. 5
CardAP-EVs prime CD14+ monocytes in unstimulated PBMC cultures towards a regulatory CD14+ myeloid cell type. 1x10⁶ PBMCs were treated with DiD-labelled CardAP-EVs for 24 h and analysed by microscopy or flow cytometry. a Representative images are illustrating co-localization (white arrows) of DiD+EVs (magenta) with CD14+ PBMCs (green) in total PBMCs (pseudo coloured white for DAPI) (n = 2; three different CardAP donors, two different PBMC donors). Scale bars represent 10 µm. b Representative histograms of the flow cytometric analysis are shown for CD14+ and CD14 immune cells (n = 2; three CardAP donors; two different PBMC donors). For the phenotypical analysis, 1x10⁶ PBMCs were treated with unstimulated (EVs) or cytokine stimulated EVs (EVs(cyt)), PBS in equal volume of the EVs (PBS) or left untreated. After 3 days, cells were analysed by flow cytometry. c Frequencies of CD14+ cells in PBMCs are presented for cultures treated with PBS, EVs or EVs(cyt). d Flow cytometric surface expression data are presented as median with interquartile range of normalized geometrical mean fluorescence intensities (normalized MFI calculated as ratio of stained to unstained) for the immunological markers HLA-DR, CD86, PD-L1 and CD206 (n = 11; four CardAP donors, four PBMC donors). Friedman Test with Dunn´s multiple comparison test: ***p < .001, **p < .01, *p < .05 or Wilcoxon matched-pairs signed rank test; ###p < .001, ##p < .01, #p < .05
Fig. 6
Fig. 6
CardAP-EVs diminish anti-CD3 induced T cell proliferation only in the presence of CD14+ cells. CD3+ and CD14+ cells were isolated by MACS and cultured unstimulated for 48 h. Here, CD14+ cells were additionally treated with either unstimulated (EVs) or cytokine stimulated (EVs(cyt)) EVs, PBS in equal volume of the EVs (PBS) or left untreated. Afterwards, CD14+ cells were co-cultured 1:5 with CD3+ cells and stimulated with anti-CD3. Additionally, a negative control was incorporated by treating anti-CD3 stimulated CD3+ cells with either CardAP-EV variant, PBS or left untreated. After 3 days, the cells were harvested and analysed by flow cytometry. T cell proliferation frequencies were normalized to the untreated control. a The general immune assay design is shown. Representative flow cytometric plots display the frequencies of proliferated CD4+ and CD8+ T cells in anti-CD3 stimulated monocultures of CD3+ cells (b, left) and anti-CD3 stimulated co-cultures of CD3+ cells with primed CD14+ cells (c, left). The normalized proliferation of CD4+ (upper graph) and CD8+ (lower graph) T cells in anti-CD3 stimulated monocultures of CD3+ cells (b, right) or in co-culture with primed CD14+ cells (c, right) is presented for the treatment with either CardAP-EV variant and PBS as median with interquartile range (monocultures n = 7; four different CardAP donors; five different PBMC donors) (co-cultures n = 5; four different CardAP donors; four different PBMC donors). Friedman Test with Dunn’s multiple comparison test: ***p < .001, **p < .01, *p < .05 or Wilcoxon matched-pairs signed rank test; ###p < .001, ##p < .01, #p < .05
Fig. 7
Fig. 7
CardAP-EVs attenuate anti-CD3 induced pro-inflammatory cytokine release only in the presence of CD14+ cells. CD3+ and CD14+ cells were isolated by MACS and cultured unstimulated for 48 h. Here, CD14+ cells were additionally treated with either unstimulated (EVs) or cytokine stimulated (EVs(cyt)) EVs, PBS in equal volume of the EVs (PBS) or left untreated. After 2 days, CD14+ cells were co-cultured 1:5 with CD3+ cells and stimulated with anti-CD3. As a negative control, anti-CD3 stimulated T cells were treated with either CardAP-EV variant, PBS or left untreated. After 3 days, the supernatants were collected and cytokine concentrations were analysed by ELISA (IFNγ, active TGFβ) or Multiplex (IL-10, TNFα). Concentrations for all tested cytokines are presented for anti-CD3 stimulated monoculture of CD3+ cells (a) or co-cultures of CD3+ cells with CD14+ cells (b) as median with interquartile range (co-culture n = 6, five different CardAP donors, five different PBMC donors) (monoculture n = 8; four different CardAP donors, four different PBMC donors). Friedman Test with Dunn´s multiple comparison test: ***p < .001, **p < .01, *p < .05 or Wilcoxon matched-pairs signed rank test; ###p < .001, ##p < .01, #p < .05
Fig. 8
Fig. 8
CardAP-EVs increase the frequency of regulatory T cells in anti-CD3 induced co-cultures of CD3+ cells with primed CD14+ cells. CD3+ and CD14+ cells were isolated by MACS and cultured unstimulated for 48 h. Here, CD14+ cells were additionally treated with either unstimulated (EVs) or cytokine stimulated (EVs(cyt)) EVs, PBS in equal volume of the EVs (PBS) or left untreated. Afterwards, CD14+ cells were co-cultured 1:5 with CD3+ cells and stimulated with anti-CD3. After 3 days, the cells were harvested and analysed by flow cytometry. a Representative flow cytometric plots (Foxp3 vs CD25) display the frequencies of regulatory T cells (CD4+CD197CD25+Foxp3+) in anti-CD3 stimulated co-cultures of CD3+ cells and CD14+ cells primed with PBS (left), EVs (middle) and EVs(cyt) (right). b Quantitative analysis of regulatory T cell frequency is shown as median with interquartile range for the treatment with either CardAP-EV variant and PBS (n = 6; four different CardAP donors; four different PBMC donors). c Concentration of released IL-1RA by CD14+ cells after 2-days treatment with either CardAP EV variant or PBS is shown as median with interquartile range (n = 6, four different CardAP donors, four different PBMC donors). Friedman Test with Dunn´s multiple comparison test: ***p < .001, **p < .01, *p < .05 or Wilcoxon matched-pairs signed rank test; ###p < .001, ##p < .01, #p < .05
Fig. 9
Fig. 9
Hypothesized model of the immunomodulatory effects by CardAP-EVs. CardAP cells release EVs under unstimulated or cytokine stimulation (CardAPstim). Isolated EVs interact mainly with the CD14+ monocyte subset (Mo), leading to an enhanced CD14+ frequency and a changed phenotype marked by a reduced expression of HLA-DR and CD86, but enhanced expression of CD206 and PD-L1. We showed that the development of such a CD14+ regulatory myeloid cell subset is mediating the observed attenuated T cell immune responses

Similar articles

Cited by

References

    1. World Health Organization. World Health Statistics 2018: Monitoring Health for the SDGs. Sustainable development goals. 1st ed. New York: Geneva; 2018.
    1. Van Linthout S, Stamm C, Schultheiss H-P, Tschöpe C. Mesenchymal stem cells and inflammatory cardiomyopathy: cardiac homing and beyond. Cardiol Res Pract. 2011;2011:757154. - PMC - PubMed
    1. Savvatis K, van Linthout S, Miteva K, Pappritz K, Westermann D, Schefold JC, et al. Mesenchymal stromal cells but not cardiac fibroblasts exert beneficial systemic immunomodulatory effects in experimental myocarditis. PLoS ONE. 2012;7(7):1–16. - PMC - PubMed
    1. Gerstenblith G, Johnston PV, Marbán L, Bonow RO, Marbán E, Mendizabal A, et al. Intracoronary cardiosphere-derived cells after myocardial infarction. J Am Coll Cardiol. 2013;63(2):110–122. - PMC - PubMed
    1. Montanari S, Dayan V, Yannarelli G, Billia F, Viswanathan S, Connelly KA, et al. Mesenchymal stromal cells improve cardiac function and left ventricular remodeling in a heart transplantation model. J Hear Lung Transplant. 2015;34(11):1481–1488. - PubMed

MeSH terms