

Comprehensive characterization of immune- and inflammation-associated biomarkers based on multi-omics integration in kidney renal clear cell carcinoma
- PMID: 31133033
- PMCID: PMC6537414
- DOI: 10.1186/s12967-019-1927-y
Comprehensive characterization of immune- and inflammation-associated biomarkers based on multi-omics integration in kidney renal clear cell carcinoma
Abstract
Background: Kidney renal clear cell carcinoma (KIRC) is the most common type of kidney cancer in adults, and it is responsible for approximately 90-95% of cases. Although extensive evidence has suggested that many immune- and inflammation-related genes could serve as effective biomarkers in KIRC, the potential associations among immune-, inflammation- and KIRC-related genes has not been sufficiently understood.
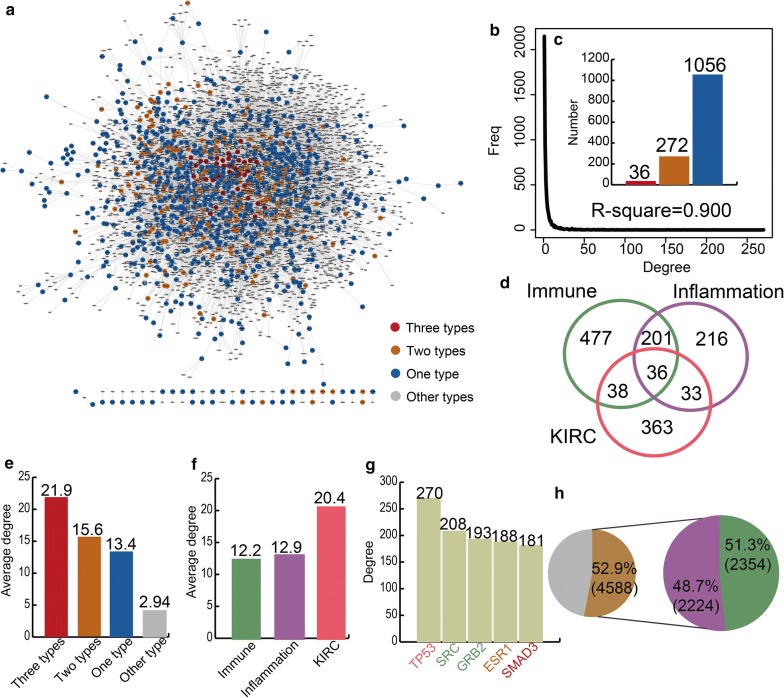
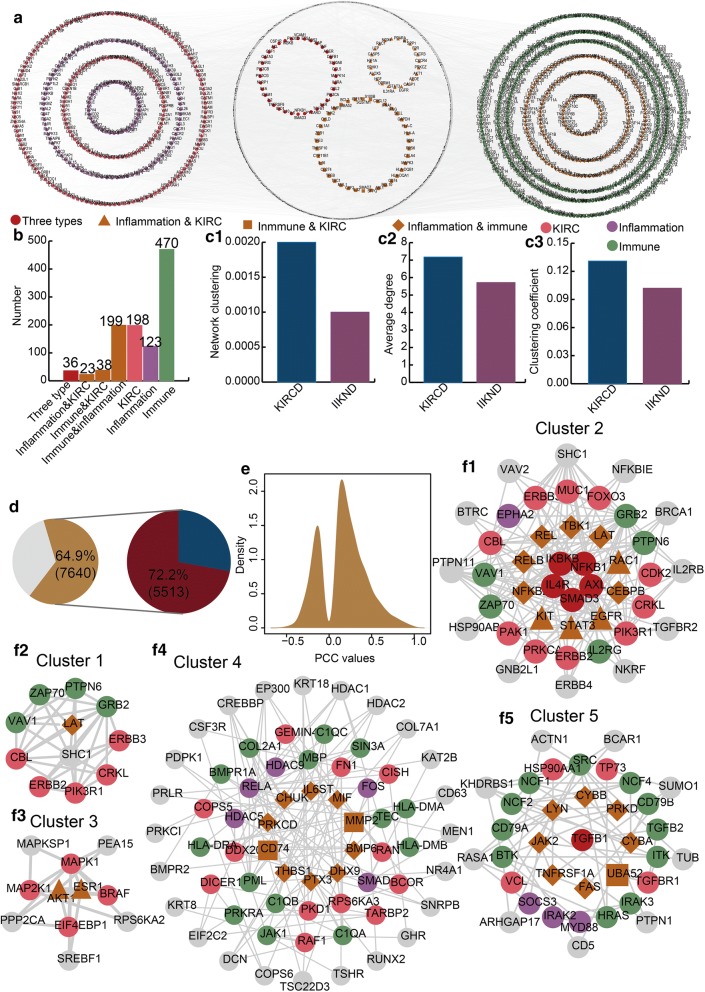
Methods: Here, we integrated multiple levels of data to construct an immune-, inflammation- or KIRC-directed neighbour network (IIKDN network) and a KIRC-related gene-directed network (KIRCD network).
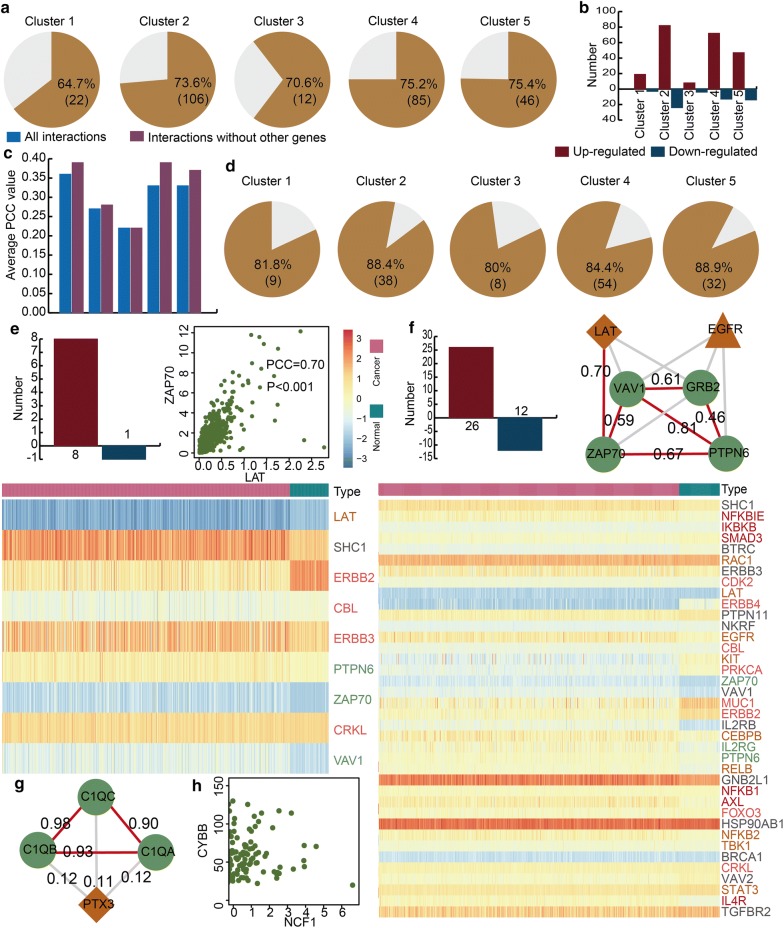
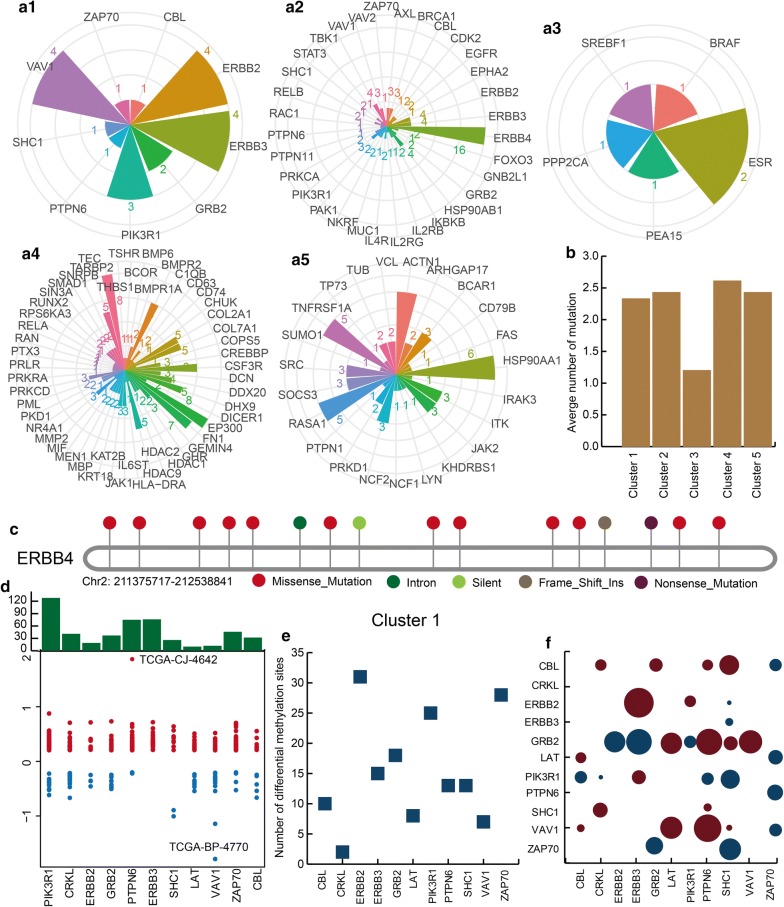
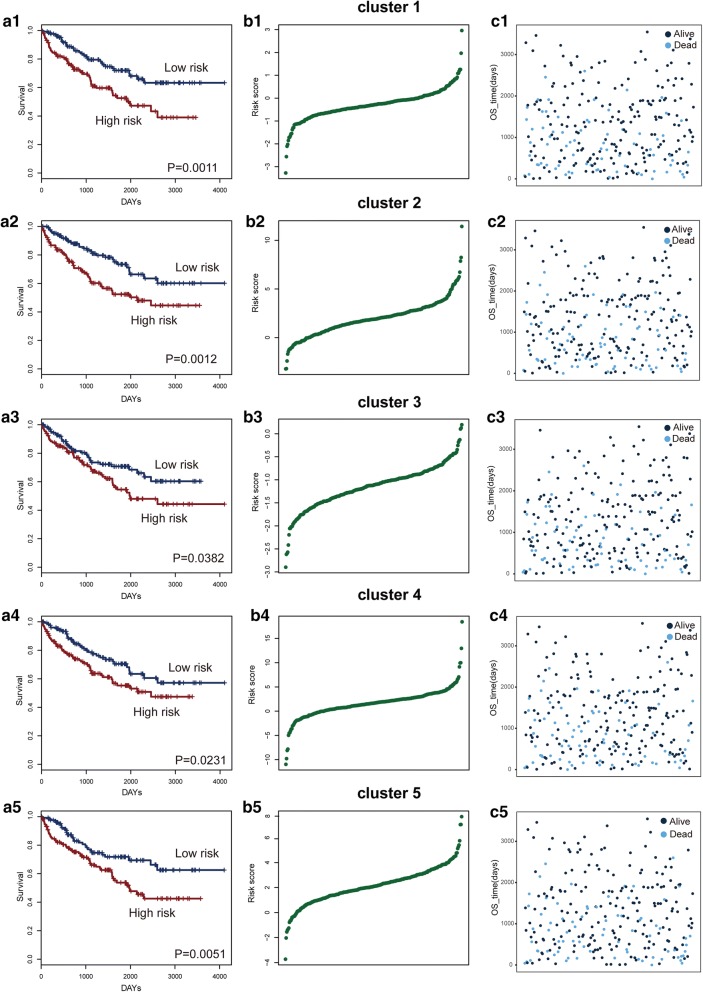
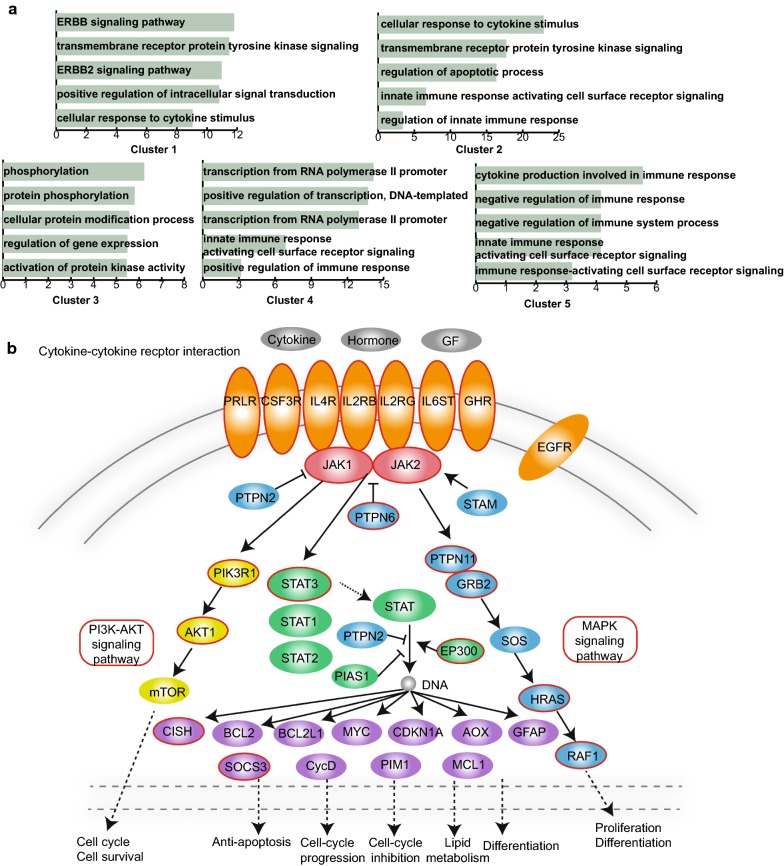
Results: Our analysis suggested that immune- and inflammation-related genes in the network have special topological characteristics and expression patterns related to KIRC. We further identified five core clusters that showed a tighter network structure and stronger correlation of expression from the KIRCD network. Specifically, multiple-level molecular characteristics were systematically portrayed, including somatic mutation, copy-number variant and DNA methylation for the genes in five core clusters. We discovered that the genes showed strong correlation with respect to the expression and methylation levels in these five core clusters. These five core clusters could become special prognostic biomarkers for KIRC, and functional analysis showed that they were associated with activation of the immune and inflammation systems and cancer progression.
Conclusions: Our findings highlighted the novel role of the immune and inflammation genes in KIRC.
Keywords: DNA methylation; Immune; Inflammation; Kidney renal clear cell carcinoma; Multi-omics molecular; Network modules.
Conflict of interest statement
The authors declare that they have no competing interests.
Figures
Similar articles
-
Systematic analysis of alternative splicing signature unveils prognostic predictor for kidney renal clear cell carcinoma.J Cell Physiol. 2019 Dec;234(12):22753-22764. doi: 10.1002/jcp.28840. Epub 2019 May 29. J Cell Physiol. 2019. PMID: 31140607 Free PMC article.
-
Unique protein expression signatures of survival time in kidney renal clear cell carcinoma through a pan-cancer screening.BMC Genomics. 2017 Oct 3;18(Suppl 6):678. doi: 10.1186/s12864-017-4026-6. BMC Genomics. 2017. PMID: 28984208 Free PMC article.
-
Prognostic value of cross-omics screening for kidney clear cell renal cancer survival.Biol Direct. 2016 Dec 20;11(1):68. doi: 10.1186/s13062-016-0170-1. Biol Direct. 2016. PMID: 27993167 Free PMC article.
-
Genomic classifications of renal cell carcinoma: a critical step towards the future application of personalized kidney cancer care with pan-omics precision.J Pathol. 2018 Apr;244(5):525-537. doi: 10.1002/path.5022. Epub 2018 Feb 14. J Pathol. 2018. PMID: 29266437 Review.
-
Genomics and epigenomics of clear cell renal cell carcinoma: recent developments and potential applications.Cancer Lett. 2013 Dec 1;341(2):111-26. doi: 10.1016/j.canlet.2013.08.006. Epub 2013 Aug 7. Cancer Lett. 2013. PMID: 23933176 Review.
Cited by
-
Evaluating Established Roles, Future Perspectives and Methodological Heterogeneity for Wilms' Tumor 1 (WT1) Antigen Detection in Adult Renal Cell Carcinoma, Using a Novel N-Terminus Targeted Antibody (Clone WT49).Biomedicines. 2022 Apr 15;10(4):912. doi: 10.3390/biomedicines10040912. Biomedicines. 2022. PMID: 35453662 Free PMC article.
-
Survival correlation of immune response in human cancers.Oncotarget. 2019 Dec 3;10(64):6885-6897. doi: 10.18632/oncotarget.27360. eCollection 2019 Dec 3. Oncotarget. 2019. PMID: 31839882 Free PMC article.
-
A novel inflammation-associated prognostic signature for clear cell renal cell carcinoma.Oncol Lett. 2022 Jul 12;24(3):307. doi: 10.3892/ol.2022.13427. eCollection 2022 Sep. Oncol Lett. 2022. PMID: 35949606 Free PMC article.
-
Identification of an independent immune-genes prognostic index for renal cell carcinoma.BMC Cancer. 2021 Jun 29;21(1):746. doi: 10.1186/s12885-021-08367-6. BMC Cancer. 2021. PMID: 34187413 Free PMC article.
-
Expression and clinical significance of DOK3 in renal clear cell carcinoma.J Int Med Res. 2023 May;51(5):3000605231174974. doi: 10.1177/03000605231174974. J Int Med Res. 2023. PMID: 37235715 Free PMC article.
References
Publication types
MeSH terms
Substances
LinkOut - more resources
Full Text Sources
Medical
Molecular Biology Databases
