. 2019 May 27;9(1):7862.
doi: 10.1038/s41598-019-44203-5.

Co-expression network analysis identifies gonad- and embryo-associated protein modules in the sentinel species Gammarus fossarum

Affiliations

Co-expression network analysis identifies gonad- and embryo-associated protein modules in the sentinel species Gammarus fossarum

Davide Degli Esposti et al. Sci Rep. .

Abstract

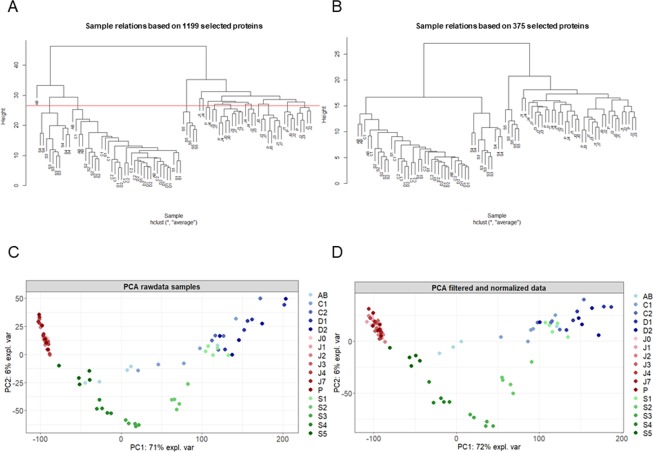
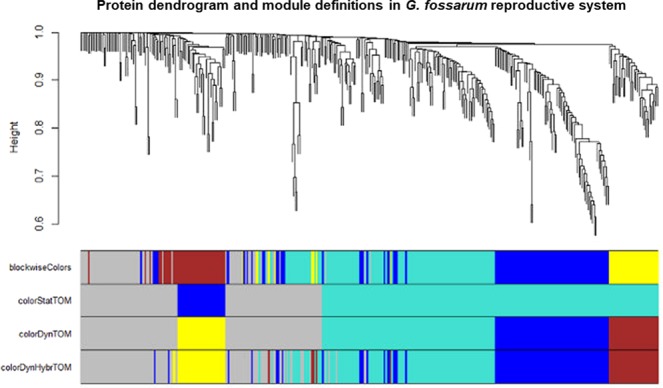
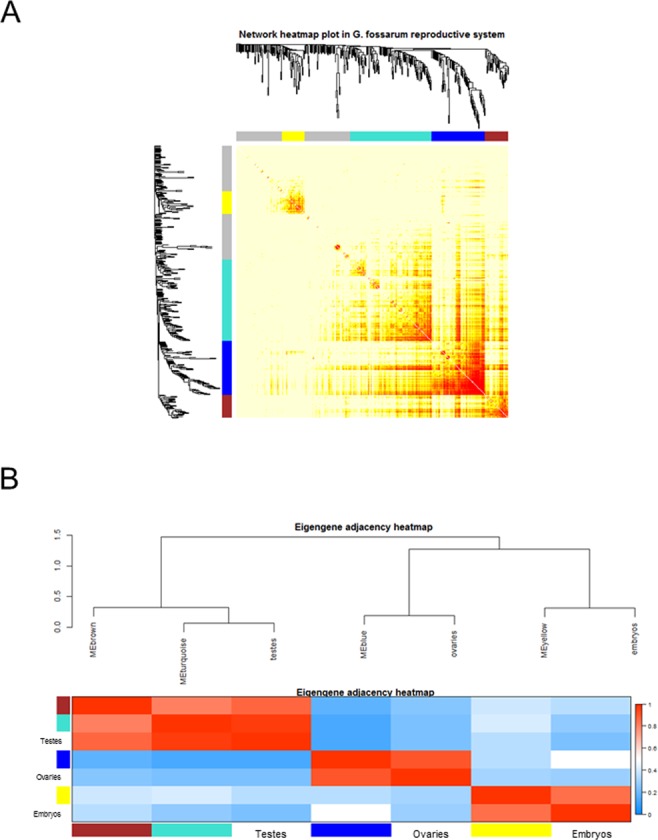
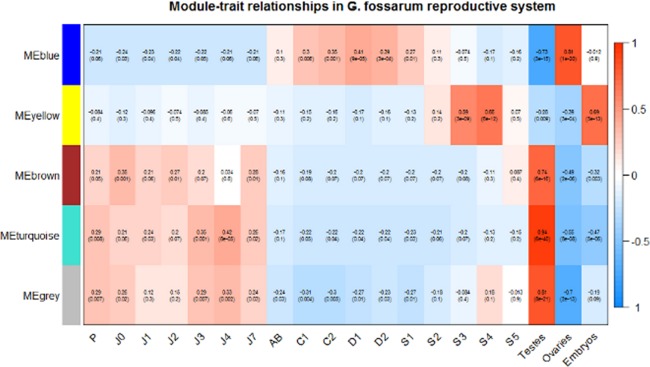
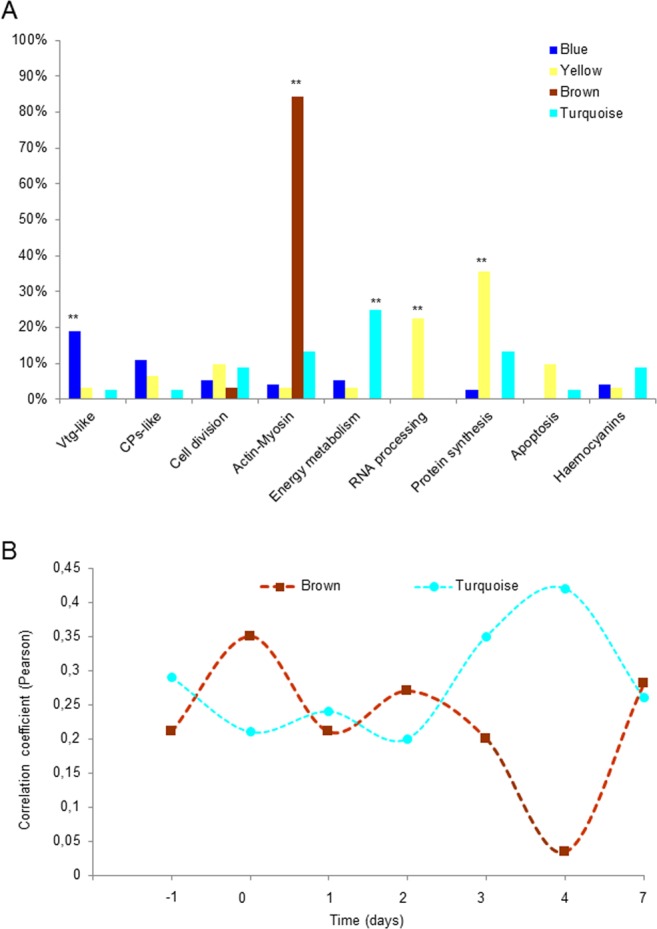
Next generation sequencing and mass spectrometry technologies have recently expanded the availability of whole transcriptomes and proteomes beyond classical model organisms in molecular biology, even in absence of an annotated genome. However, the fragmented nature of transcriptomic and proteomic data reduces the ability to interpret the data, notably in non-model organisms. Network-based approaches may help extracting important biological information from -omics datasets. The reproductive cycle of the freshwater crustacean Gammarus fossarum.provides an excellent case study to test the relevance of a network analysis in non-model organisms. Here, we illustrated how the use of a co-expression network analysis (based on Weighted Gene Co-expression Network Analysis algorithm, WGCNA) allowed identifying protein modules whose expression profiles described germ cell maturation and embryonic development in the freshwater crustacean Gammarus fossarum. Proteome datasets included testes, ovaries or embryos samples at different maturation or developmental stages, respectively. We identified an embryonic module correlated with mid-developmental stages corresponding to the organogenesis and it was characterized by enrichment in proteins involved in RNA editing and splicing. An ovarian module was enriched in vitellogenin-like proteins and clottable proteins, confirming the diversity of proteins belonging to the large lipid transfer family involved in oocytes maturations in this freshwater amphipod. Moreover, our results found evidence of a fine-tuned regulation between energy production by glycolysis and actin-myosin-dependent events in G. fossarum spermatogenesis. This study illustrates the importance of applying systems biology approaches to emergent animal models to improve the understanding of the molecular mechanisms regulating important physiological events with ecological relevance.


Conflict of interest statement

The authors declare no competing interests.

Figures

Figure 1
Figure 1
Proteomic profiles clearly distinguish testes, ovaries and embryos of G. fossarum. Blue dots indicate the different molt stages in females (AB, C1, C2, D1 and D2). Red dots indicate the testes at different maturation stages: P indicates testes in the pre-copula stage. J0, J1, J2, J3, J4, J7 indicate the days after copulation. Green dots indicate the different embryonic development stages (S1, S2, S3, S4, and S5). (A) Hierarchical clustering of raw data. (B) Hierarchical clustering after filtering and normalization. (C) Principal component analysis of raw data. (D) Principal component analysis after filtering and normalization.
Figure 2
Figure 2
Distinct protein modules can be identified using co-expression network analysis. Protein dendrogram and module delimitation based on different clustering methods (see Materials & Method section). Modules group the proteins that have a high level of co-expression, based on pair-wise correlations between protein abundance. Four protein modules (indicated by colors: yellow, turquoise, blue or brown) were identified by 3 different clustering methods.
Figure 3
Figure 3
Distinct modules interact differently each other. (A) The heatmap shows the Topological Overlap Matrix (TOM) values among the proteins of the network delimited in modules by the dynamic method. Light yellow color represents low overlap (i.e. low interconnection), while dark red color represents high overlap (i.e. high interconnection). (B) The module eigengene adjacency showed by hierarchical clustering and heatmap. A module eigengene summarizes the protein expression profile of each module. Testes cluster together with the turquoise and brown module eigengenes, embryos with the yellow one and ovaries with the blue one.
Figure 4
Figure 4
Testes, ovaries and embryos of G. fossarum are distinctively associated with different protein modules. Each row corresponds to a module eigengene, each column to a different developmental (for the embryos) and maturity (for the gonads) stages (on the left side) or different organ/tissue (on the right side). In each cell, the correlation value and the p-value (in parenthesis) for each module-stage association are shown.
Figure 5
Figure 5
Different protein modules are differentially enriched in distinct molecular functions. (A) Percentage of modules’ proteins for each molecular function identified. **p-value < 0.01, Fisher’s exact-test. (B) Temporal variation of the correlation coefficient between brown module and turquoise module eigengenes and the phenotypic trait “testes”. The results show that the two modules are highly interconnected and their expression profiles regulated in a tightly coordinate manner.

References

    1. Armengaud J, et al. Non-model organisms, a species endangered by proteogenomics. J Proteomics. 2014;105:5–18. doi: 10.1016/j.jprot.2014.01.007. - DOI - PubMed
    1. Trapp J, et al. Proteogenomics of Gammarus fossarum to document the reproductive system of amphipods. Mol. Cell Proteomics. 2014;13:3612–3625. doi: 10.1074/mcp.M114.038851. - DOI - PMC - PubMed
    1. Zhang, B. & Horvath, S. A general framework for weighted gene co-expression network analysis. Stat Appl Genet Mol Biol4, Article17 (2005). - PubMed
    1. Langfelder P, Horvath S. WGCNA: an R package for weighted correlation network analysis. BMC Bioinformatics. 2008;9:559. doi: 10.1186/1471-2105-9-559. - DOI - PMC - PubMed
    1. Degli Esposti D, et al. Identification of novel long non-coding RNAs deregulated in hepatocellular carcinoma using RNA-sequencing. Oncotarget. 2016;7:31862–31877. - PMC - PubMed

Publication types