. 2019 Jul;121(1):37-50.
doi: 10.1038/s41416-019-0477-7. Epub 2019 May 28.

Transcriptional and metabolic rewiring of colorectal cancer cells expressing the oncogenic KRASG13D mutation

Affiliations

Transcriptional and metabolic rewiring of colorectal cancer cells expressing the oncogenic KRASG13D mutation

Theodosia Charitou et al. Br J Cancer. 2019 Jul.

Abstract

Background: Activating mutations in KRAS frequently occur in colorectal cancer (CRC) patients, leading to resistance to EGFR-targeted therapies.

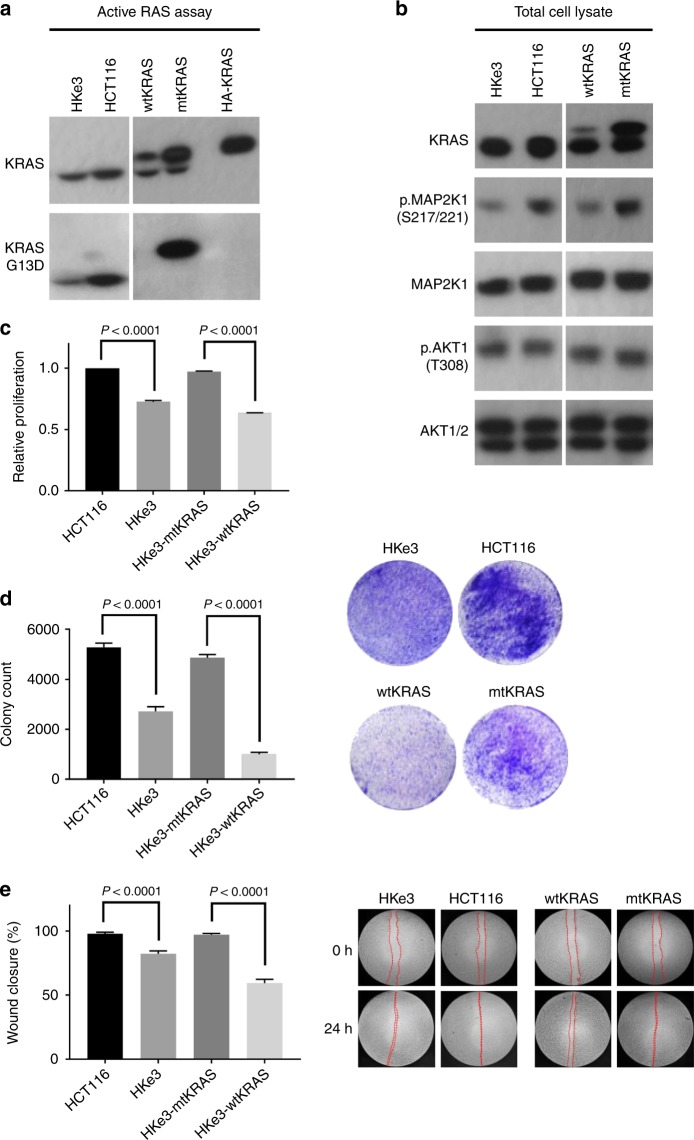
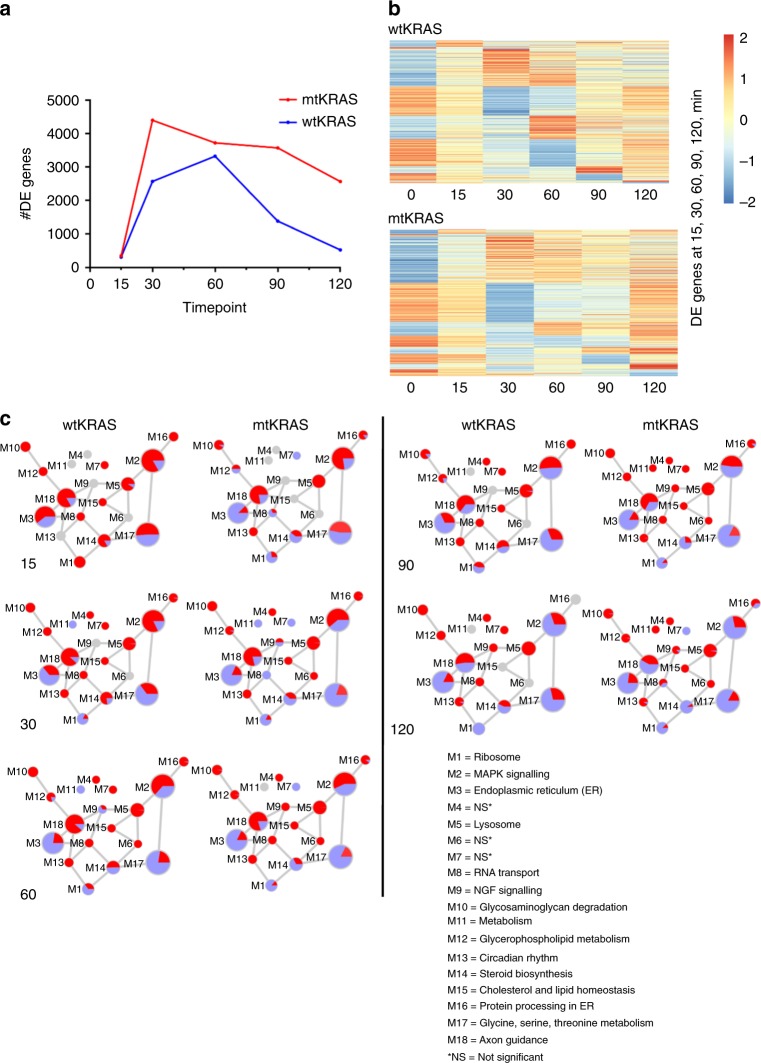
Methods: To better understand the cellular reprogramming which occurs in mutant KRAS cells, we have undertaken a systems-level analysis of four CRC cell lines which express either wild type (wt) KRAS or the oncogenic KRASG13D allele (mtKRAS).

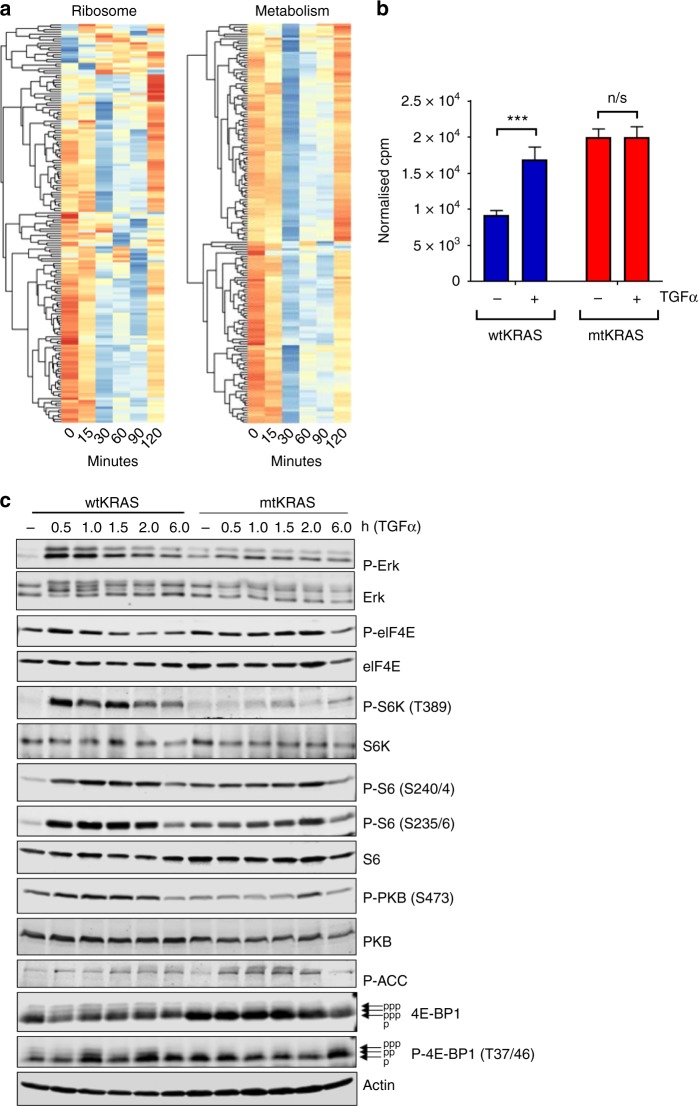
Results: RNAseq revealed that genes involved in ribosome biogenesis, mRNA translation and metabolism were significantly upregulated in mtKRAS cells. Consistent with the transcriptional data, protein synthesis and cell proliferation were significantly higher in the mtKRAS cells. Targeted metabolomics analysis also confirmed the metabolic reprogramming in mtKRAS cells. Interestingly, mtKRAS cells were highly transcriptionally responsive to EGFR activation by TGFα stimulation, which was associated with an unexpected downregulation of genes involved in a range of anabolic processes. While TGFα treatment strongly activated protein synthesis in wtKRAS cells, protein synthesis was not activated above basal levels in the TGFα-treated mtKRAS cells. This was likely due to the defective activation of the mTORC1 and other pathways by TGFα in mtKRAS cells, which was associated with impaired activation of PKB signalling and a transient induction of AMPK signalling.

Conclusions: We have found that mtKRAS cells are substantially rewired at the transcriptional, translational and metabolic levels and that this rewiring may reveal new vulnerabilities in oncogenic KRAS CRC cells that could be exploited in future.


Conflict of interest statement

The authors declare no competing interests.

Figures

Fig. 1
Fig. 1
Characterisation of the HKe3-wtKRAS, HKe3-mtKRAS, HKe3 and HCT116 cell lines. a The upper band shows a KRAS activity assay, which detects binding of KRAS to the RAS-binding domain of RAF1 (RBD pulldown assay). These data show that mtKRAS cells have higher active KRAS compared to HKe3-wtKRAS cells. Two bands are detected as the HKe3-wtKRAS and mtKRAS cells express HA-tagged and untagged KRAS. The detection of HA-tagged KRAS is shown in the fifth lane as a positive control. The lower band shows the detection of KRASG13D (using a KRASG13D-specific antibody) in the HKe3-mtKRAS cells (HA-tagged). KRASG13D is also detected in the HCT116 and HKe3 cells. b Total cell lysate analysis shows that total KRAS expression was higher in HKe3-mtKRAS cells compared to HKe3-wtKRAS cells. Although total MAP2K1 (MEK1) expression was similar between the four cell lines, pMAP2K1 (S217/221) was higher in mtKRAS cells indicating stronger activation of the MAPK/ERK pathway. AKT1/2 and pAKT1(T308) levels were similar in the four cell lines. c–e The rate of proliferation (c), colony formation (d) and wound closure (e) was significantly higher in HKe3-mtKRAS cells compared to HKe3-wtKRAS cells. As expected HKe3-mtKRAS cells exhibited a phenotype similar to the HCT116 cells. Error bars represent the mean ±  SD. Statistical significance was assessed using a Student’s t-test
Fig. 2
Fig. 2
Transcriptional reprogramming of mtKRAS cells relative to wtKRAS cells. a Heatmap showing the expression (log2 CPM) of genes that were differentially expressed between HKe3-wtKRAS and HKe3-mtKRAS cells or HKe3-wtKRAS and HCT116 cells. The colour scale runs from blue to red representing lower to higher gene expression. b KEGG pathways that were significantly enriched among genes upregulated in HKe3-mtKRAS cells (in comparison to HKe3-wtKRAS cells). The dashed line represents the threshold for statistical significance at the α = 0.05 level. See also Supplementary Table 4. c Significantly enriched transcription factor-binding sites (TFBSs) in the promoters of genes upregulated in HKe3-mtKRAS cells. d Pathways that were significantly enriched among genes downregulated in HKe3-mtKRAS cells (in comparison to HKe3-wtKRAS cells). e Significantly enriched TFBSs in the promoters of genes downregulated in mtKRAS cells. f Network of modules identified using WGCNA showing the proportion of HKe3-mtKRAS upregulated (red) and downregulated (blue) genes mapping to each module. Only DE genes are shown. Each module is represented as a node in the module–module network, where node size is proportional to the number of genes assigned to that module. Edges represent significant co-expression between genes in different modules. Modules are annotated based on the most enriched KEGG pathways or GO terms. NS = module was not enriched for any KEGG/GO term
Fig. 3
Fig. 3
Metabolic reprogramming of mtKRAS cells. a Heatmap showing upregulated (red) KEGG metabolic pathways in HKe3-mtKRAS and HCT116 cells compared to HKe3-wtKRAS. The colour scale runs from blue to red representing lower to higher gene expression. b Heatmap showing the metabolite classes that were found to be significantly differentially abundant in HKe3-mtKRAS or HCT116 cells relative to HKe3-wtKRAS cells. c Principal component analysis (PCA) of targeted metabolomics data from HKe3-wtKRAS, HKe3-mtKRAS, HKe3, and HCT116 cells. d Enriched pathways among metabolites that are significantly more abundant in HKe3-mtKRAS cells
Fig. 4
Fig. 4
HKe3-mtKRAS cells are highly transcriptionally responsive to further activation of the EGFR pathway via TGFα stimulation. a Number of differentially expressed genes at 15, 30, 60, 90 and 120 min following TGFα stimulation (relative to unstimulated) in HKe3-wtKRAS, HKe3-mtKRAS, HKe3 and HCT116 cells. b Heatmaps showing expression levels of DE genes post-TGFα stimulation in HKe3-wtKRAS and HKe3-mtKRAS cells. Gene expression at 0 min (prior to stimulation) is shown for comparison. The heatmaps reveal distinct “blocks” of genes that are up- or downregulated at the different time points, revealing unique temporal waves of transcription post-stimulation in both cell lines. Similar data for HKe3 and HCT116 cells not shown. c Network of modules identified using WGCNA showing the proportion of HKe3-mtKRAS upregulated (red) and downregulated (blue) genes mapping to each module at each time point. Only DE genes are shown. Each module is represented as a node in the module-module network, where node size is proportional to the number of genes assigned to that module. Edges represent significant co-expression between genes in different modules. Modules are annotated based on the most enriched KEGG pathways or GO terms. NS = module was not enriched for any KEGG/GO term
Fig. 5
Fig. 5
Deficient activation of protein synthesis in HKe3-mtKRAS cells after TGFα stimulation. a Heatmap showing the transcriptional response of genes involved in the KEGG “ribosome” and “metabolism” pathways at 0, 15, 30, 60, 90 and 120 min after stimulation with TGFα in HKe3-mtKRAS cells. b The rate of protein synthesis, as assessed by the incorporation of [35S]methionine into HKe3-wtKRAS and HKe3-mtKRAS cells, with or without stimulation by TGFα. Cpm values were normalised to concentrations of intracellular methionine. c HKe3-wtKRAS and HKe3-mtKRAS cells were starved of serum for 18 h and then stimulated with 0.01 μg/mL TGFα for the indicated periods of time. Cells were then lysed, and lysates were subjected to SDS-PAGE and immunoblotting analysis using the indicated phospho- (P-) or total proteins. The arrows next to the images for 4E-BP1 indicate the differentially phosphorylated forms of 4E-BP1 (also shown by p, pp; note that more heavily phosphorylated forms of 4E-BP1 migrate more slowly)

References

    1. Brody H. Colorectal cancer. Nature. 2015;521:S1. doi: 10.1038/521S1a. - DOI - PubMed
    1. Papke B, Der CJ. Drugging RAS: know the enemy. Science. 2017;355:1158–1163. doi: 10.1126/science.aam7622. - DOI - PubMed
    1. Sasaki T, Hiroki K, Yamashita Y. The role of epidermal growth factor receptor in cancer metastasis and microenvironment. Biomed. Res. Int. 2013;2013:546318. doi: 10.1155/2013/546318. - DOI - PMC - PubMed
    1. Cox AD, Fesik SW, Kimmelman AC, Luo J, Der CJ. Drugging the undruggable RAS: mission possible? Nat. Rev. Drug Discov. 2014;13:828–851. doi: 10.1038/nrd4389. - DOI - PMC - PubMed
    1. Neumann J, Zeindl-Eberhart E, Kirchner T, Jung A. Frequency and type of KRAS mutations in routine diagnostic analysis of metastatic colorectal cancer. Pathol. Res. Pract. 2009;205:858–862. doi: 10.1016/j.prp.2009.07.010. - DOI - PubMed

Publication types

MeSH terms

Substances