. 2019 Jul;29(7):579-591.
doi: 10.1038/s41422-019-0181-4. Epub 2019 May 27.

AIF-regulated oxidative phosphorylation supports lung cancer development

Affiliations

AIF-regulated oxidative phosphorylation supports lung cancer development

Shuan Rao et al. Cell Res. 2019 Jul.

Abstract

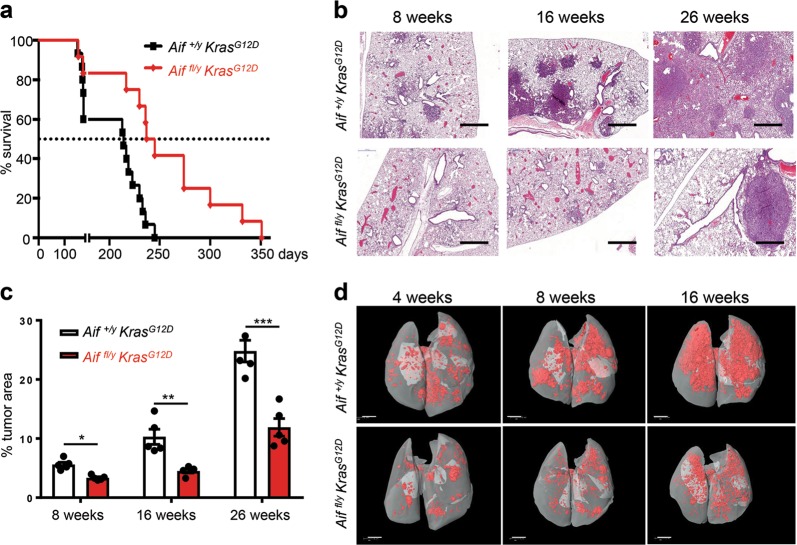
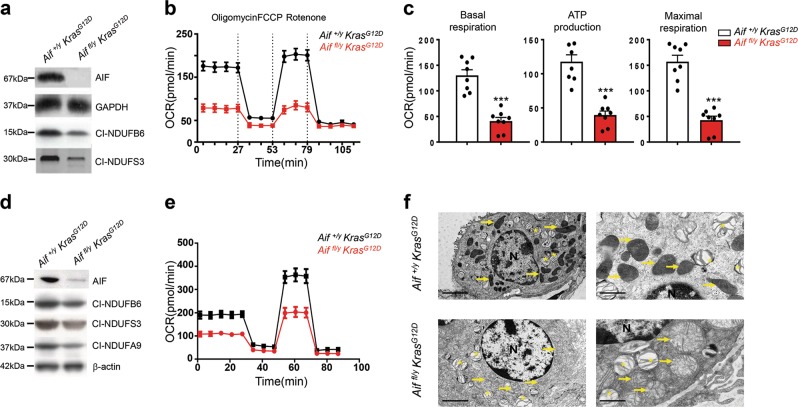
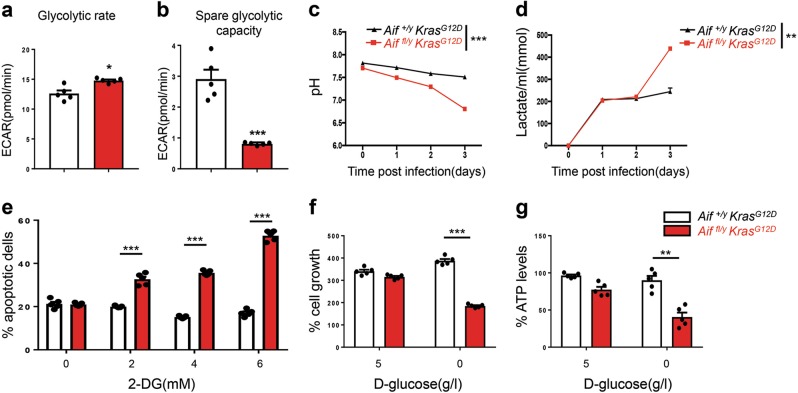
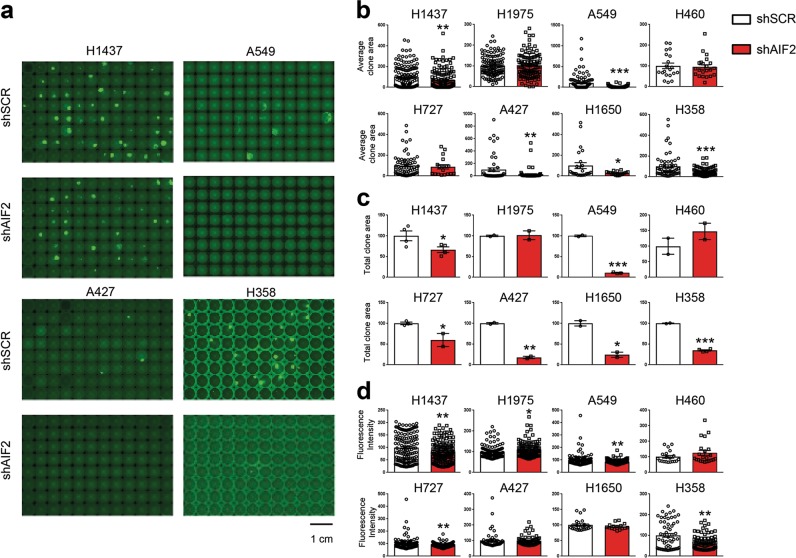
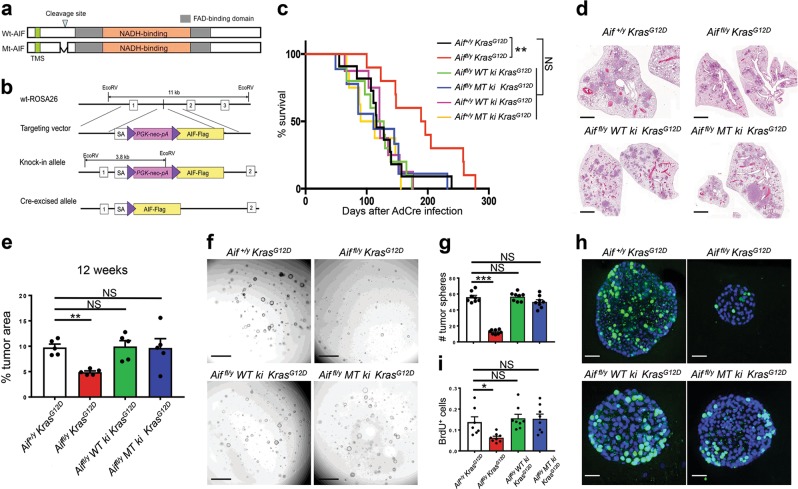
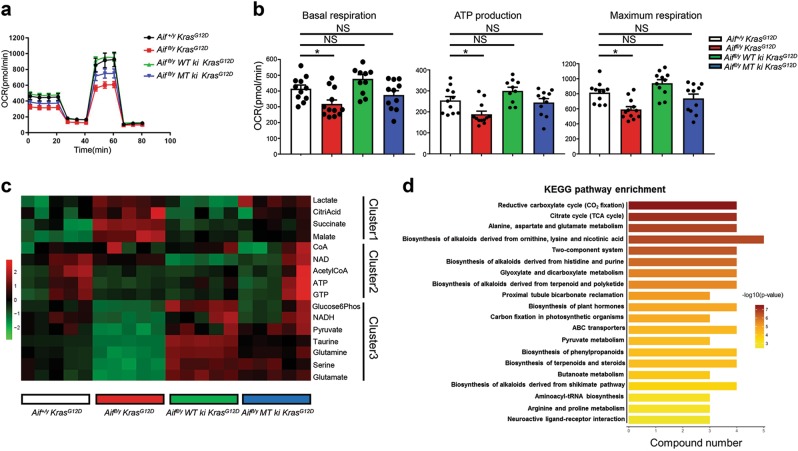
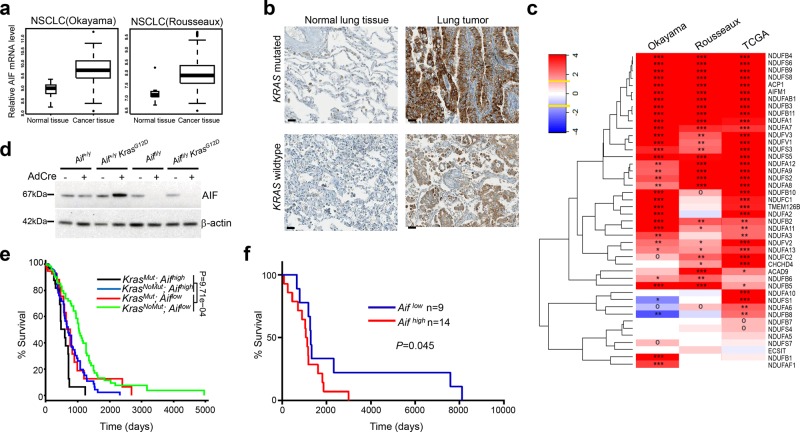
Cancer is a major and still increasing cause of death in humans. Most cancer cells have a fundamentally different metabolic profile from that of normal tissue. This shift away from mitochondrial ATP synthesis via oxidative phosphorylation towards a high rate of glycolysis, termed Warburg effect, has long been recognized as a paradigmatic hallmark of cancer, supporting the increased biosynthetic demands of tumor cells. Here we show that deletion of apoptosis-inducing factor (AIF) in a KrasG12D-driven mouse lung cancer model resulted in a marked survival advantage, with delayed tumor onset and decreased malignant progression. Mechanistically, Aif deletion leads to oxidative phosphorylation (OXPHOS) deficiency and a switch in cellular metabolism towards glycolysis in non-transformed pneumocytes and at early stages of tumor development. Paradoxically, although Aif-deficient cells exhibited a metabolic Warburg profile, this bioenergetic change resulted in a growth disadvantage of KrasG12D-driven as well as Kras wild-type lung cancer cells. Cell-autonomous re-expression of both wild-type and mutant AIF (displaying an intact mitochondrial, but abrogated apoptotic function) in Aif-knockout KrasG12D mice restored OXPHOS and reduced animal survival to the same level as AIF wild-type mice. In patients with non-small cell lung cancer, high AIF expression was associated with poor prognosis. These data show that AIF-regulated mitochondrial respiration and OXPHOS drive the progression of lung cancer.


Conflict of interest statement

The authors declare no competing interests.

Figures

Fig. 1
Fig. 1
Reduced lung cancer in Aif-deficient KrasG12D mice. a Aif deletion significantly prolongs the survival of mice infected with Ad5-CMV-Cre in comparison to their Aif WT controls. Kaplan–Meier plot. P = 0.0022 (log rank test) for Aiffl/y KrasG12D (n = 12) versus Aif+/y KrasG12D (n = 15) littermates. b Representative lung tumor sections (H&E staining) in Aiffl/y KrasG12D and Aif+/y KrasG12D littermates at the indicated time points after Ad5-CMV-Cre inhalation. Scale bar, 2 mm. c Quantification of overall tumor burden. Total tumor areas comprising hyperplasia, adenomas, and adenocarcinomas, were scored automatically by a Definiens software algorithm. Three planes from each lung were stained with H&E and analyzed in a blinded fashion. Data are shown as means ± SEM. *P < 0.05; **P < 0.01; ***P < 0.001 (Student’s t-test). n = 5 per genotype for each time point. d Micro-CT analysis of lung tumors of Aiffl/y KrasG12D and Aif+/y KrasG12D littermate mice, analyzed at the indicated weeks after Ad5-CMV-Cre inhalation. Representative data from individual mice are shown. Scale bar, 2 mm
Fig. 2
Fig. 2
Loss of AIF compromises OXPHOS and impairs mitochondrial structure in lung tumor cells. a Western blotting for AIF protein and the indicated OXPHOS complex I proteins in primary pneumocytes isolated from Aiffl/y KrasG12D and Aif+/y KrasG12D mice and consequently transfected with Ad5-CMV-Cre-eGFP in vitro. GAPDH was used as a loading control. b, c Representative OCR (b) and comparison (means ± SEM) of basal respiration, ATP production and maximal respiration (c) in primary pneumocytes isolated from Aiffl/y KrasG12D and Aif+/y KrasG12D mice and consequently transfected with Ad5-CMV-Cre in vitro. d Western blotting for AIF protein and the indicated OXPHOS complex I proteins in pneumocytes isolated from Aiffl/y KrasG12D and Aif+/y KrasG12D mice 6 weeks after Ad5-CMV-Cre inhalation. β-actin was used as a loading control. e Representative OCR analysis of purified transformed pneumocytes isolated from Aiffl/y KrasG12D and Aif+/y KrasG12D mice 6 weeks after Ad5-CMV-Cre inhalation. f Representative electron microscopy images for tumor tissues isolated from Aif+/y KrasG12D (upper panels) and Aiffl/y KrasG12D mice (lower panels) 18 weeks after Ad5-CMV-Cre inhalation. Note normal mitochondrial morphology with mostly intact cristae in AIF-competent tumors in contrast to swollen mitochondria with notable cristolysis in Aif-deficient lung tumor tissues (yellow arrows). Asterisks indicate lamellar bodies (Corpuscula lamellariae), rare cell organelles containing surfactant lipoproteins characteristic for type II pneumocytes. N indicates nuclei. Scale bars, 5 μm for left panel and 2 μm for right panel
Fig. 3
Fig. 3
AIF deficiency enhances glycolysis and sensitivity to glucose deprivation. a, b ECAR in pneumocytes isolated from Aif+/y KrasG12D and Aiffl/y KrasG12D mice 6 weeks after Ad5-CMV-Cre inhalation. Basal glycolytic rate after stimulation with glucose (a) and change in ECAR over baseline after oligomycin treatment (b). *P < 0.05; ***P < 0.001 (Unpaired two-sided t-test). c, d pH measurements (c) and lactate production (d) in the culture media of primary pneumocytes isolated from Aif+/y KrasG12D and Aiffl/y KrasG12D mice 6 weeks after Ad5-CMV-Cre inhalation. Cells were seeded on day 0 with a density of 2.5 × 105 cells/well in a 6-well plate. Data are shown as means ± SEM. n = 5 per genotype. **P < 0.01; ***P < 0.001 (Two-way ANOVA test). e Aif+/y KrasG12D and Aiffl/y KrasG12D pneumocytes were cultured for 72 h in the presence of the indicated concentrations of 2-DG followed by staining with PI to determine the frequency of dead cells. ***P < 0.001 (two-way ANOVA, Bonferroni’s post hoc test). f Aif+/y KrasG12D and Aiffl/y KrasG12D pneumocyte growth in the absence of glucose. Cells were cultured for three days in the presence (5 g/L) or absence of glucose and their viability was determined. g Reduced ATP production in Aiffl/y KrasG12D cells upon glucose withdrawal. Pneumocytes were cultured for 36 h in the absence or presence of glucose and intracellular ATP levels were determined among the viable cell fractions. ATP content was normalized to the protein concentration of the samples. Data are shown as means±SEM. n = 5 per genotype. *P < 0.05; **P < 0.01; ***P < 0.001 (two-way ANOVA, Bonferroni’s post hoc test)
Fig. 4
Fig. 4
AIF knockdown results in suppression of OXPHOS, clonogenic potential and cell proliferation in human NSCLC A549 lung tumor cells. a Cellular extracts from A549 clones, generated by lentiviral transduction with shRNA scramble (SCR) or two different shRNA constructs targeting AIF (shAIF1 and shAIF2), were analyzed by immunoblot for the abundance of the indicated proteins. See Supplementary information, Fig. S6 for quantification. b Representative OCR of A549 SCR, shAIF1 and shAIF2 clones under basal conditions or following the addition of 1 μM oligomycin, 1.5 μM of the uncoupler FCCP or 0.5 μM of the electron transport inhibitor rotenone (n = 5). c Quantification of basal respiration, ATP consumption and maximal respiration levels for SCR, shAIF1, and shAIF2 A549 clones. Results were normalized versus a SCR clone cells/well number and expressed as means ± SEM (experiment was done in triplicate with similar results). d Representative cell growth assay of SCR, shAIF1 and shAIF2 A549 lung tumor clones (I, 500 cells/well; II, 1000 cells/well, and III, 2000 cells/well), analyzed by GFP fluorescence at 72 h post-seeding. e The indicated SCR, shAIF1 and shAIF2 A549 clones were plated (I, 500 cells/well; II, 1000 cells/well and III, 2000 cells/well) and colony numbers were quantified by GFP fluorescence at 0, 24, 48 and 72 h post-seeding. Values are means ± SEM of a representative experiment containing 24 repeats of each condition (experiment was done in triplicate with similar results). Unpaired two-sided t-test, *P < 0.05; **P < 0.01; ***P < 0.001 in case of immunoblot and oxygen consumption studies and two-way ANOVA and Bonferroni’s post hoc test in case of cell proliferation studies, compared to control SCR cells
Fig. 5
Fig. 5
Stable Aif depletion impairs colony formation of both KRAS WT and KRAS-mutated human lung cancer cells. KRAS WT cells (H1437 and H1975) and KRAS-mutated human lung cancer cell (H460, H727, A427, H1650, and H358) were transduced with lentiviral vectors expressing shAIF-GFP (or shSCR-GFP as a control), and GFP-positive clones were selected by cytofluorometric sorting. A549 cells were used as an internal control. a Representative images of different 96-well plates seeded with one GFP-positive cell per well generated from different cell lines. The images were acquired after 7–12 day-long cell culture. bd Quantification of average GFP+ clone area (b), total GFP+ clone area (c), average fluorescence intensity (d). The values obtained for the control shSCR were set as 100, and the values of shAIF were normalized to individual shSCR controls. Results are expressed as means ± SEM of a representative experiment (experiments were done in triplicates). *P < 0.05; **P < 0.01; ***P < 0.001 (Student’s t-test)
Fig. 6
Fig. 6
Re-expressing WT or mitochondria-anchored AIF restores lung cancer sensitivity. a Schematic representation of the WT AIF (WT-Aif) and mitochondria-anchored mutant AIFΔ96-110 (MT-Aif). TMS, transmembrane sequence. The cathepsin/calpain cleavage site is indicated. b Knock-in targeting strategy to insert WT-Aif and MT-Aif transgenes into the ROSA26 locus. Exons are shown as 1, 2, and 3. HSV-tk = herpes simplex promoter; PGK-neo-PA = neomycin cassette for selection; AIF-FLAG = AIF (WT or mutated) with a 3 × FLAG tag, EcoR V = restriction sites for Southern blotting. c Kaplan Meier survival plots for Aif+/y KrasG12D (n = 11), Aiffl/y KrasG12D (n = 10), Aiffl/y WT ki KrasG12D (n = 10), Aiffl/y MT ki KrasG12D (n = 9), Aif +/y WT ki KrasG12D (n = 9), and Aif+/y MT ki Kras G12D (n = 8) mice. **P< 0.01; NS, not significant (log rank test). d Representative lung sections (H&E staining) of Aif+/y KrasG12D, Aiffl/y KrasG12D, Aiffl/y WT ki KrasG12D and Aiffl/y MT ki KrasG12D mice, analyzed at 12 weeks after Ad5-CMV-Cre infection. Scale bar, 2 mm. e Quantification of overall tumor burden in the indicated cohorts analyzed 12 weeks after Ad5-CMV-Cre inhalation (n = 5 for each genotype). Three planes from each lung were scored automatically by an algorithm programmed and executed using the Definiens software suite program. Data are shown as means ± SEM. **P< 0.01; NS, not significant (two-way ANOVA analysis, Dunnett’s multiple comparisons test). f Representative images of tumor spheroids derived from purified Aif+/y KrasG12D and Aiffl/y KrasG12D primary lung tumor cells. Images were acquired 4 days after cells were seeded in Matrigel (5000 primary tumor cells per well). The experiment was designed with 6 replicates for each condition and repeated with 3 different mice for each group. Scale bar, 1 mm. g Quantitative analysis (means±SEM) of tumor spheroid numbers described in f. ***P< 0.001; NS, not significant (Unpaired, two-sided t-test). h Representative images for BrdU staining of tumor spheroids derived from Aif+/y KrasG12D and Aiffl/y KrasG12D primary lung tumor cells seen as in f. BrdU labeling (10 μM/mL) was performed for 2 h. Experiments were performed with 6 replicates for each condition and repeated with 3 different mice for each genotype. Sections were counter-stained with DAPI. i Quantifications (means ± SEM) of BrdU+ cells within tumor spheroids shown in h. *P< 0.05; NS, not significant (Unpaired, two-sided t-test)
Fig. 7
Fig. 7
Restoration of WT or mitochondria-anchored AIF eliminates mitochondrial respiration disadvantage. a, b Representative OCR (a) and comparison of basal respiration, ATP production and maximal respiration (b) in primary purified tumor cells derived from Aif+/y KrasG12D, Aiffl/y KrasG12D, Aiffl/y WT ki KrasG12D, and Aiffl/y MT ki KrasG12D mice 6 weeks after Ad5-mSPC-Cre inhalation. Data are shown as means±SEM. *P < 0.05; **P< 0.01; NS, not significant (Two-way ANOVA, Bonferroni’s post hoc test). The experiment was designed with 12 replicates for each condition and repeated with 3 different mice for each genotype. c Determination of metabolite content from purified tumor cells derived from Aif+/y KrasG12D, Aiffl/y KrasG12D, Aiffl/y WT ki KrasG12D, and Aiffl/y MT ki KrasG12D mice 8 weeks after Ad5-mSPC-Cre inhalation. Data are presented in a heatmap. Experiments were performed with 3 replicates for each condition and repeated with 5 different mice for each genotype. d KEGG pathway enrichment assay based on metabolite concentration obtained from Aif+/y KrasG12D, Aiffl/y KrasG12D, Aiffl/y WT ki KrasG12D, and Aiffl/y MT ki KrasG12D mice 3–4 weeks after Ad5-mSPC-Cre inhalation. Red box indicates the tricarboxylic acid (TCA) cycle, one of the top enriched pathways after AIF depletion
Fig. 8
Fig. 8
AIF is frequently overexpressed in human lung tumors, and high AIF expression is associated with poor survival. a Comparison of AIF mRNA expression level between normal lung tissue and lung tumor tissue derived from NSCLC patients in two independent studies, namely Okayama dataset (GEO: GSE31210) and Rousseaux dataset (GEO: GSE30219). P-value was obtained by Student’s t-test (linear model). b Representative AIF protein expression as determined by immunohistochemistry in lung tumors and tumor-adjacent normal lung tissue from KRAS-mutated and KRAS WT lung cancer patients. Scale bar, 20 μm. c Differential expression analysis of individual components from respiratory chain complex I, comparing tumor and normal lung tissues. Data were generated from the Okayama, Rousseaux and TCGA databases, respectively. Colors represent assigned log10 of P-values extracted from t-tests (red for overexpression, blue for underexpression in tumor compared to the adjacent normal tissue). Yellow lines in the color key (top left) represent the significance thresholds of ±log10 (0.05). Heatmap cells are annotated according to the statistical significance: ***P < 0.001, **P < 0.01, *P < 0.05, oP < 0.1. d Immunoblot analysis of AIF expression in primary pneumocytes purified from Aif+/y, Aif+/y KrasG12D, Aiffl/y, and Aiffl/y KrasG12D mice which were infected with or without Ad5-mSPC-Cre (MOI = 100) for 8 days. β-actin is shown as a loading control. e Overall survival curves according to KRAS mutational status and AIF expression status in lung TCGA datasets (RNAseq). The patients were divided into four groups: KRASMut; Aifhigh (n = 95); KRASMut; Aiflow(n = 78); KRASNoMut; Aifhigh (n = 182); and KRASNoMut; Aiflow (n = 282). To evaluate the overall effect of AIF, we pooled KRASMut and KRASNoMut patients together and P value indicated in the panel was obtained by applying a cox model. Patients were also stratified according to the KRAS mutation status and evaluated by constructing a stratified cox model; P = 0.00673 (KRASNoMut; Aifhigh vs KRASNoMut; Aiflow) and P = 0.0438 (KRASMut; Aifhigh vs KRASMut; Aiflow). f Overall survival curves stratified by AIF protein expression levels, as determined by immunohistochemistry. The patient cohort was divided into two groups: Aifhigh (n = 14) and Aiflow (n = 9). Due to the limited patient numbers, we pooled KrasMut and KrasNoMut patients. P = 0.045 (Log rank test)

Comment in

References

    1. Susin S, et al. Molecular characterization of mitochondrial apoptosis-inducing factor. Nature. 1999;397:441–446. - PubMed
    1. Vanessa PM, et al. Downregulation of apoptosis-inducing factor in Harlequin mutant mice sensitizes the myocardium to oxidative stress-related cell death and pressure overload-induced decompensation. Circ. Res. 2005;96:e92–e101. - PubMed
    1. Joza N, et al. Muscle-specific loss of apoptosis-inducing factor leads to mitochondrial dysfunction, skeletal muscle atrophy, and dilated cardiomyopathy. Mol. Cell. Biol. 2005;25:10261–10272. - PMC - PubMed
    1. Schulthess FT, et al. Deletion of the mitochondrial flavoprotein apoptosis inducing factor (AIF) induces b-cell apoptosis and impairs b-cell mass. PLoS One. 2009;4:e4394. - PMC - PubMed
    1. Vahsen N, et al. AIF deficiency compromises oxidative phosphorylation. EMBO J. 2004;23:4679–4689. - PMC - PubMed

Publication types