. 2019 May 27;9(1):7881.
doi: 10.1038/s41598-019-44344-7.

Gastric bypass surgery in lean adolescent mice prevents diet-induced obesity later in life

Affiliations

Gastric bypass surgery in lean adolescent mice prevents diet-induced obesity later in life

Michael B Mumphrey et al. Sci Rep. .

Abstract

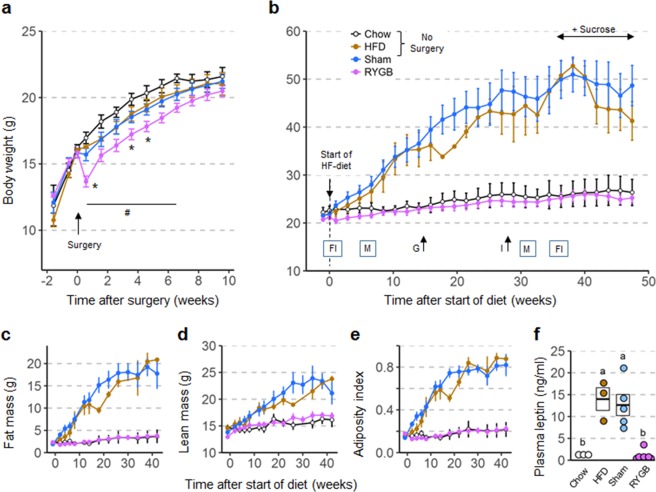
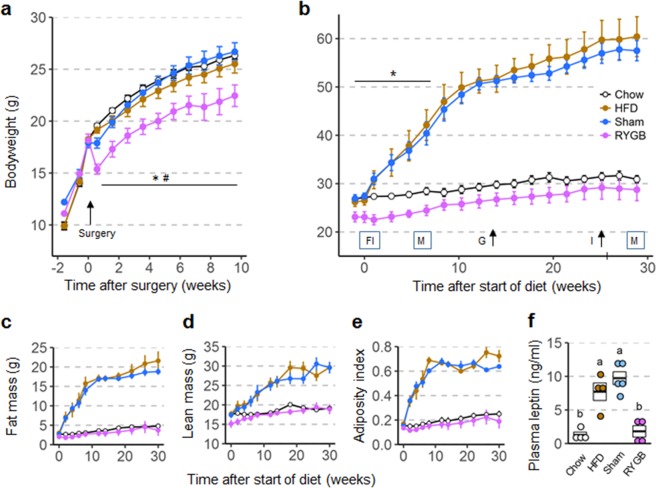
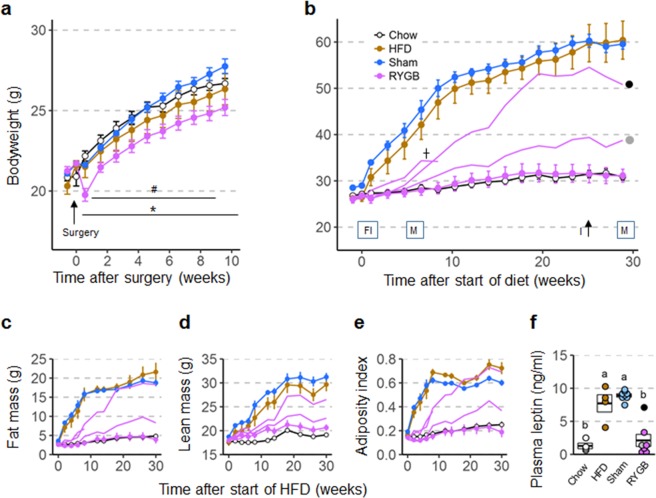
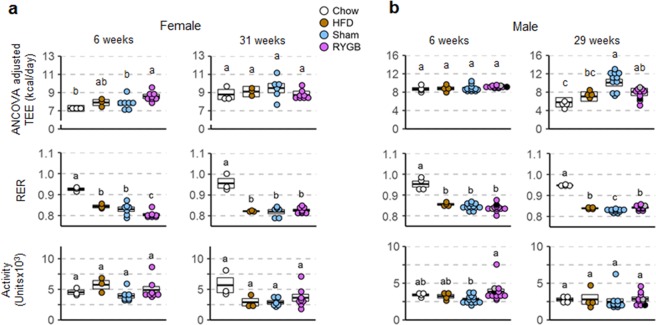
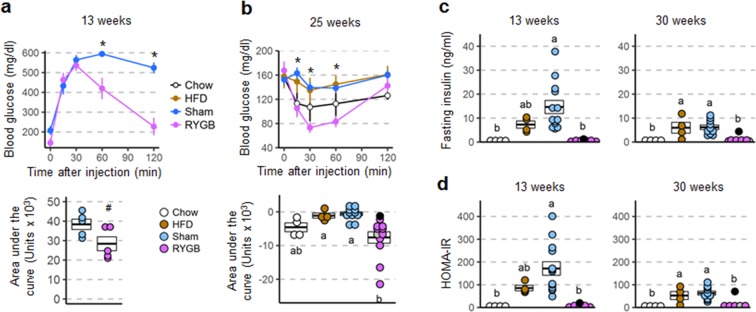
Gastric bypass surgery is the most effective treatment and is often the only option for subjects with severe obesity. However, investigation of critical molecular mechanisms involved has been hindered by confounding of specific effects of surgery and side effects associated with acute surgical trauma. Here, we dissociate the two components by carrying out surgery in the lean state and testing its effectiveness to prevent diet-induced obesity later in life. Body weight and composition of female mice with RYGB performed at 6 weeks of age were not significantly different from sham-operated and age-matched non-surgical mice at the time of high-fat diet exposure 12 weeks after surgery. These female mice were completely protected from high-fat diet-induced obesity and accompanying metabolic impairments for up to 50 weeks. Similar effects were seen in male mice subjected to RYGB at 5-6 weeks, although growth was slightly inhibited and protection from diet-induced obesity was less complete. The findings confirm that RYGB does not indiscriminately lower body weight but specifically prevents excessive diet-induced obesity and ensuing metabolic impairments. This prevention of obesity model should be crucial for identifying the molecular mechanisms underlying gastric bypass surgery.


Conflict of interest statement

The authors declare no competing interests.

Figures

Figure 1
Figure 1
Body weight (a,b), body composition (ce), and plasma leptin levels (f) of female mice subjected to RYGB at 5 weeks and exposed to high-fat diet at ~17 weeks of age. (a) Body weight curves of mice subjected to RYGB (purple, n = 8), Sham surgery (blue, n = 7), or no surgery (brown and open circles, n = 6) at 5 weeks of age. Note normal growth of mice with RYGB with no significant difference in body weight compared to all other groups at 7 weeks after surgery. *p < 0.05, RYGB vs. Sham; #p < 0.05, RYGB vs. no surgery. (b) Body weight of mice with prior RYGB (purple, n = 8), Sham surgery (blue, n = 7), no surgery subjected to high-fat diet (brown, n = 3), or no surgery subjected to chow diet (open circles, n = 3) for 48 weeks. Note complete resistance to high-fat diet-induced obesity in mice with RYGB. Times of measurements of food intake (FI), energy expenditure and activity in metabolic chambers (M), glucose tolerance (G), and insulin tolerance (I) are indicated above the x-axis. (ce) Fat mass, lean mass, and adiposity index measured before and after exposure to high-fat diet. (f) Plasma leptin levels measured at 13 weeks after exposure to high-fat diet. Data are shown as mean ± SEM, or individual data points overlaid on a box showing mean ± SEM. Groups that do not share the same letters are significantly different from each other (p < 0.05, pairwise t-tests with Benjamini-Hochberg correction, FDR = 0.05).
Figure 2
Figure 2
Body weight (a,b), body composition (ce), and plasma leptin levels (f) of male mice subjected to RYGB at 5 weeks and exposed to high-fat diet at ~17 weeks of age. (a) Body weight curves of mice subjected to RYGB (purple, n = 5), Sham surgery (blue, n = 5), or no surgery (brown and open circles, n = 8) at 5 weeks of age. Note reduced growth of mice with RYGB with significant difference in body weight at 10 weeks after surgery compared to all other groups. *p < 0.05, RYGB vs. Sham; #p < 0.05, RYGB vs. no surgery. (b). Body weight of mice with prior RYGB (purple, n = 5), Sham surgery (blue, n = 5), no surgery subjected to high-fat diet (brown, n = 4), or no surgery subjected to chow diet (open circles, n = 4) for 29 weeks. Note complete resistance to high-fat diet-induced obesity in mice with RYGB. Times of measurements of food intake (FI), energy expenditure and activity in metabolic chambers (M), glucose tolerance (G), and insulin tolerance (I) are indicated above the x-axis. (*p < 0.05, RYGB vs Chow) (ce). Fat mass, lean mass, and adiposity index measured before and after exposure to high-fat diet. (f) Plasma leptin levels measured at 13 weeks after exposure to high-fat diet. Data are shown as mean ± SEM, or individual data points overlaid on a box showing mean ± SEM. Groups that do not share the same letters are significantly different from each other (p < 0.05, pairwise t-tests with Benjamini-Hochberg correction, FDR = 0.05).
Figure 3
Figure 3
Body weight (a,b), body composition (ce), and plasma leptin levels (f) of male mice subjected to RYGB at 6–7 weeks and exposed to high-fat diet at ~18 weeks of age. (a) Body weight curves of mice subjected to RYGB (purple, n = 8), Sham surgery (blue, n = 8), or no surgery (brown and open circles, n = 8) at 6 weeks of age. *p < 0.05, RYGB vs. Sham; #p < 0.05, RYGB vs. no surgery. (b) Body weight of mice with prior RYGB (DIO resistant, n = 5; not DIO resistant, n = 3), Sham surgery (blue, n = 8), no surgery subjected to high-fat diet (brown, n = 4), or no surgery subjected to chow diet (open circles, n = 4) for 29 weeks. Note complete resistance to high-fat diet-induced obesity in 5 mice with RYGB, but various degrees of obesity in 3 outliers (shown by the 3 separate purple lines and the gray and black dot). Times of measurements of food intake (FI), energy expenditure and activity in metabolic chambers (M), glucose tolerance (G), and insulin tolerance (I) are indicated above the x-axis. (ce) Fat mass, lean mass, and adiposity index measured before and after exposure to high-fat diet. (f) Plasma leptin levels measured at 13 weeks after exposure to high-fat diet. Data are shown as mean ± SEM, or individual data points overlaid on a box showing mean ± SEM. Groups that do not share the same letters are significantly different from each other (p < 0.05, pairwise t-tests with Benjamini-Hochberg correction, FDR = 0.05).
Figure 4
Figure 4
Food intake and food choice of female (ac) and male (df) mice subjected to RYGB early and exposed to high-fat diet later in life. (a,d) Daily food intake before and after exposure to two-choice diet of mice with prior RYGB (purple, Female, n = 8; Male, n = 7–13), sham surgery (blue, Female, n = 5–7; Male, n = 6–13), no surgery subjected to two-choice diet (brown, Female, n = 3; Male, n = 4), or no surgery subjected to chow diet (open circles, Female, n = 3; Male, n = 4). For the female group, food intake at days 300–315 is during exposure to a three choice diet (high fat, sucrose, and chow). Note that food intake data for male mice with RYGB surgery performed at both 5 and 6 weeks were pooled after determining that there were no significant differences between them. *p < 0.05, RYGB vs. chow. (b,e) Average daily food intake at baseline, immediately after exposure to high-fat diet (Days 1–2), after food intake has stabilized (Days 10–25), and just before termination (Female, days 300–315; Male, days 187–195). The two male mice with RYGB not resisting weight gain are indicated by the gray and black dots. Groups that do not share the same letters are significantly different from each other (p < 0.05, pairwise t-tests with Benjamini-Hochberg correction, FDR = 0.05), # p < 0.06 vs Chow. (c) Average diet preference in female mice at 10–25 and 300–315 days after first exposure to high-fat diet. (f) Average diet preference in male mice at 10–25 days after first exposure to high-fat diet. Data are shown as mean ± SEM, or individual data points overlaid on a box showing mean ± SEM.
Figure 5
Figure 5
Daily averages of energy expenditure, RER, and activity of female (a) and male (b) mice assessed at two time points after RYGB surgery at thermoneutrality (29° C). Metabolic parameters of mice with prior RYGB (purple, Female, n = 8; Male, n = 11–13), sham surgery (blue, female, n = 6–7; male, n = 11–13), no surgery subjected to two-choice diet (brown, female, n = 3; male, n = 4), or no surgery subjected to chow diet (open circles, female, n = 3; male, n = 4), after adaptation, were assessed for 4 days in metabolic chambers, 2 days at 23 °C (see Supplementary Fig. S3) and 2 days at 29 °C. Note that all data for male mice with RYGB surgery performed at both 5 and 6 weeks were pooled, after determining that there were no significant differences between them. The two male mice with RYGB not resisting weight gain are indicated by the gray and black dots. Data are individual data points overlaid on a box showing mean ± SEM. Groups that do not share the same letters are significantly different from each other (p < 0.05, pairwise t-tests with Benjamini-Hochberg correction, FDR = 0.05).
Figure 6
Figure 6
Glycemic control parameters of female mice with RYGB assessed at different time points after exposure to high-fat diet. Glucose tolerance (a), insulin tolerance (b), as well as fasting insulin (c), and HOMA-insulin resistance (d) of mice with prior RYGB (purple, n = 8), Sham surgery (blue, n = 4–7), no surgery subjected to high-fat diet (brown, n = 3), or no surgery subjected to chow diet (open circles, n = 3). *p < 0.05 RYGB vs Sham and HFD. Data are shown as mean ± SEM, or individual data points overlaid on a box showing mean ± SEM. Groups that do not share the same letters are significantly different from each other (p < 0.05, pairwise t-tests with Benjamini-Hochberg correction, FDR = 0.05).
Figure 7
Figure 7
Glycemic control parameters of male mice with RYGB assessed at different time points after exposure to high-fat diet. Glucose tolerance (a), insulin tolerance (b), as well as fasting insulin (c), and HOMA-insulin resistance (d) of mice with prior RYGB (purple, n = 5–12), sham surgery (blue, n = 10–13), no surgery subjected to two-choice diet (brown, n = 4), or no surgery subjected to chow diet (open circles, n = 4). Note that all data for male mice with RYGB surgery performed at both 5 and 6 weeks were pooled, after determining that there were no significant differences between them. *p < 0.05 RYGB vs Sham. #p < 0.06 RYGB vs Sham. The two male mice with RYGB not resisting weight gain are indicated by the gray and black dots. Data are shown as mean ± SEM, or individual data points overlaid on a box showing mean ± SEM. Groups that do not share the same letters are significantly different from each other (p < 0.05, pairwise t-tests with Benjamini-Hochberg correction, FDR = 0.05).
Figure 8
Figure 8
Liver fat and liver weight of female and male mice with RYGB exposed to high-fat diet. A: Representative images of liver fat content (visualized using oil-red-O on a background of hematoxylin staining) of female (a) and male (b) mice without surgery subjected to regular chow diet (Chow), mice without surgery subjected to high-fat diet (HFD), sham-surgery (Sham), or RYGB. High-fat diet exposure lasted for 30 weeks in females and 50 weeks in males. (c) Images for the two mice that regained all (black dot) or substantial (gray dot) body weight after RYGB. (d,e) Absolute (d) and relative (e) liver weight of mice with RYGB (purple, female, n = 8; male, n = 11), Sham surgery (blue, female, n = 7; male, n = 11), no surgery subjected to high-fat diet (brown, female, n = 3; male, n = 4), or no surgery subjected to chow diet (open circles, female, n = 3; male, n = 4). The two male mice with RYGB not resisting weight gain are indicated by the gray and black dots. Scale bar in A is 250 µm. Data are shown as individual data points overlaid on a box showing mean ± SEM. Groups that do not share the same letters are significantly different from each other (p < 0.05, pairwise t-tests with Benjamini-Hochberg correction, FDR = 0.05).

References

    1. Ogden CL, Carroll MD, Kit BK, Flegal KM. Prevalence of childhood and adult obesity in the United States, 2011–2012. JAMA. 2014;311:806–814. doi: 10.1001/jama.2014.732. - DOI - PMC - PubMed
    1. Skinner AC, Skelton JA. Prevalence and trends in obesity and severe obesity among children in the United States, 1999–2012. JAMA Pediatr. 2014;168:561–566. doi: 10.1001/jamapediatrics.2014.21. - DOI - PubMed
    1. Viner R, White B, Christie D. Type 2 diabetes in adolescents: a severe phenotype posing major clinical challenges and public health burden. Lancet. 2017;389:2252–2260. doi: 10.1016/S0140-6736(17)31371-5. - DOI - PubMed
    1. Alqahtani A, et al. Features of nonalcoholic steatohepatitis in severely obese children and adolescents undergoing sleeve gastrectomy. Surg Obes Relat Dis. 2017;13:1599–1609. doi: 10.1016/j.soard.2017.04.005. - DOI - PubMed
    1. The NS, et al. Association of adolescent obesity with risk of severe obesity in adulthood. JAMA. 2010;304:2042–2047. doi: 10.1001/jama.2010.1635. - DOI - PMC - PubMed

Publication types