. 2019 Jun;51(6):947-951.
doi: 10.1038/s41588-019-0418-7. Epub 2019 May 27.

Loss of DUX causes minor defects in zygotic genome activation and is compatible with mouse development

Affiliations

Loss of DUX causes minor defects in zygotic genome activation and is compatible with mouse development

Zhiyuan Chen et al. Nat Genet. 2019 Jun.

Abstract

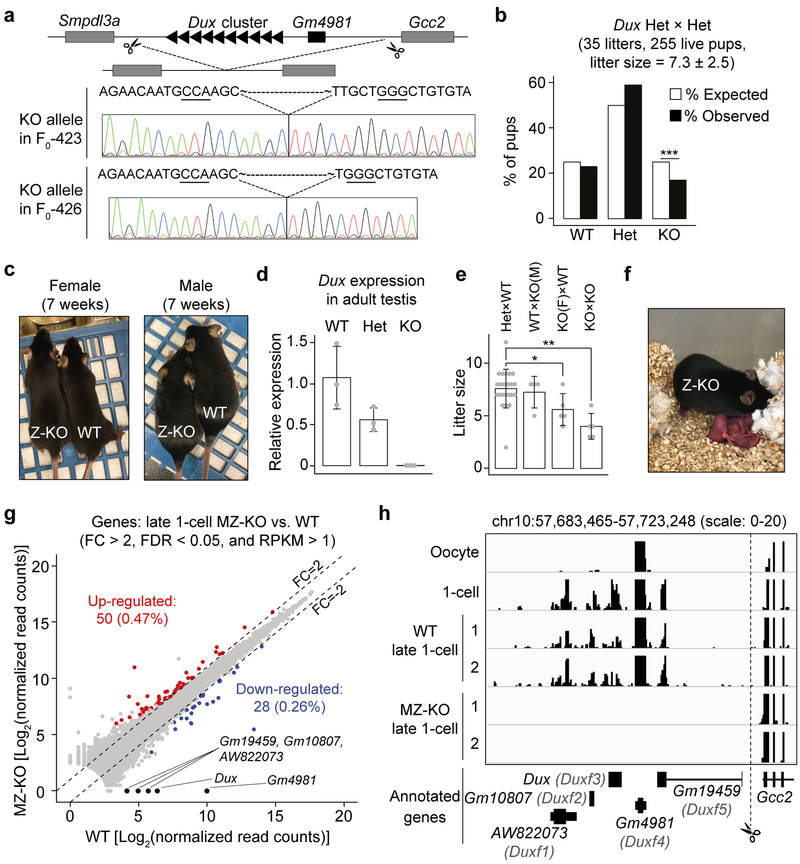
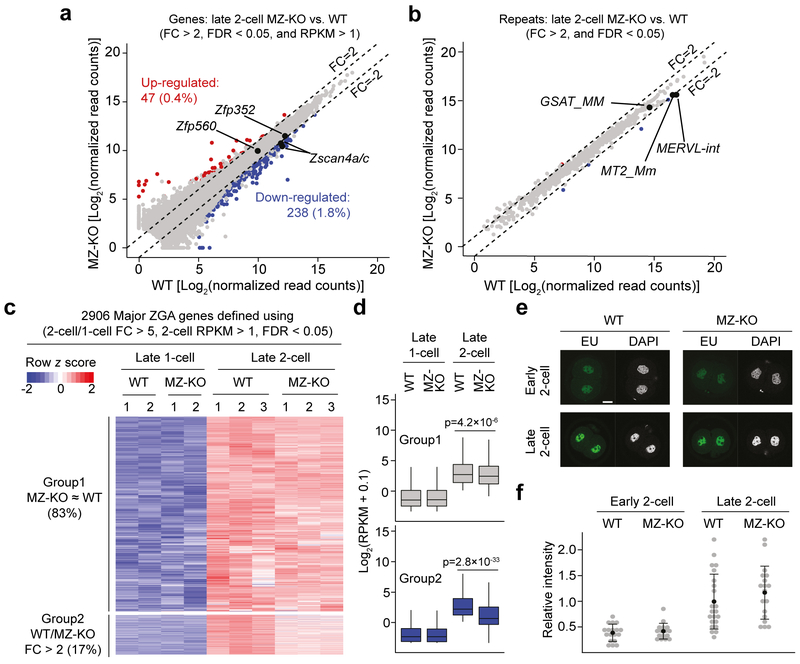
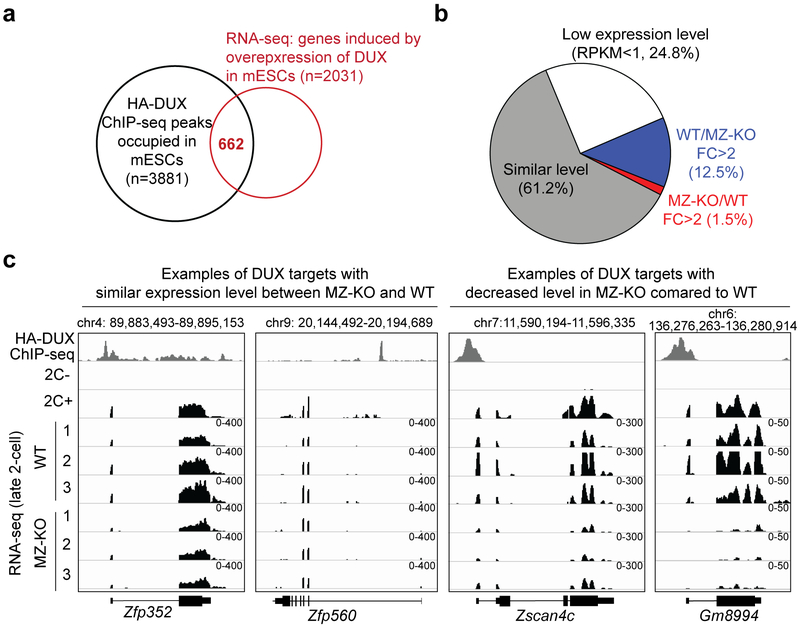
How maternal factors in oocytes trigger zygotic genome activation (ZGA) is a long-standing question in developmental biology. Recent studies in 2-cell-like embryonic stem cells (2C-like cells) suggest that transcription factors of the DUX family are key regulators of ZGA in placental mammals1,2. To characterize the role of DUX in ZGA, we generated Dux cluster knockout (KO) mouse lines. Unexpectedly, we found that both Dux zygotic KO (Z-KO) and maternal and zygotic KO (MZ-KO) embryos can survive to adulthood despite showing reduced developmental potential. Furthermore, transcriptome profiling of the MZ-KO embryos revealed that loss of DUX has minimal effects on ZGA and most DUX targets in 2C-like cells are normally activated in MZ-KO embryos. Thus, contrary to the key function of DUX in inducing 2C-like cells, our data indicate that DUX has only a minor role in ZGA and that loss of DUX is compatible with mouse development.


Figures

Figure 1.
Figure 1.. Loss of DUX is compatible with mouse development
a) Schematics of the Dux cluster in mice (not drawn in scale) and Sanger sequencing results of the KO alleles in the two founder lines. Underlined three nucleotides represent the CRISPR PAM sequences. b) Bar graph showing the percentage of pups for each genotype from Dux Het × Het crosses. *** P value = 0.005, Chi-squared goodness of fit test. c) Examples of Dux F2 WT and Z-KO adult mice analyzed in panel B. d) RT-qPCR results confirming Dux KO in adult testis. The expression level of Dux in WT adult mouse (9–12 weeks) testis was set as 1.0. Three mice were analyzed for each genotype (denoted as grey dots). Measure of center and error bar indicate mean and standard deviation (SD), respectively. e) Litter sizes of the indicated crosses. Each grey dot represents a single litter analyzed. Number of litters analyzed are 22, 4, 5, 5 for Het × Het, WT × KO(M), KO(F) × WT, and KO × KO mating, respectively. ** P = 0.0003; * P = 0.03, two-tailed Student’s t test. Measure of center and error bar indicate mean and SD, respectively. f) An example of a Z-KO × Z-KO litter with live pups analyzed in panel E. g) Scatter plot comparing the gene expression levels between Dux MZ-KO and WT at late 1-cell stage [~12 hours post in vitro fertilization (hpi)]. Two RNA-seq replicates were generated for differential gene expression analyses. h) Genome browser view of RNA-seq signal at the Dux cluster in WT and MZ-KO late 1-cell embryos. RNA-seq tracks of oocyte and 1-cell embryos were obtained from . Only uniquely aligned reads were used to generate the RNA-seq tracks.
Figure 2.
Figure 2.. Loss of DUX causes minor defects in ZGA
a, b) Scatter plots comparing the genes (A) and repeats (B) expression levels of late 2-cell embryos (~30 hpi) of Dux MZ-KO and WT. Three RNA-seq replicates were generated for differential gene expression analyses. c) Heatmap illustrating the expression levels of major ZGA genes at late 1-cell and late 2-cell stages of Dux WT and MZ-KO embryos. Group 1 represents genes that showed similar expression (FC < 2) between WT and MZ-KO 2-cell embryos, while Group 2 represents genes that showed decreased expression (FC > 2 and FDR < 1) in MZ-KO 2-cell embryos. d) Boxplots illustrating the expression levels of Group 1 (n = 2,413) and 2 (n = 493) genes in panel C. Mann-Whitney-Wilcoxon test (two-sided) was used to calculate the P values between WT and MZ-KO. The middle lines in the boxes represent medians. Box hinges indicate the 25th/75th percentiles and the whiskers indicate the hinge ± 1.5 × inter-quartile range. e) The EU-staining assay showing the global transcriptional activity in early (~22 hpi) and late (~30 hpi) 2-cell embryos. Scale bar = 20 μm, hpi = hours post in vitro fertilization. f) Quantification of the EU signal intensity shown in panel E. The average signal intensity of late 2-cell was set as 1.0. Each grey dot represents a single embryo analyzed. Measure of center and error bar indicate mean and SD, respectively. Two-tailed Student’s t test was used to compare the signal intensity between WT and MZ-KO (1-cell: P = 0.58; 2-cell: P = 0.29). The total number of embryos analyzed were 18, 23, 16, and 18 for WT (~22 and ~30 hpi) and MZ-KO (~22 and ~30 hpi), respectively.
Figure 3.
Figure 3.. The majority of DUX targets identified in 2C-like cells are activated normally in Dux MZ-KO 2-cell embryos.
a) Identification of known DUX targets by overlapping the HA-DUX ChIP-seq peak-associated genes and DUX-overexpression-induced genes in mESCs. Both HA-DUX ChIP-seq and 2C-like cells RNA-seq datasets were obtained from . b) Expression level changes of known DUX targets in MZ-KO 2-cell embryos. Known DUX targets were defined as genes that are associated with HA-DUX ChIP-seq peaks and are upregulated (FC > 2 and FDR < 0.05) in 2C-like cells. The average of three RNA-seq replicates of WT and MZ-KO late 2-cell embryos were used for the analyses. c) Genome browser views illustrating the RNA levels of known DUX targets in 2C-like cells and 2-cell embryos. HA-DUX ChIP-seq track and RNA-seq tracks of non-2C (2C-) and 2C-like (2C+) cells were obtained from . Only uniquely aligned reads were used to generate the ChIP-seq and RNA-seq tracks.

References

    1. Hendrickson PG et al. Conserved roles of mouse DUX and human DUX4 in activating cleavage-stage genes and MERVL/HERVL retrotransposons. Nat Genet 49, 925–934 (2017). - PMC - PubMed
    1. De Iaco A et al. DUX-family transcription factors regulate zygotic genome activation in placental mammals. Nat Genet 49, 941–945 (2017). - PMC - PubMed
    1. Hamatani T, Carter MG, Sharov AA & Ko MS Dynamics of global gene expression changes during mouse preimplantation development. Dev Cell 6, 117–31 (2004). - PubMed
    1. Wang QT et al. A genome-wide study of gene activity reveals developmental signaling pathways in the preimplantation mouse embryo. Dev Cell 6, 133–44 (2004). - PubMed
    1. Zeng F, Baldwin DA & Schultz RM Transcript profiling during preimplantation mouse development. Dev Biol 272, 483–96 (2004). - PubMed

Publication types

Substances