. 2019 Jul;15(7):681-689.
doi: 10.1038/s41589-019-0291-9. Epub 2019 May 27.

Mitochondrial metabolism promotes adaptation to proteotoxic stress

Affiliations

Mitochondrial metabolism promotes adaptation to proteotoxic stress

Peter Tsvetkov et al. Nat Chem Biol. 2019 Jul.

Erratum in

Abstract

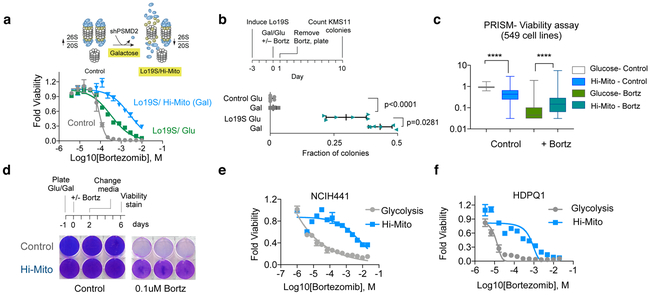
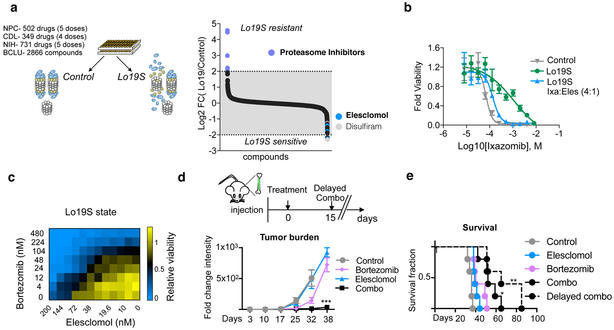
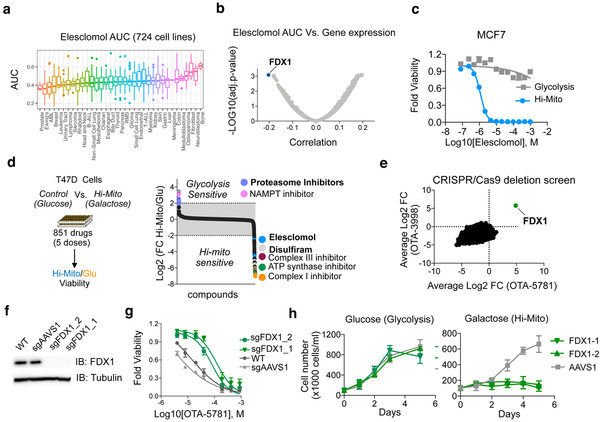
The mechanisms by which cells adapt to proteotoxic stress are largely unknown, but are key to understanding how tumor cells, particularly in vivo, are largely resistant to proteasome inhibitors. Analysis of cancer cell lines, mouse xenografts and patient-derived tumor samples all showed an association between mitochondrial metabolism and proteasome inhibitor sensitivity. When cells were forced to use oxidative phosphorylation rather than glycolysis, they became proteasome-inhibitor resistant. This mitochondrial state, however, creates a unique vulnerability: sensitivity to the small molecule compound elesclomol. Genome-wide CRISPR-Cas9 screening showed that a single gene, encoding the mitochondrial reductase FDX1, could rescue elesclomol-induced cell death. Enzymatic function and nuclear-magnetic-resonance-based analyses further showed that FDX1 is the direct target of elesclomol, which promotes a unique form of copper-dependent cell death. These studies explain a fundamental mechanism by which cells adapt to proteotoxic stress and suggest strategies to mitigate proteasome inhibitor resistance.


Figures

Figure 1.
Figure 1.. Mitochondrial energy metabolism is associated with the PI-resistant Lo19S state.
a, The Lo19S state was induced by induction of a doxycycline inducible PSMD2 shRNA in T47D breast cancer cells with 0.2 μg/ml doxycycline for 72 hours. Cells were then collected, washed and plated with fresh media without doxycycline. After 24 hours the indicated concentrations of bortezomib were added and the relative viability was measured after 72 hours (mean −/+ SD, n= 4 biologically independent samples). The calculated EC50s and EC90s are also presented. b, Basal oxygen consumption rate (OCR) was measured in control and induced Lo19S state cells (as in a) with and without the additions of 200nM bortezomib (Bortz) for 6 hours (discovery determined using the Two-stage linear step-up procedure of Benjamini, Krieger and Yekutieli, with Q = 1%. Each row was analyzed individually, without assuming a consistent SD, n= 7,8 biologically independent samples). c, MM.1S orthotopic tumors grown out from control and bortezomib-treated mice were analyzed for gene expression with RNA-seq and the gene set enrichment categories (Hallmarks) the mountain plot for Hallmark OXPHOS is plotted. d, Gene set enrichment analysis (GSEA) of genes upregulated in Lo19S but not control tumors was conducted for breast, prostate, thyroid, skin and kidney cancers from the TCGA. The top and bottom 29 categories are plotted. Mitochondrial-associated categories are marked in blue, the rest in orange. The network enrichment of Gene Ontology (GO) terms in the Lo19S state in breast cancer tumors is visualized and color-coded by function (right). Only GO categories showing enrichment with Log2 score >0.5 were used to create the network and visualized was conducted using ClueGO in Cytoscape.
Figure 2.
Figure 2.. Increased mitochondrial energy metabolism (Hi-Mito) is sufficient to promote proteotoxic stress tolerance.
a, Control and induced Lo19S T47D cells were plated in media containing either glucose (Glu) or galactose (to induce Hi-Mito state). The viability was measured 72 hours after addition of the indicated concentrations of bortezomib (mean −/+ SD, n= 4 biologically independent samples). Calculated EC90 for control, Lo19S/Glu and Lo19S/Gal is 12.7 nM, 109 nM and 624 nM respectively b, Control and Lo19S state was induced by transient induction of a doxycycline-inducible PSMD2 shRNA in the multiple myeloma KMS11 cell line. Control non-targeting shRNA was used in the control cell lines. Colony formation was assessed after cells were grown in media with either glucose or galactose (Hi-Mito) in the presence or absence of 5nM bortezomib for 24 hours. The relative fraction (compared to untreated glucose grown cells) of colonies formed following 5nM bortezomib treatment is plotted. Statistical analysis was conducted by two-tailed unpaired t-test. Plotted mean −/+ SD, n= 6 biologically independent samples c, The relative viability score of 549 cell lines following growth in glucose (control) or galactose (Hi-Mito) containing media, in the presence or absence of 40nM bortezomib. Data plotted as box (25–75 percentile) and whiskers (min to max), statistical analysis was conducted by two-tailed paired t-test. **** p<0.0001, n= 549 biologically independent samples . d, NCIH2030 cells were grown in media containing glucose (control) or galactose (Hi-Mito) and treated with or without 100nm bortezomib for 2 days. Cell media was changed to control glucose-containing media and presented is the visualization of the cell number after 4 days. Three biologically independent samples presented that are representative of two independent experiments. e-f, NCIH441 (e) and HDPQ1 (f) cells were grown in glucose (Glycolysis) or galactose (Hi-Mito) containing media and cell viability was determined after 72 hours of treatment with indicated concentrations of bortezomib. Non-linear curve fit was performed (mean −/+ SD, n= 4 biologically independent samples).
Figure 3.
Figure 3.. The PI-resistant Lo19S state exhibits increased sensitivity to elesclomol.
a, Viability based small molecule screen was conducted using three distinct libraries (Selleck anti-cancer L3000 drug library (CDL n=349 in 4 doses), the natural product library (NPC n=502 in 5 doses) and the NIH bioactive compound library (n=731 in 5 doses) to determine the compounds that have differential effect on viability between the control versus the induced Lo19S cells. The relative viability of the Lo19S versus control cells was calculated for replica experiments and the log2 of the ratio is plotted. b, The effect on relative cell growth of elesclomol added with the proteasome inhibitor ixazomib at a 1:4 (elesclomol:ixazomib) ratio (the ratio of the EC50s) to Lo19S cells compared to the effect of ixazomib alone added to either Lo19S or control cells. Plotted are the mean −/+ SD n= 4 biologically independent samples. Calculated EC50 for control-Ixazomib, Lo19S-Ixazomib and Lo19S-Ixazomib:elesclomol combo is 69 nM, 1145 nM and 138 nM respectively. c, Heatmap of relative cell growth following addition of different combinations of bortezomib and elesclomol to the Lo19S state cells. d-e, Mice were injected with MM.1S luciferase-expressing cells. Upon tumor formation as judged by bioluminescent signal intensity, treatment with elesclomol (28mg/kg), bortezomib (0.25mg/kg) or the combination (Combo) was initiated (day 0). At day 15, elesclomol was added to the treatment of one of the groups that had received only bortezomib from day 0 to day 15 (combo-delayed group). Tumor burden (d) over time as determined by changes from the baseline radiant flux associated with the BLI signal intensity. Plotted are the mean −/+ SD (multiple unpaired t-test analysis with Holm-Sidak correction on bortezomib alone versus combo group at week 32 and 38 adjusted p-values; p= 0.001 (n=5), p=0.0003 (n=3 bortz n=4 combo) respectively and viability plots (e) are presented as Kaplan Meier survival curve (statistical test: Log-rank of significant difference between the combo treatments over bortezomib alone * p= 0.0244 ** p= 0.0044). n = 5 per group.
Figure 4
Figure 4. FDX1 is the primary mediator of elesclomol induced toxicity.
a, The viability of 724 barcoded cell lines was determined for 8 concentrations of elesclomol and the calculated area under the curve (AUC) is presented as box plot for different lineages (Supplementary Data 9). b, Correlation analysis of calculated AUC for elesclomol with the gene expression (obtained from the Cancer Dependency Map at www.depmap.org) in 701 cell lines common to both datasets is plotted with the most significant correlation indicated (FDX1 gene) see Supplementary Data 9. c, MCF7 cells were grown in the presence of either glucose (control, gray) or galactose (Hi-Mito, blue) as the carbon source and the relative cell viability was analyzed 72 hours after addition of the indicated concentrations of elesclomol. Mean −/+ SD n= 4 biologically independent samples is plotted d, T47D cells were grown in the presence of either glucose (Glycolysis) or galactose (Hi-Mito) as the carbon source in the presence of compounds from the Selleck anti-cancer L3000 drug library (CDL) (n= 349 in 4 doses) and the natural product library (NPC) (n=502 in 5 doses). The relative viability of the Hi-Mito versus the glycolytic control cells was calculated for replica experiments and the log2 of the ratio is plotted. Specific compounds are annotated. e, The gene scores of two whole genome CRISPR/Cas9-deletion screens conducted with OTA-5781 (100 nM) and OTA-3998 (1uM) treated K562 cells. The gene score is the mean log2 fold change in abundance of all sgRNAs targeting that gene during the culture period. FDX1 is indicated. f, Western blot analysis of FDX1 and tubulin (loading control) protein expression levels in WT K562 cells (WT) or cells with FDX1 (two distinct sgRNAs) and AAVS1 deletions. Representative of two independent experiments. Full length gels are shown in Supplementary Fig. 7. g, Viability curves of parental K562 cells and cells targeted for either AAVS1 (control) or FDX1 achieved with two sgRNAs using CRISPR/Cas9 were treated with increasing concentrations OTA-5781 and viability was examined after 72 hours. h, The indicated cells were grown in the presence of either glucose or galactose (Hi-Mito) and the relative cell number plotted. For g,h mean −/+ SD n= 4 biologically independent samples.
Figure 5.
Figure 5.. Elesclomol inhibits the natural function of FDX1 in the Fe-S cluster biosynthesis, serving as a neo-substrate when bound to copper.
a, Chemical shift perturbation results mapped onto a diagram of the structure of FDX1. Color code: grey, not significantly affected (ΔδNH < 0.01 ppm); blue, significant chemical shift changes (ΔδNH > 0.01 ppm); red, severe line broadening; grey, no assignments. The [2Fe-2S] cluster in FDX1 is indicated by spheres. b, Schematic describing mitochondrial Fe-S cluster biosynthesis. The mitochondrial ISC (iron-sulfur cluster) core complex catalyzes the conversion of cysteine to alanine and generates S0 for iron sulfur cluster assembly. S0 is reduced by FDX1. A [2Fe-2S] cluster is subsequently formed on the scaffold protein ISCU. c, In vitro Fe-S cluster assembly was monitored by following the increase of absorbance at 456 nm. Reduced FDX1 was used as a reducing agent in the presence or absence of either 5X (green) or 10X (blue) elesclomol. Data is representative of two independent experiments d, Electron transfer from reduced FDX1 to the cysteine desulfurase complex was measured upon the addition of cysteine in the presence or absence of elesclomol. Data is representative of two independent experiments e, The molecular structure of elesclomol analogs and their corresponding calculated EC50s (from T47D cells grown in Hi-Mito state). The reactive sulfur substitution with an oxygene is indicated with an asterisk. f, The UV/vis spectra of reduced FDX1 before and after incubation with elesclomol-Cu(II) or Cu(II) alone.
Figure 6.
Figure 6.. Elesclomol mediated copper dependent cell death is not inhibited by known apoptosis and ferroptosis inhibitors.
a-b, The viability of T47D cells cultured in the presence of galactose (Hi-Mito state) was examined following the addition of either elesclomol (a) or OTA-5781 (b) in the presence or absence of the copper chelator tetrathiomolybdate (TTM) at 10uM concentration. The mean −/+ SD n= 3 biologically independent samples is plotted. c, NCIH2030 cells were grown in glucose (glycolysis) or galactose (Hi-Mito) containing media and treated with either elesclomol or elesclomol-Cu(II) (at a 1:1 molar ratio). The viability was examined after 48 hours and the mean −/+ SD n= 3 biologically independent samples is plotted. d, The viability of cells after 48 hours of treatment with indicated concentrations of elesclomol in the presence or absence of either TTM (copper chelator at 10uM), Z-VAD (pan-caspase inhibitor at 30uM), ferrostatin-1 or alpha-tocopherol (ferroptosis inhibitors at 10uM and 100uM concentrations respectively). The mean −/+ SD n= 3 biologically independent samples is plotted e, A schematic of the mechanism of FDX1-activated, elesclomol-induced and copper-dependent cell death induction.

References

    1. Luo J et al. A genome-wide RNAi screen identifies multiple synthetic lethal interactions with the Ras oncogene. Cell 137, 835–848, doi: 10.1016/j.cell.2009.05.006 (2009). - DOI - PMC - PubMed
    1. Petrocca F et al. A genome-wide siRNA screen identifies proteasome addiction as a vulnerability of basal-like triple-negative breast cancer cells. Cancer cell 24, 182–196, doi: 10.1016/j.ccr.2013.07.008 (2013). - DOI - PMC - PubMed
    1. Adams J et al. Proteasome inhibitors: a novel class of potent and effective antitumor agents. Cancer Res 59, 2615–2622 (1999). - PubMed
    1. Deshaies RJ Proteotoxic crisis, the ubiquitin-proteasome system, and cancer therapy. BMC biology 12, 94, doi: 10.1186/s12915-014-0094-0 (2014). - DOI - PMC - PubMed
    1. Holbeck SL, Collins JM & Doroshow JH Analysis of Food and Drug Administration-approved anticancer agents in the NCI60 panel of human tumor cell lines. Mol Cancer Ther 9, 1451–1460, doi: 10.1158/1535-7163.MCT-10-0106 (2010). - DOI - PMC - PubMed

Publication types

Substances