

Bioprospecting the Solar Panel Microbiome: High-Throughput Screening for Antioxidant Bacteria in a Caenorhabditis elegans Model
- PMID: 31134025
- PMCID: PMC6514134
- DOI: 10.3389/fmicb.2019.00986
Bioprospecting the Solar Panel Microbiome: High-Throughput Screening for Antioxidant Bacteria in a Caenorhabditis elegans Model
Abstract
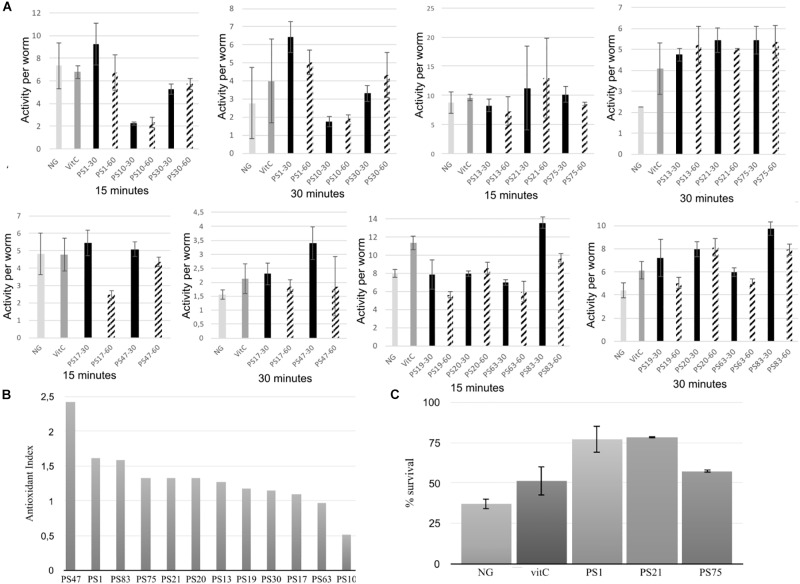
Microbial communities that are exposed to sunlight typically share a series of adaptations to deal with the radiation they are exposed to, including efficient DNA repair systems, pigment production and protection against oxidative stress, which makes these environments good candidates for the search of novel antioxidant microorganisms. In this research project, we isolated potential antioxidant pigmented bacteria from a dry and highly-irradiated extreme environment: solar panels. High-throughput in vivo assays using Caenorhabditis elegans as an experimental model demonstrated the high antioxidant and ultraviolet-protection properties of these bacterial isolates that proved to be rich in carotenoids. Our results suggest that solar panels harbor a microbial community that includes strains with potential applications as antioxidants.
Keywords: Caenorhabditis elegans; antioxidant; bioprospecting; microbiome; sun-exposed environment.
Figures


Similar articles
-
Evaluation of Carotenoids Protection Against Oxidative Stress in the Animal Model Caenorhabditis elegans.Methods Mol Biol. 2020;2083:387-401. doi: 10.1007/978-1-4939-9952-1_29. Methods Mol Biol. 2020. PMID: 31745937
-
Bioprospecting and characterization of pigmented halophilic archaeal strains from Algerian hypersaline environments with analysis of carotenoids produced by Halorubrum sp. BS2.J Basic Microbiol. 2020 Jul;60(7):624-638. doi: 10.1002/jobm.202000083. Epub 2020 Apr 27. J Basic Microbiol. 2020. PMID: 32338407
-
A highly diverse, desert-like microbial biocenosis on solar panels in a Mediterranean city.Sci Rep. 2016 Jul 5;6:29235. doi: 10.1038/srep29235. Sci Rep. 2016. PMID: 27378552 Free PMC article.
-
Caenorhabditis elegans, a Host to Investigate the Probiotic Properties of Beneficial Microorganisms.Front Nutr. 2020 Aug 21;7:135. doi: 10.3389/fnut.2020.00135. eCollection 2020. Front Nutr. 2020. PMID: 33425969 Free PMC article. Review.
-
Bacteria and bacterial products: Foe and friends to Caenorhabditis elegans.Microbiol Res. 2018 Oct;215:102-113. doi: 10.1016/j.micres.2018.06.012. Epub 2018 Jun 25. Microbiol Res. 2018. PMID: 30172296 Review.
Cited by
-
Kineococcus vitellinus sp. nov., Kineococcus indalonis sp. nov. and Kineococcus siccus sp. nov., Isolated Nearby the Tabernas Desert (Almería, Spain).Microorganisms. 2020 Oct 7;8(10):1547. doi: 10.3390/microorganisms8101547. Microorganisms. 2020. PMID: 33036385 Free PMC article.
-
Niche partitioning of microbial communities at an ancient vitrified hillfort: implications for vitrified radioactive waste disposal.Int Biodeterior Biodegradation. 2020 Aug 31;38(1):10.1080/01490451.2020.1807658. doi: 10.1080/01490451.2020.1807658. Int Biodeterior Biodegradation. 2020. PMID: 40070387 Free PMC article.
-
Microbial communities of the Mediterranean rocky shore: ecology and biotechnological potential of the sea-land transition.Microb Biotechnol. 2019 Nov;12(6):1359-1370. doi: 10.1111/1751-7915.13475. Epub 2019 Sep 28. Microb Biotechnol. 2019. PMID: 31562755 Free PMC article.
-
First characterization of cultivable extremophile Chroococcidiopsis isolates from a solar panel.Front Microbiol. 2023 Feb 17;14:982422. doi: 10.3389/fmicb.2023.982422. eCollection 2023. Front Microbiol. 2023. PMID: 36876112 Free PMC article.
-
The Effect of the Combination of Two Postbiotics on Anxiety-like Behavior in Animal Models.Cells. 2024 Dec 5;13(23):2006. doi: 10.3390/cells13232006. Cells. 2024. PMID: 39682754 Free PMC article.
References
-
- Britton G., Liaaen-Jensen S., Pfander H. (1998). Carotenoids: Biosynthesis and Metabolism, Vol. 3 Basel: Birkhäuser.
LinkOut - more resources
Full Text Sources
Molecular Biology Databases