. 2019 Apr 30:10:784.
doi: 10.3389/fimmu.2019.00784. eCollection 2019.

FKN Facilitates HK-2 Cell EMT and Tubulointerstitial Lesions via the Wnt/β-Catenin Pathway in a Murine Model of Lupus Nephritis

Affiliations

FKN Facilitates HK-2 Cell EMT and Tubulointerstitial Lesions via the Wnt/β-Catenin Pathway in a Murine Model of Lupus Nephritis

Dongdong Fu et al. Front Immunol. .

Abstract

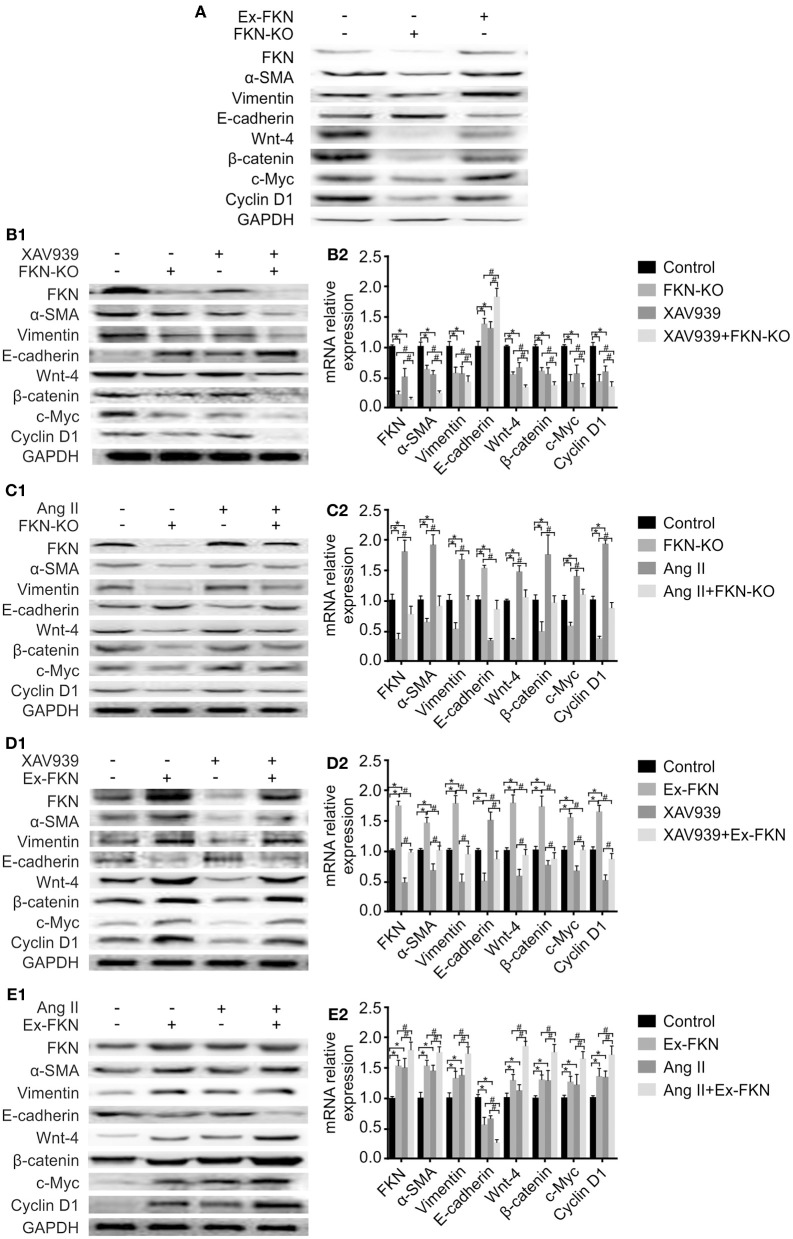
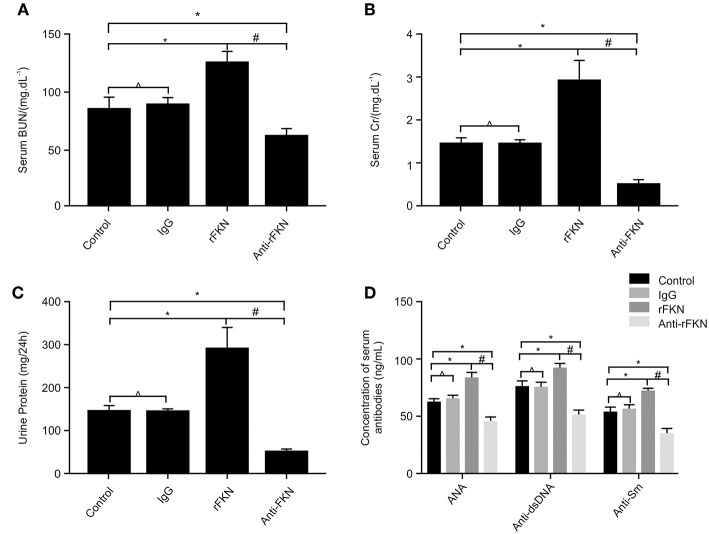
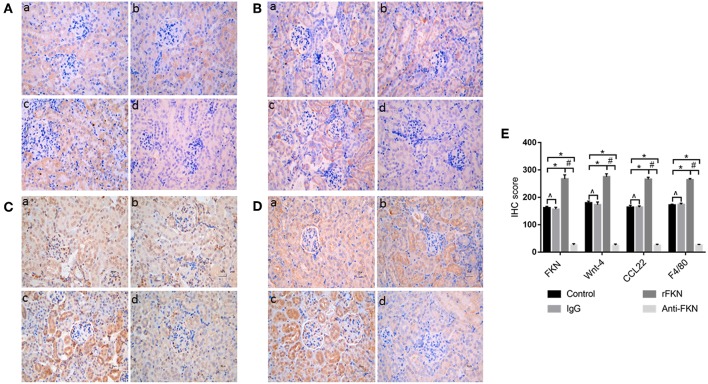
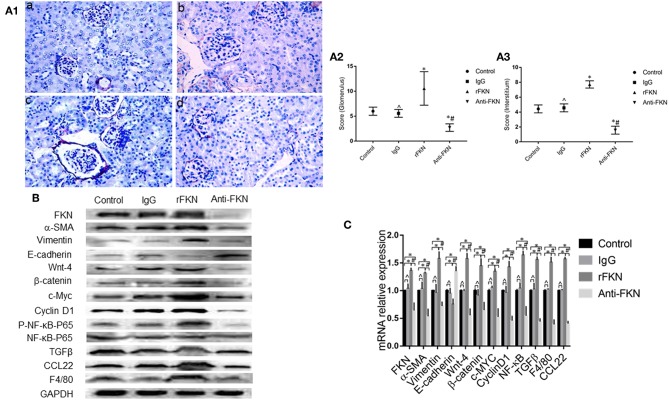
Fractalkine (FKN), also known as chemokine (C-X3-C motif) ligand 1, constitutes an intriguing chemokine with a documented role in the development of numerous inflammatory diseases including autoimmune disease. Specifically, it has been reported that FKN is involved in the disease progression of lupus nephritis (LN). The epithelial-mesenchymal transition (EMT) plays a significant role in the formation of tubulointerstitial lesions (TIL), which are increasingly recognized as a hallmark of tissue fibrogenesis after injury. However, the correlation between FKN and EMT or TIL in LN has not been determined. To investigate the potential role of FKN in EMT and TIL, MRL lymphoproliferation (MRL/lpr) strain mice were treated with an anti-FKN antibody, recombinant-FKN chemokine domain, or isotype antibody. Our results revealed that treatment with the anti-FKN antibody improved EMT, TIL, and renal function in MRL/lpr mice, along with inhibiting activation of the Wnt/β-catenin signaling pathway. In contrast, administration of the recombinant-FKN chemokine domain had the opposite effect. Furthermore, to further explore the roles of FKN in EMT, we assessed the levels of EMT markers in FKN-depleted or overexpressing human proximal tubule epithelial HK-2 cells. Our results provide the first evidence that the E-cadherin level was upregulated, whereas α-SMA and vimentin expression was downregulated in FKN-depleted HK-2 cells. In contrast, overexpression of FKN in HK-2 cells enhanced EMT. In addition, inhibition of the Wnt/β-catenin pathway by XAV939 negated the effect of FKN overexpression, whereas activation of the Wnt/β-catenin pathway by Ang II impaired the effect of the FKN knockout on EMT in HK-2 cells. Together, our data indicate that FKN plays essential roles in the EMT progression and development of TIL in MRL/lpr mice, most likely through activation of the Wnt/β-catenin signaling pathway.

Keywords: HK-2 cells; Wnt/β-catenin; epithelial-mesenchymal transition; fractalkine; murine model; tubulointerstitial lesion.


Figures

Figure 1
Figure 1
AngII promotes the viability of HK-2 cells. AngII induces dose-dependent increase of cell viability in HK-2 cells. Cells were incubated with indicated concentrations (0, 10−9, 10−8, 10−7mol/L) of AngII for 12, 24, and 48 h. Cell growth promoting activity by AngII was assessed using the CCK-8 assay. Data are expressed as the mean ± standard deviation (n = 3). Statistical analyses were performed using one-way ANOVA.
Figure 2
Figure 2
Annexin V-FITC and PI staining to evaluate apoptosis in HK-2 cells following different treatment. The HK-2 cells were divided into nine groups and incubated for 48 h with annexin V-FITC and PI and analyzed using flow cytometry. (A) Q4: In each panel the lower left quadrant shows cells that are negative for both PI and annexin V-FITC. Q3: Upper right quadrant shows annexin positive cells (early apoptotic). Q2: Upper left quadrant shows only PI positive cells, which are necrotic. Q1: Lower right quadrant shows annexin and PI positive cells (late apoptotic cells). (a) control group; (b) Ang II group; (c) XAV939 group; (d) FKN-KD group; (e) Ang II + FKN-KD group; (f) XAV939 + FKN-KD group; (g) Ex-FKN group; (h) Ang II + Ex-FKN group; (i) XAV939 + Ex-FKN group.(B) The rate of early apoptotic cells (Q3) is represented in a histogram. p value represents *p < 0.05 compared with the control group;# p < 0.05 compared with Ang II group; ## p < 0.05 compared with XAV939 group; ### p < 0.05 compared with FKN-KD group; ** p < 0.05 compared with Ex-FKN group. Data are expressed as the means ± standard deviation (n = 3). Statistical analyses were performed using multi-way classification ANOVA.
Figure 3
Figure 3
FKN participates in the EMT process of HK-2 cells via the Wnt/β-catenin signaling pathway. To detect the protein and mRNA levels of FKN, EMT markers (vimentin, α-SMA, E-cadherin) and Wnt/β-catenin pathway targets (Wnt-4, β-catenin, cyclinD1, and c-Myc) in different groups of HK-2 cells, cells were incubated for 48 h. Renal tissues extract (~50 μg) was resolved on SDS-PAGE and western blot analysis was performed using antibodies against FKN, vimentin, α-SMA, E-cadherin, Wnt-4, β-catenin, cyclinD1, and c-Myc. GAPDH was used as an internal control. Total RNA was extracted from renal tissue of mice. Then, the RNA was reverse-transcribed into cDNA and the transcripts were quantified using real-time PCR. GAPDH was used as an internal control. Data are expressed as the means ± standard deviation (n = 3). Statistical analyses were performed using one-way ANOVA. (A) Western blotting was used to detect the protein levels of FKN, vimentin, α-SMA, E-cadherin, Wnt-4, β-catenin, cyclinD1, and c-Myc in the FKN-KD group and Ex-FKN group. FKN-depleted HK-2 cells treated with 10 μmol/L XAV939 were assessed using western blotting (B1) and qRT-PCR (B2). *p < 0.05 compared with the control group. #p < 0.05 compared with XAV939-treated FKN KD. FKN-depleted HK-2 cells treated with 10−7mol/L Ang II were measured using western blotting (C1) and qRT-PCR (C2). *p < 0.05 compared with the control group. #p < 0.05 compared with Ang II-treated FKN KD. FKN-overexpressing HK-2 cells treated with 10 μmol/L XAV939 were assessed using western blotting (D1) and qRT-PCR (D2). *p < 0.05 compared with the control group. #p < 0.05 compared with XAV939-treated FKN overexpression. FKN-overexpressing HK-2 cells treated with 10−7mol/L Ang II were assessed using western blotting (E1) and qRT-PCR (E2).*p < 0.05 compared with the control group. #p < 0.05 compared with Ang II-treated FKN overexpression.
Figure 4
Figure 4
The effects of FKN on the levels of blood urea nitrogen, serum creatinine, 24 h urinary protein, ANA, anti-ds-DNA, and anti-ds-Sm determined at the end of 13 weeks. (A) Level of serum creatinine. (B) Level of blood urea nitrogen. (C) Level of 24 h urinary protein. (D) Level of ANA, anti-ds-DNA, and anti-ds-Sm. Control, MRL/lpr mice; IgG, MRL/lpr mice treated with isotype antibody; rFKN, MRL/lpr mice treated with recombinant-FKN antibody; anti-FKN, MRL/lpr mice treated with anti-FKN antibody. *p < 0.05 compared with the control group. No significant differences between IgG compared to the control group are indicated as *p > 0.05. Significant differences among the rFKN group and anti-FKN groups are indicated as #p < 0.05. Data are expressed as the means ± standard deviation (n = 3). Statistical analyses were performed using one-way ANOVA.
Figure 5
Figure 5
Twelve-week-old MRL/lpr mice were IP injected with isotype antibody, recombinant-FKN protein, and anti-FKN antibody for 7 days. In kidney sections of MRL/lpr mice stained by IHC (original magnification, ×400). (a) Control group; (b) IgG group; (c) rFKN group; (d) anti-FKN group. (A) Expression of FKN as examined by IHC staining in the renal tissues. (B) Expression of Wnt-4 as examined by IHC staining in the renal tissues. (C) Expression of CCL22 as examined by IHC staining in the renal tissues. (D) Expression of F4/80 as examined by IHC staining in the renal tissues. (E) The column diagram indicates the statistical of (A-D). *p < 0.05 compared with the control group. No significant differences between IgG compared to the control group are indicated as *p > 0.05. Significant differences among the rFKN group and anti-FKN groups are indicated as #p < 0.05. Data are expressed as the means ± standard deviation (n = 3). Statistical analyses were performed using one-way ANOVA.
Figure 6
Figure 6
FKN is involved EMT and fibrosis via the Wnt/β-catenin pathway in the kidney of MRL/lpr mice. Histopathological features of renal tissue in the MRL/lpr mice model were studied by PASM staining (original magnification, ×400). (a) Control group;(b) IgG group; (c) rFKN group; (d) anti-FKN group. (A1) Assessment of glomerular and renal interstitial pathologies stained with PASM. Glomerular pathology was graded from the sum of scores for glomerular inflammation, thickness of basement membrane, epithelial cell reactivity, crescent formation, and necrosis. Interstitial pathology was graded using the sum of scores for perivascular inflammation and inflammatory cell infiltration. Scores were graded as 0 to 4 (0, none; 1 mild; 2 moderate; 3 moderate-high; 4 high). (A2) the sum of score by PASM staining in the renal glomerular inflammation. (A3) the sum of score by PASM staining in the renal glomerular inflammation. Renal tissue extract (~50 μg) was resolved on SDS-PAGE and western blot analysis was performed using antibodies against FKN, vimentin, α-SMA, E-cadherin, Wnt-4, β-catenin, cyclinD1, and c-Myc. GAPDH was used as an internal control. Total RNA were extracted from renal tissue of mice. Then the RNA was reverse-transcribed into cDNA and the transcripts were quantified using real-time PCR. GAPDH was used as an internal control. NF-kB-P65 was used as an internal control group of P- NF-kB-P65. Western blotting (B) and qRT-PCR (C) was used to detect the protein and mRNA levels of FKN, vimentin, α-SMA, E-cadherin, Wnt-4, β-catenin, cyclinD1, c-Myc, P- NF-kB -P65, CCL22 and F4/80 in renal tissues. *p < 0.05 compared with the control group. No significant differences between IgG compared to the control group are indicated as *p > 0.05. Significant differences among the rFKN group and anti-FKN groups are indicated as #p < 0.05. Data are expressed as the means ± standard deviation (n = 3). Statistical analyses were performed using one-way ANOVA.

Similar articles

Cited by

References

    1. Saxena R, Mahajan T, Mohan C. Lupus nephritis: current update. Arthritis Res Ther. (2011) 13:240. 10.1186/ar3378 - DOI - PMC - PubMed
    1. Koga T, Ichinose K, Tsokos GC. T cells and IL-17 in lupus nephritis. Clin Immunol. (2017) 185:95–9. 10.1016/j.clim.2016.04.010 - DOI - PMC - PubMed
    1. Zickert A, Oke V, Parodis I, Svenungsson E, Sundström Y, Gunnarsson I. Interferon (IFN)-λ is a potential mediator in lupus nephritis. Lupus Sci Med. (2016) 3:e000170. 10.1136/lupus-2016-000170 - DOI - PMC - PubMed
    1. Zhong H, Liu Y, Xu Z, Liang P, Yang H, Zhang X, et al. . TGF-β-induced CD8+CD103+ regulatory T cells show potent therapeutic effect on chronic graft-versus-host disease lupus by suppressing B cells. Front Immunol. (2018) 9:35. 10.3389/fimmu.2018.00035 - DOI - PMC - PubMed
    1. Bates MA, Akbari P, Gilley KN, Wagner JG, Li N, Kopec AK, et al. . Dietary docosahexaenoic acid prevents silica-induced development of pulmonary ectopic germinal centers and glomerulonephritis in the lupus-prone NZBWF1 mouse. Front Immunol. (2018) 9:2002. 10.3389/fimmu.2018.02002 - DOI - PMC - PubMed

Publication types

MeSH terms