

Molecular Pathways Mediating Immunosuppression in Response to Prolonged Intensive Physical Training, Low-Energy Availability, and Intensive Weight Loss
- PMID: 31134054
- PMCID: PMC6511813
- DOI: 10.3389/fimmu.2019.00907
Molecular Pathways Mediating Immunosuppression in Response to Prolonged Intensive Physical Training, Low-Energy Availability, and Intensive Weight Loss
Abstract
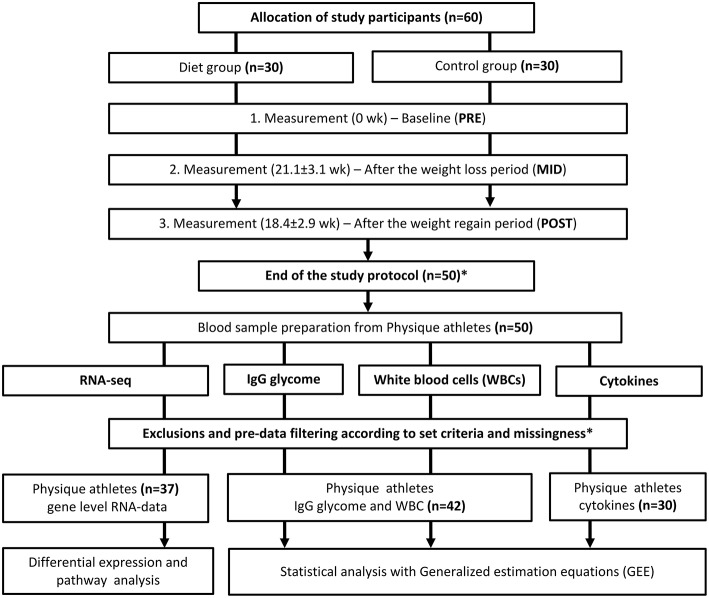
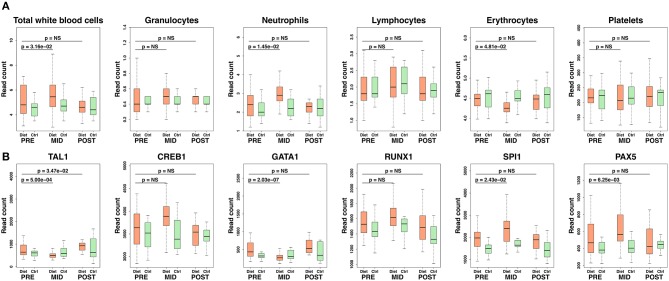
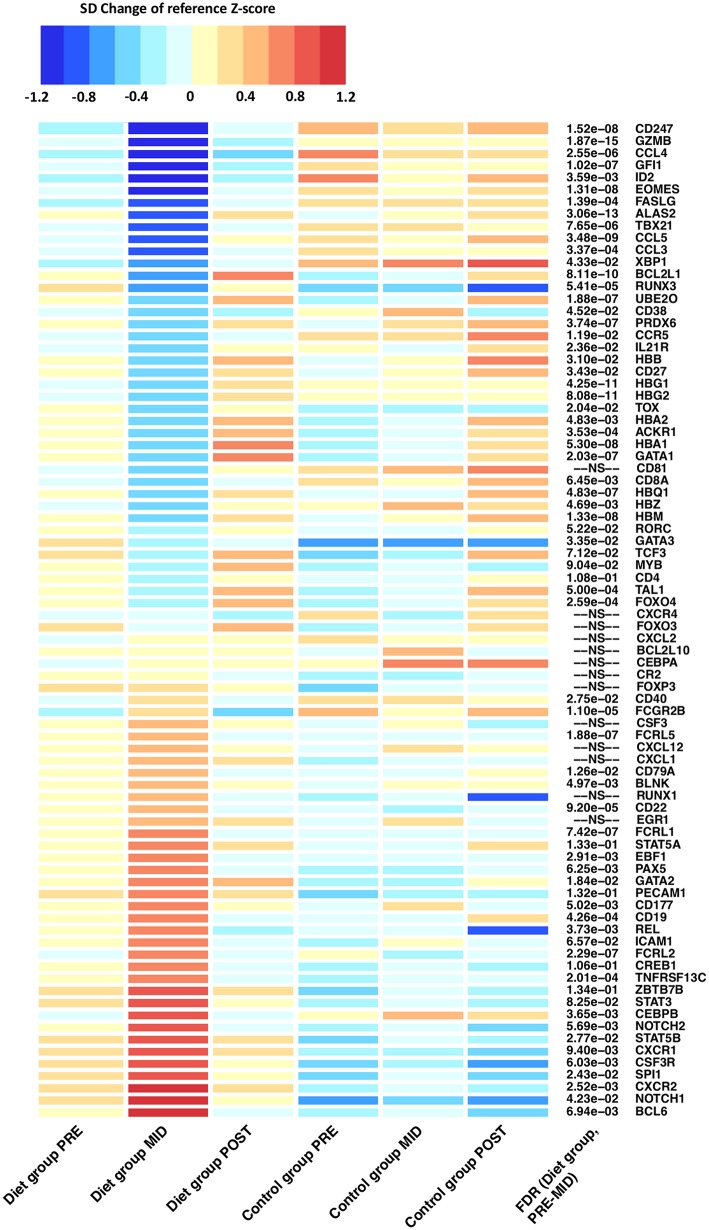
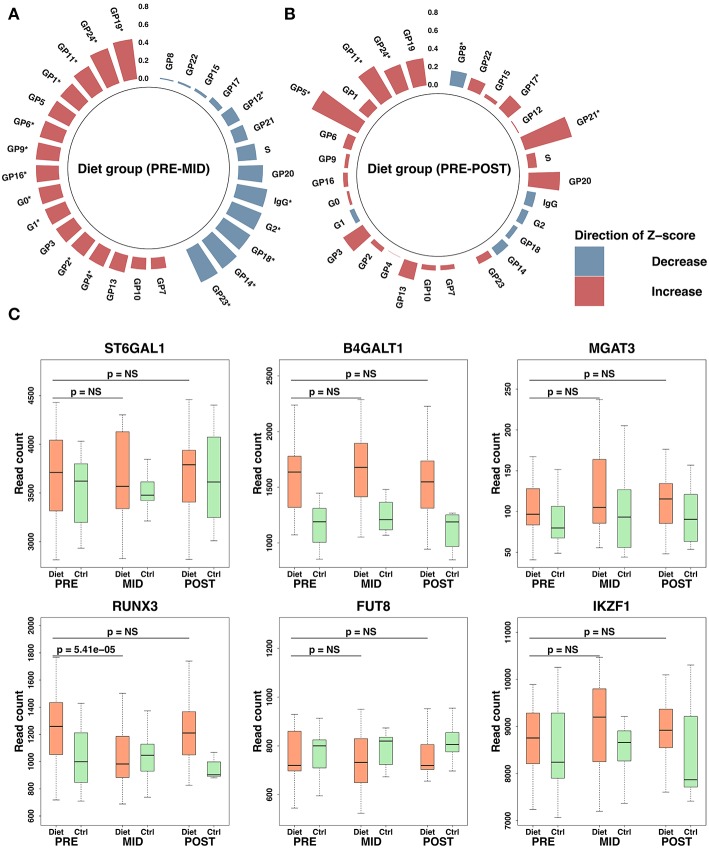
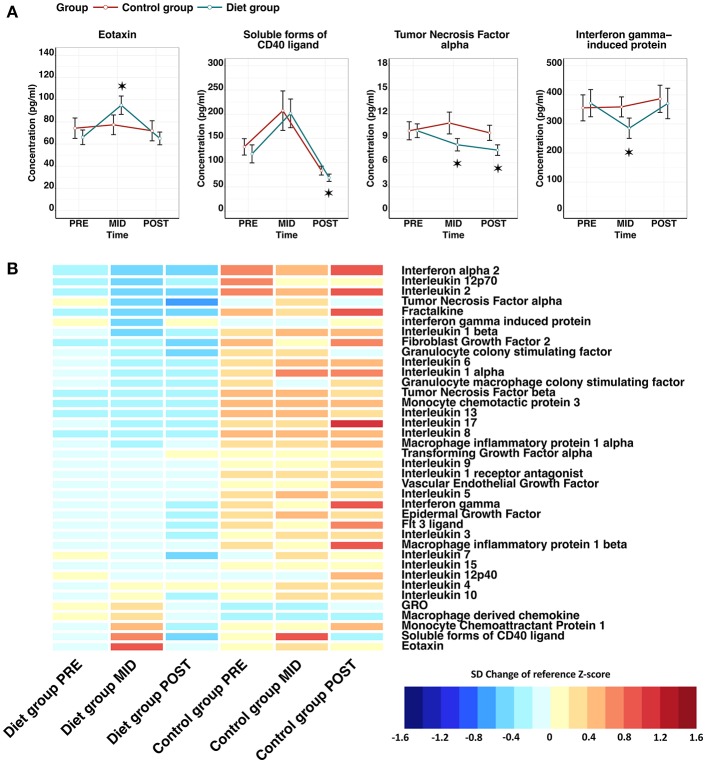
Exercise and exercise-induced weight loss have a beneficial effect on overall health, including positive effects on molecular pathways associated with immune function, especially in overweight individuals. The main aim of our study was to assess how energy deprivation (i.e., "semi-starvation") leading to substantial fat mass loss affects the immune system and immunosuppression in previously normal weight individuals. Thus, to address this hypothesis, we applied a high-throughput systems biology approach to better characterize potential key pathways associated with immune system modulation during intensive weight loss and subsequent weight regain. We examined 42 healthy female physique athletes (age 27.5 ± 4.0 years, body mass index 23.4 ± 1.7 kg/m2) volunteered into either a diet group (n = 25) or a control group (n = 17). For the diet group, the energy intake was reduced and exercise levels were increased to induce loss of fat mass that was subsequently regained during a recovery period. The control group was instructed to maintain their typical lifestyle, exercise levels, and energy intake at a constant level. For quantification of systems biology markers, fasting blood samples were drawn at three time points: baseline (PRE), at the end of the weight loss period (MID 21.1 ± 3.1 weeks after PRE), and at the end of the weight regain period (POST 18.4 ± 2.9 weeks after MID). In contrast to the control group, the diet group showed significant (false discovery rate <0.05) alteration of all measured immune function parameters-white blood cells (WBCs), immunoglobulin G glycome, leukocyte transcriptome, and cytokine profile. Integrative omics suggested effects on multiple levels of immune system as dysregulated hematopoiesis, suppressed immune cell proliferation, attenuated systemic inflammation, and loss of immune cell function by reduced antibody and chemokine secretion was implied after intense weight loss. During the weight regain period, the majority of the measured immune system parameters returned back to the baseline. In summary, this study elucidated a number of molecular pathways presumably explaining immunosuppression in individuals going through prolonged periods of intense training with low-energy availability. Our findings also reinforce the perception that the way in which weight loss is achieved (i.e., dietary restriction, exercise, or both) has a distinct effect on how the immune system is modulated.
Keywords: bioinformatics; immunosuppression; low energy availability; physical training; weight loss.
Figures
Similar articles
-
Mitochondrial bioenergetic pathways in blood leukocyte transcriptome decrease after intensive weight loss but are rescued following weight regain in female physique athletes.FASEB J. 2021 Apr;35(4):e21484. doi: 10.1096/fj.202002029R. FASEB J. 2021. PMID: 33710692
-
Substantial fat mass loss reduces low-grade inflammation and induces positive alteration in cardiometabolic factors in normal-weight individuals.Sci Rep. 2019 Mar 5;9(1):3450. doi: 10.1038/s41598-019-40107-6. Sci Rep. 2019. PMID: 30837600 Free PMC article.
-
A low-fat intake and greater activity level are associated with lower weight regain 3 years after completing a very-low-calorie diet.J Am Diet Assoc. 2002 Sep;102(9):1252-6. doi: 10.1016/s0002-8223(02)90277-4. J Am Diet Assoc. 2002. PMID: 12792622
-
American College of Sports Medicine position stand. Appropriate intervention strategies for weight loss and prevention of weight regain for adults.Med Sci Sports Exerc. 2001 Dec;33(12):2145-56. doi: 10.1097/00005768-200112000-00026. Med Sci Sports Exerc. 2001. PMID: 11740312 Review.
-
Physiological adaptations to weight loss and factors favouring weight regain.Int J Obes (Lond). 2015 Aug;39(8):1188-96. doi: 10.1038/ijo.2015.59. Epub 2015 Apr 21. Int J Obes (Lond). 2015. PMID: 25896063 Free PMC article. Review.
Cited by
-
A Life History Perspective on Athletes with Low Energy Availability.Sports Med. 2022 Jun;52(6):1223-1234. doi: 10.1007/s40279-022-01643-w. Epub 2022 Feb 3. Sports Med. 2022. PMID: 35113390 Review.
-
Inducing low energy availability in trained endurance male athletes results in poorer explosive power.Eur J Appl Physiol. 2022 Feb;122(2):503-513. doi: 10.1007/s00421-021-04857-4. Epub 2021 Nov 26. Eur J Appl Physiol. 2022. PMID: 34825937 Free PMC article.
-
Moderate Caloric Restriction Partially Improved Oxidative Stress Markers in Obese Humans.Antioxidants (Basel). 2021 Jun 24;10(7):1018. doi: 10.3390/antiox10071018. Antioxidants (Basel). 2021. PMID: 34202775 Free PMC article.
-
Short-Term Severe Low Energy Availability in Athletes: Molecular Mechanisms, Endocrine Responses, and Performance Outcomes-A Narrative Review.Scand J Med Sci Sports. 2025 Jun;35(6):e70089. doi: 10.1111/sms.70089. Scand J Med Sci Sports. 2025. PMID: 40539747 Free PMC article. Review.
-
Nutrition, Immune Function, and Infectious Disease in Military Personnel: A Narrative Review.Nutrients. 2023 Dec 2;15(23):4999. doi: 10.3390/nu15234999. Nutrients. 2023. PMID: 38068857 Free PMC article. Review.