. 2019 Jun 6;11(22):10791-10807.
doi: 10.1039/c9nr00807a.

Catalytic oxidation and reduction reactions of hydrophilic carbon clusters with NADH and cytochrome C: features of an electron transport nanozyme

Affiliations

Catalytic oxidation and reduction reactions of hydrophilic carbon clusters with NADH and cytochrome C: features of an electron transport nanozyme

Paul J Derry et al. Nanoscale. .

Abstract

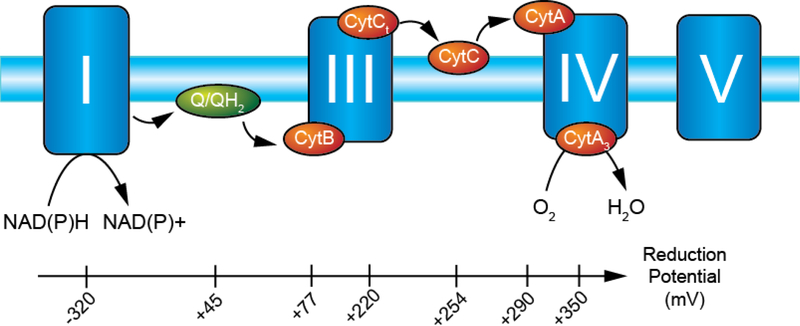
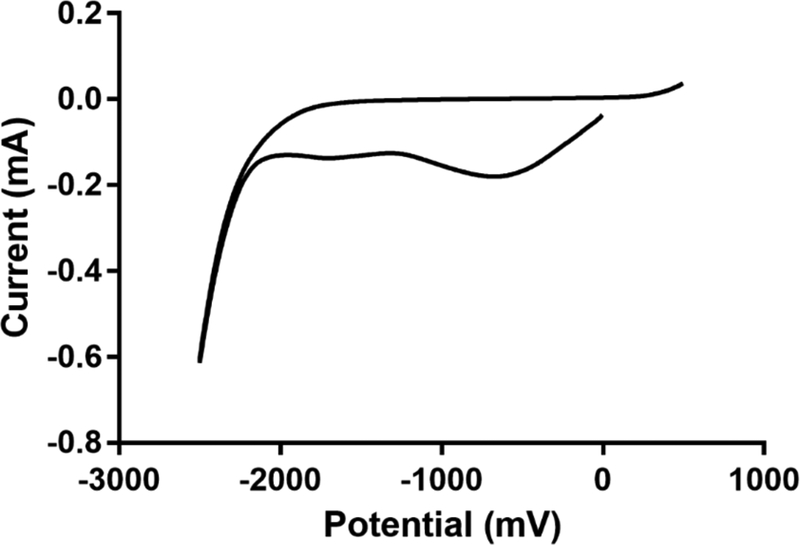
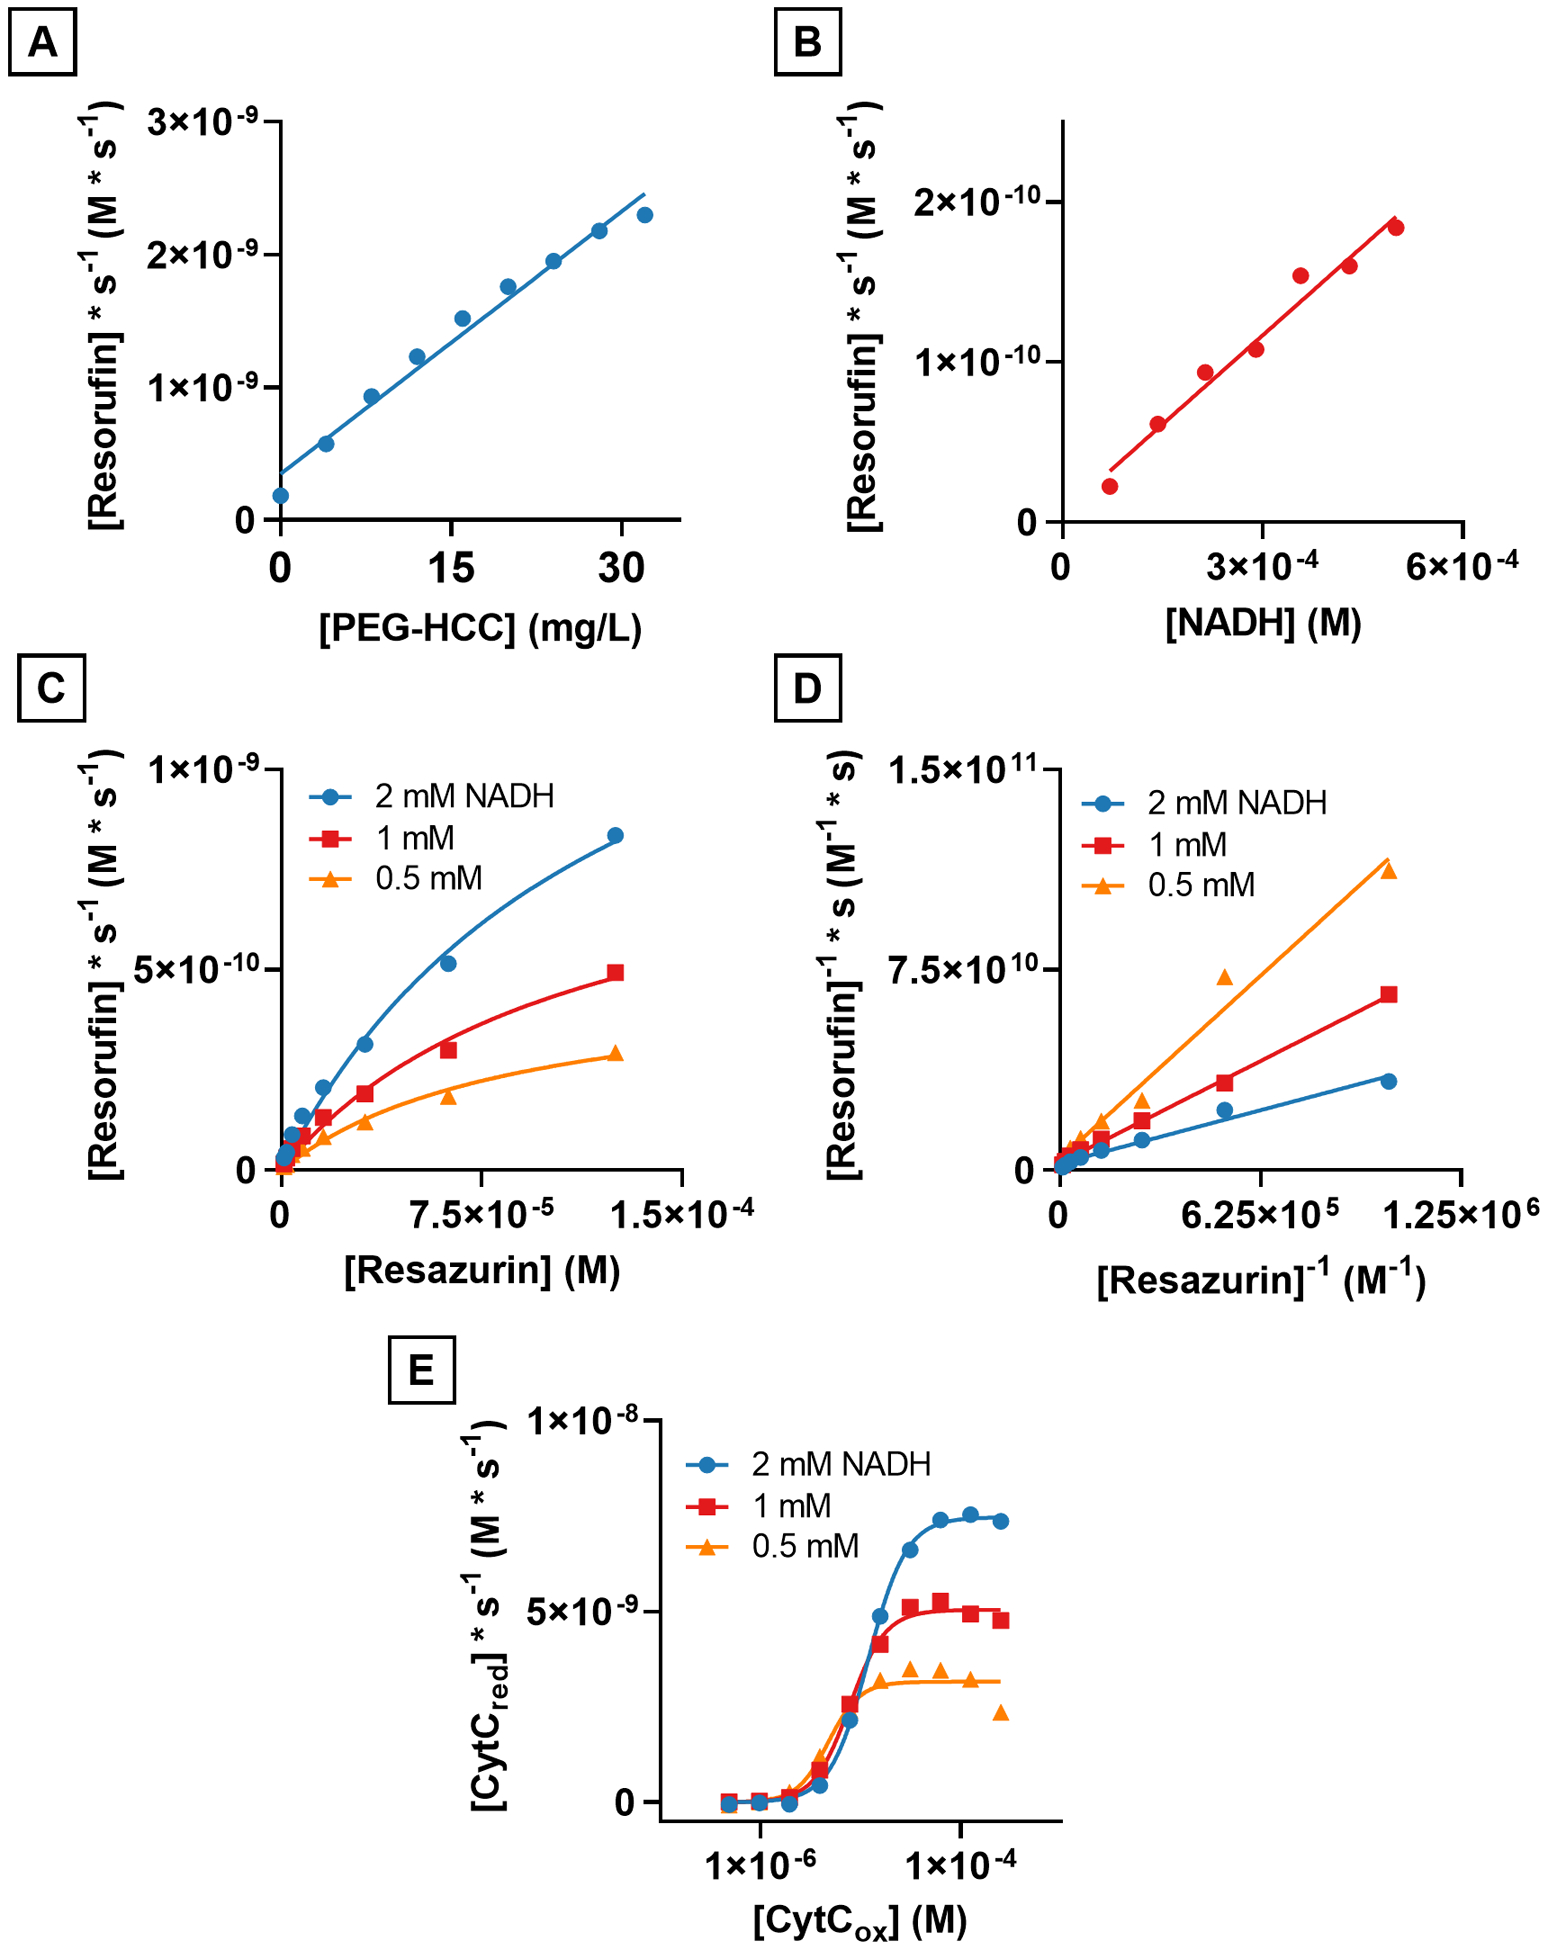
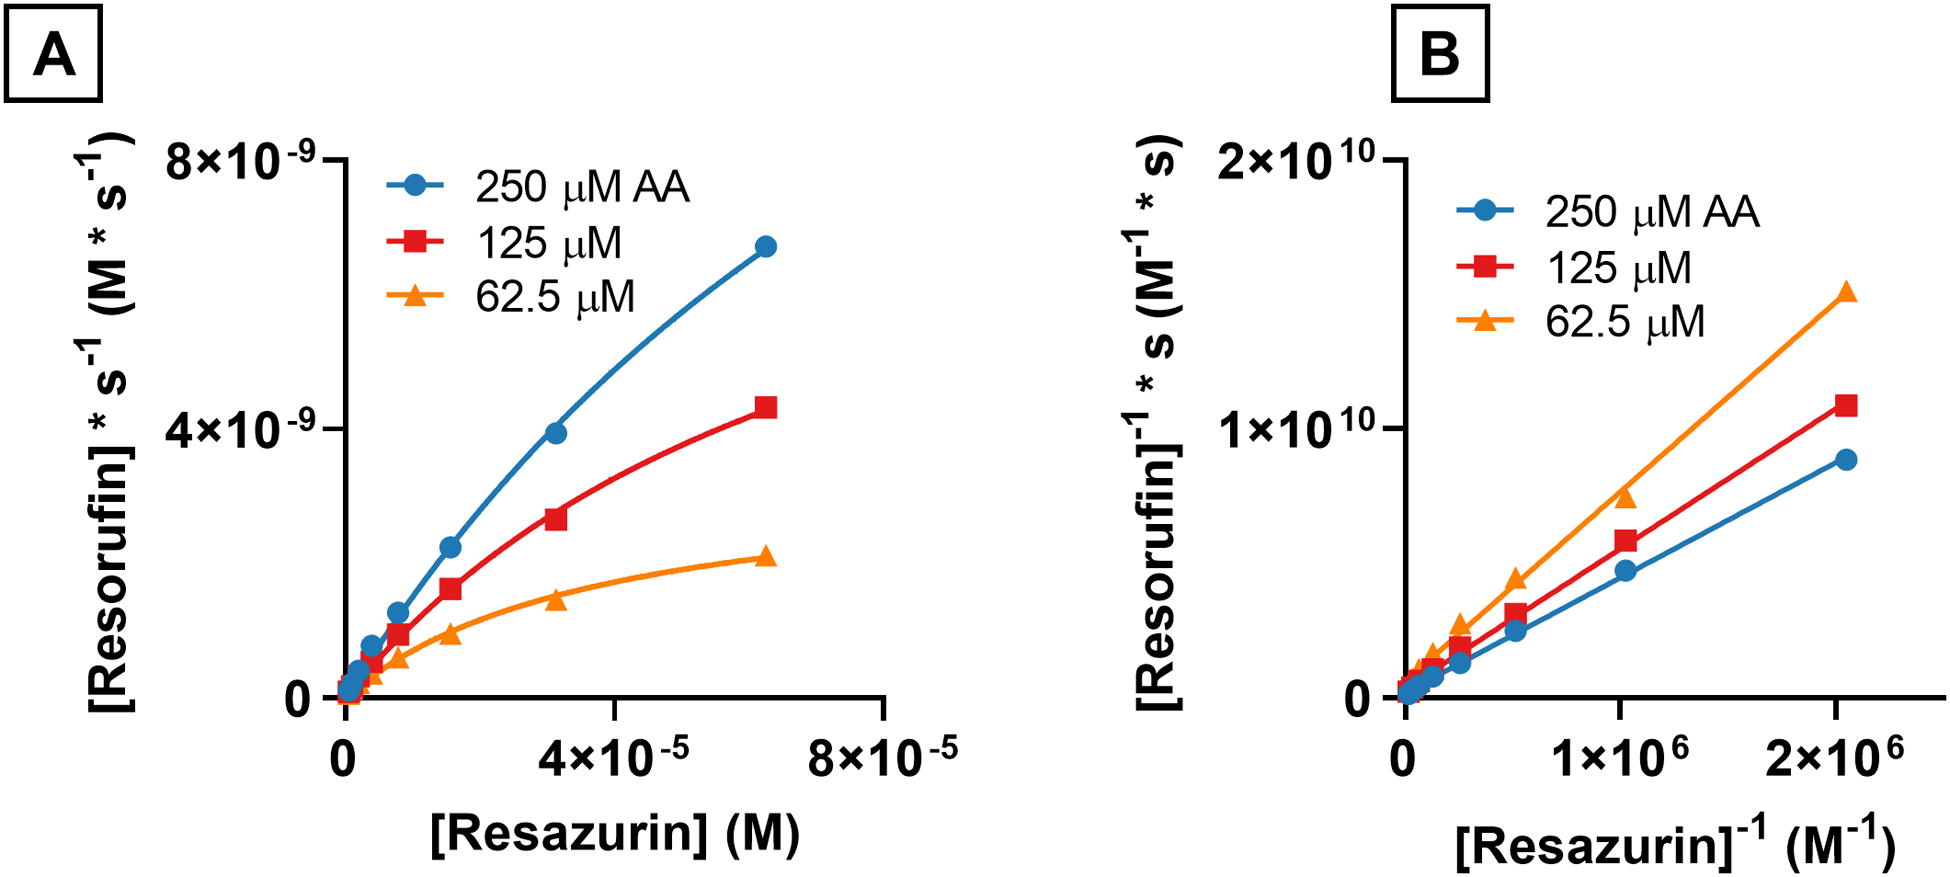
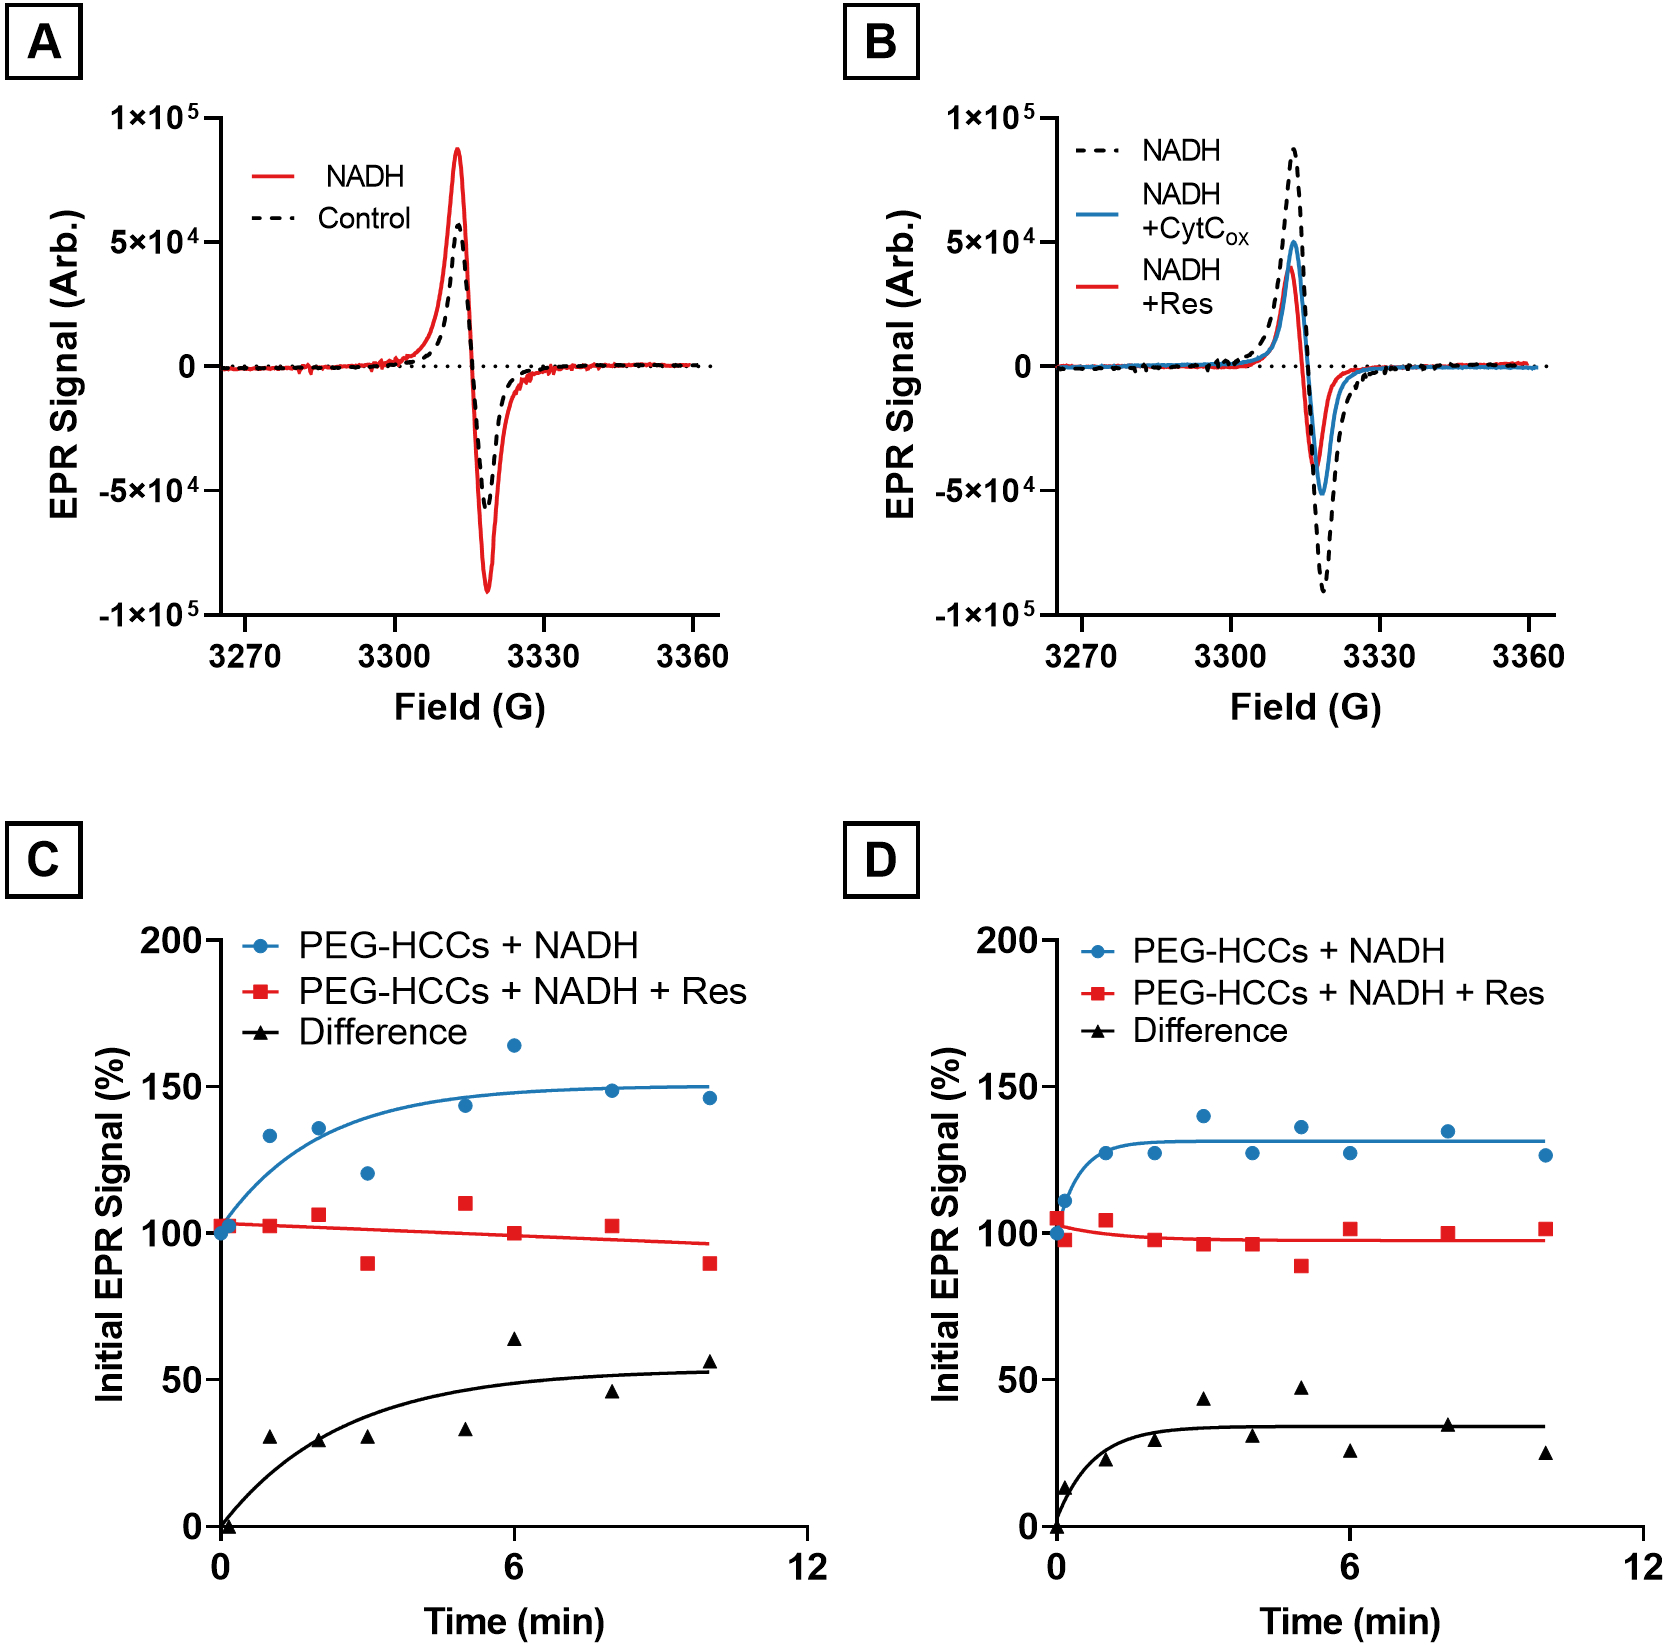
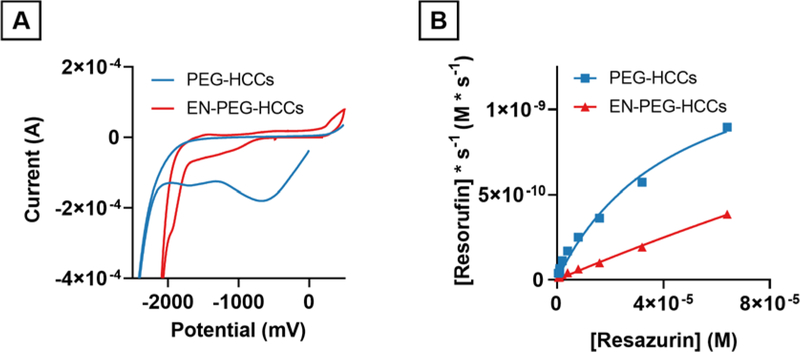
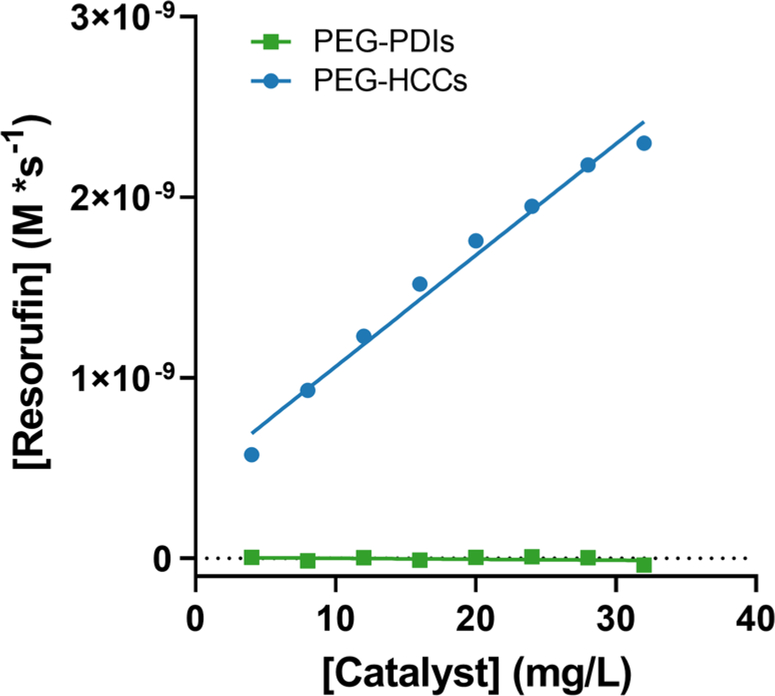
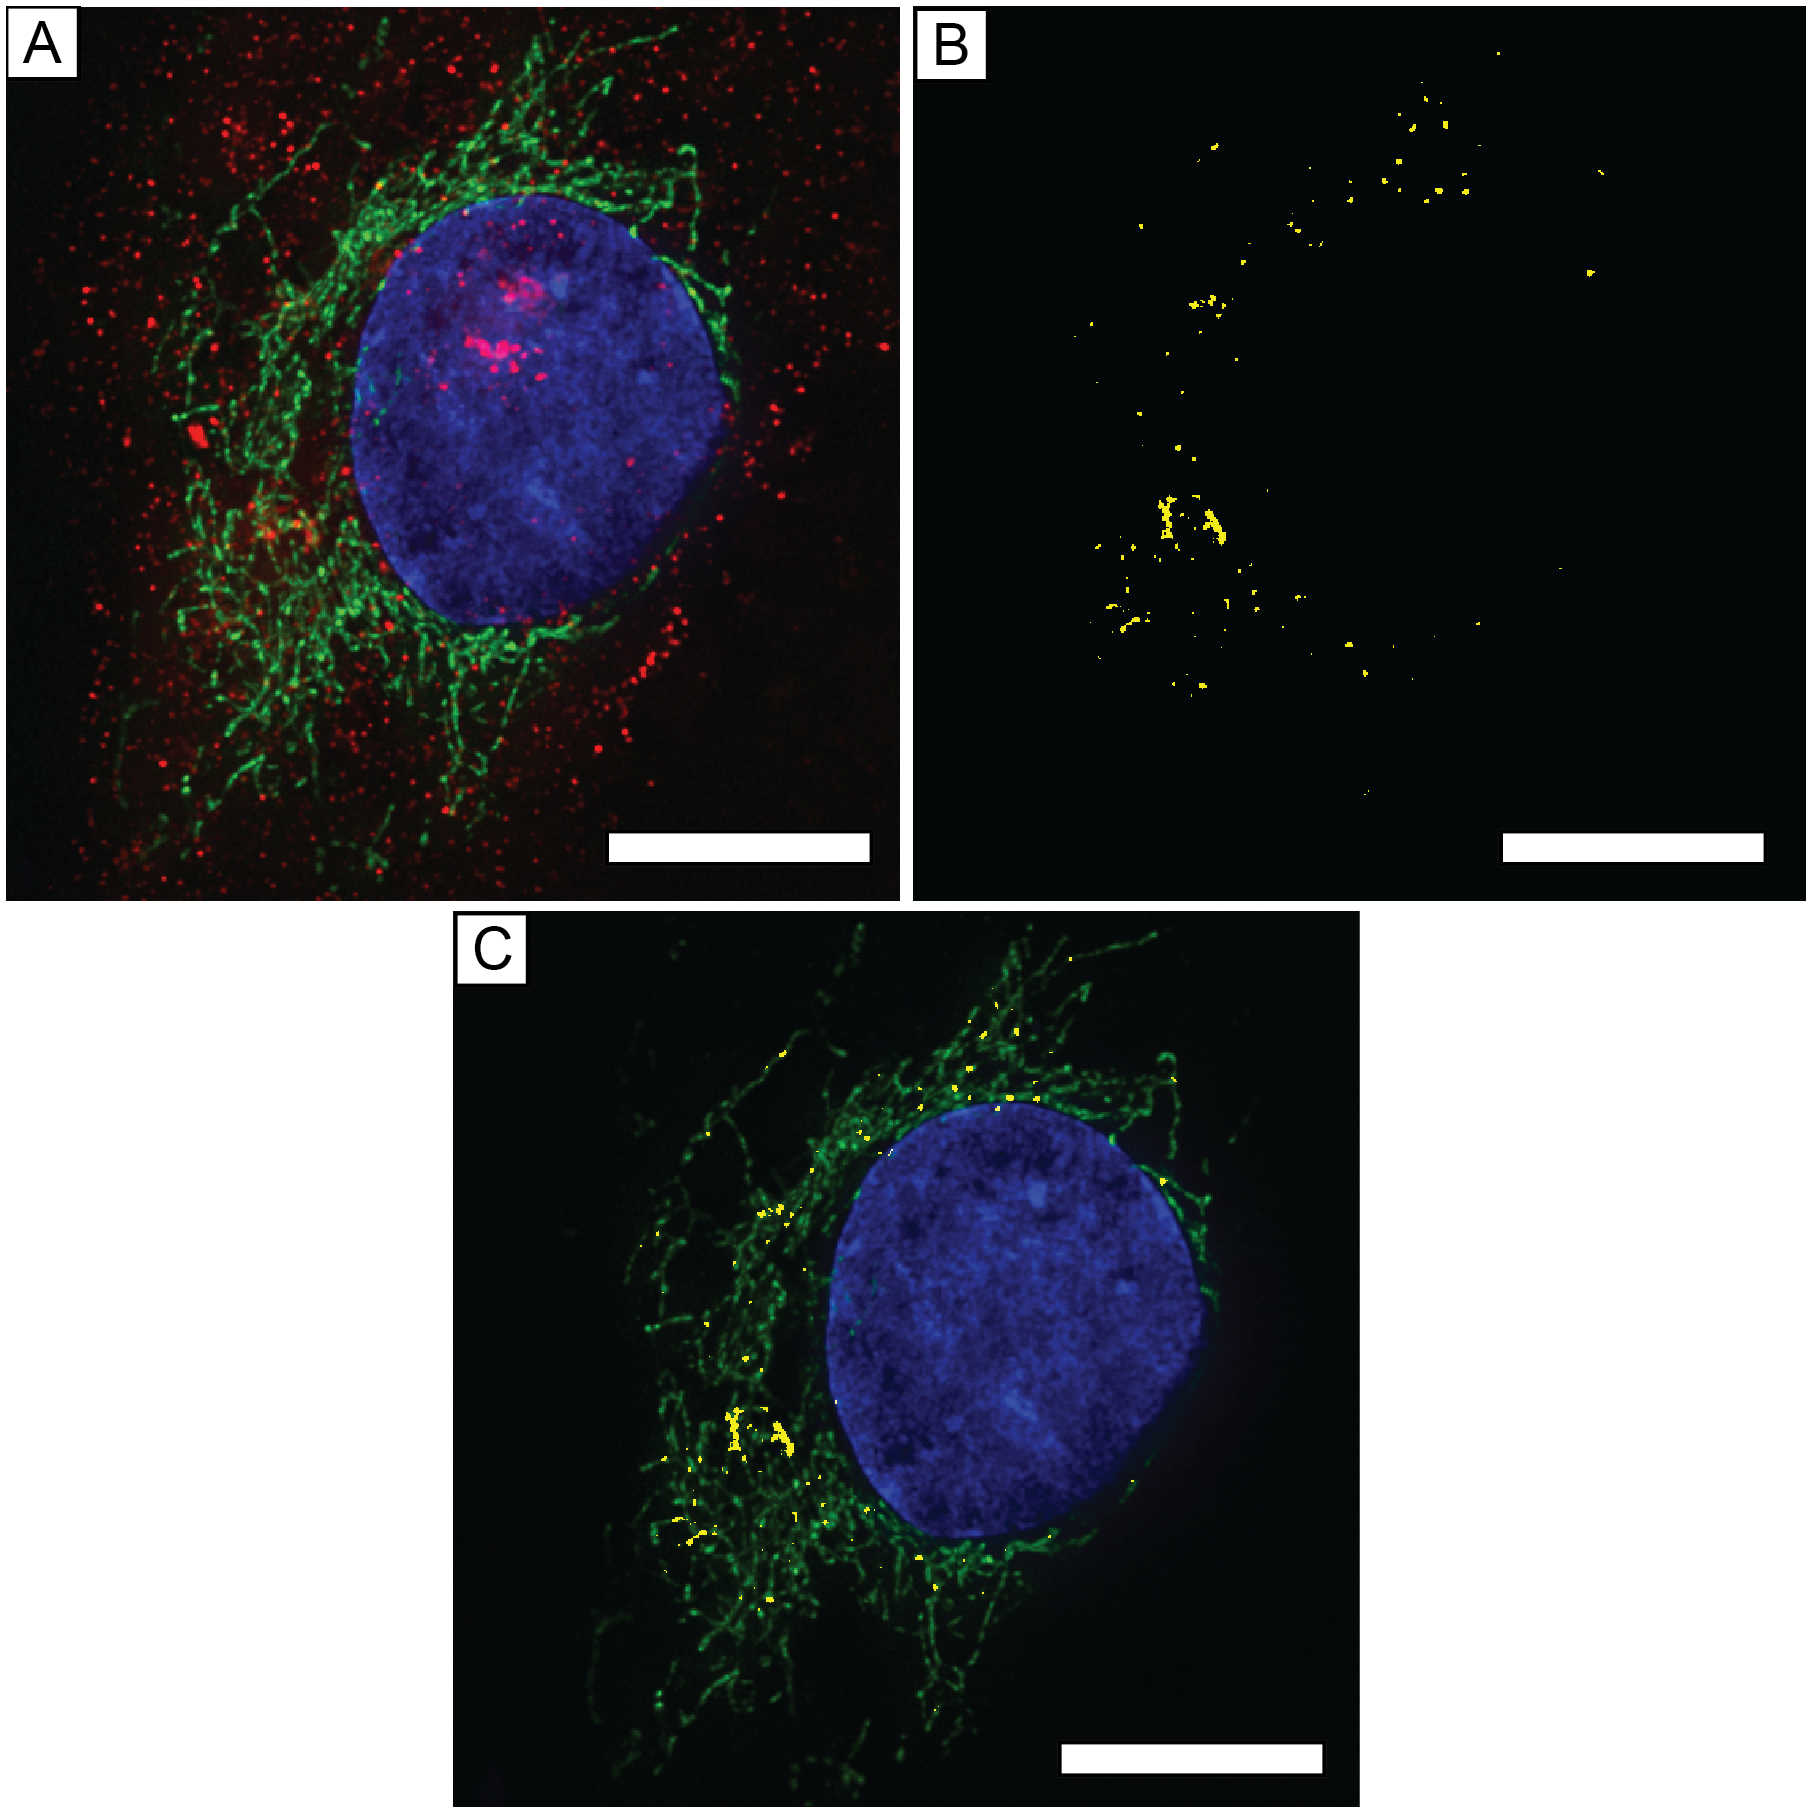
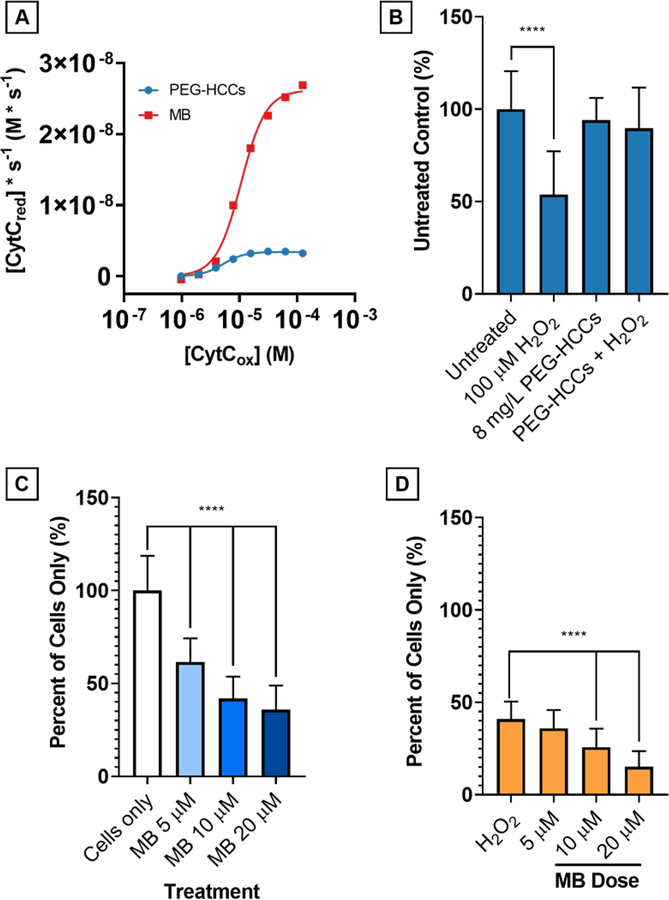
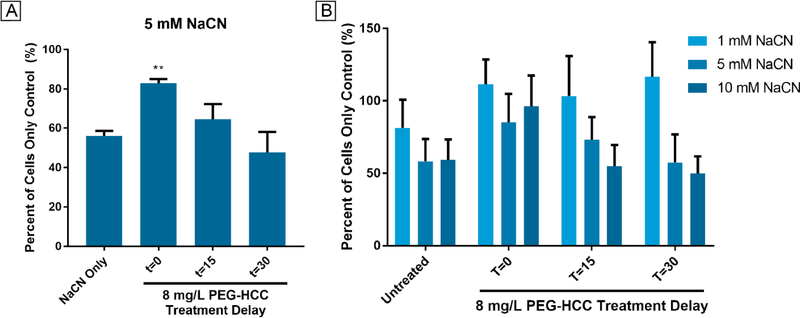
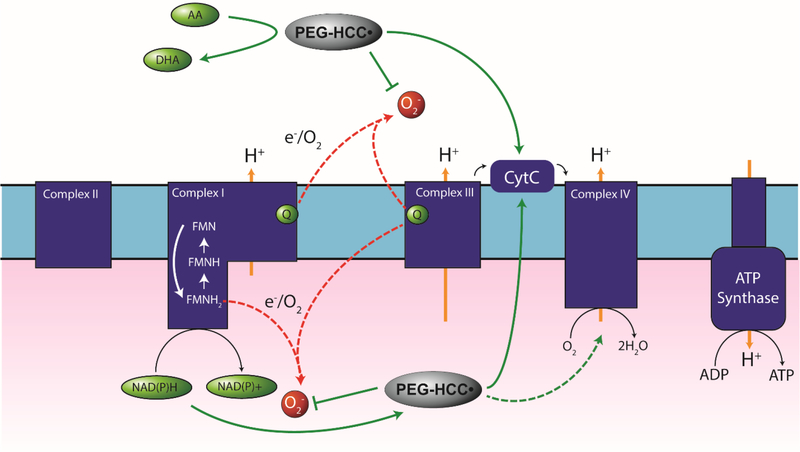
Previously, our group reported on the promising efficacy of poly(ethylene glycol)-hydrophilic carbon clusters (PEG-HCCs) to work as broadly active and high capacity antioxidants in brain ischemia and injury models including stroke and traumatic brain injury coupled with hemorrhagic shock. PEG-HCCs are a carbon nanomaterial derived from harsh oxidation of single wall carbon nanotubes and covalently modified with poly(ethylene glycol). They retain no tubular remnants and are composed of a highly oxidized carbon core functionalized with epoxy, peroxyl, quinone, ketone, carboxylate, and hydroxyl groups. HCCs are the redox active carbon core of PEG-HCCs, which have a broad reduction potential range starting at +200 mV and extending to -2 V. Here we describe a new property of these materials: the ability to catalytically transfer electrons between key surrogates and proteins of the mitochondrial electron transport complex in a catalytic fashion consistent with the concept of a nanozyme. The estimated reduction potential of PEG-HCCs is similar to that of ubiquinone and they enabled the catalytic transfer of electrons from low reduction potential species to higher reduction electron transport complex constituents. PEG-HCCs accelerated the reduction of resazurin (a test indicator of mitochondrial viability) and cytochrome c by NADH and ascorbic acid in solution. Kinetic experiments suggested a transient tertiary complex. Electron paramagnetic resonance demonstrated NADH increased the magnitude of PEG-HCCs' intrinsic radical, which then reduced upon subsequent addition of cytochrome c or resazurin. Deconvolution microscopy identified PEG-HCCs in close proximity to mitochondria after brief incubation with cultured SHSY-5Y human neuroblastoma cells. Compared to methylene blue (MB), considered a prototypical small molecule electron transport shuttle, PEG-HCCs were more protective against toxic effects of hydrogen peroxide in vitro and did not demonstrate impaired cell viability as did MB. PEG-HCCs were protective in vitro when cells were exposed to sodium cyanide, a mitochondrial complex IV poison. Because mitochondria are a major source of free radicals in pathology, we suggest that this newly described nanozyme action helps explain their in vivo efficacy in a range of injury models. These findings may also extend their use to mitochondrial disorders.


Figures

Figure 1.
Figure 1.
Reduction potentials of electron transport complex showing the favorable energetics leading to the reduction of dioxygen to water. Each member is reduced in series following the oxidation of NAD(P)H by the flavin moiety in Complex I (−320 mV). The energetics of the electron transport complex are favorable to maintain the proton gradient, the electron carrier (ubiquinone) between Complexes I/II and III, that are spatially separated from the carrier (CytC) between Complexes III and IV. Each reduction/oxidation reaction in Complexes I, III, and IV is used to transport protons from the matrix to the intermembrane space. Proton translocation cross the membrane is coupled with the catalysis of ATP formation by Complex V. Complex II is absent for clarity but reduces ubiquinone at the expense of succinate.
Figure 2.
Figure 2.
Cyclic voltammogram of PEG-HCCs in PBS. PEG-HCCs have characteristically broad reduction maxima near −750 mV and −1750 mV as part of a wave beginning at +200 mV and extending to −2 V. Scanning here began from 0 V to −2500 mV.
Figure 3.
Figure 3.
PEG-HCCs catalytically reduce both resazurin and ferricytochrome c (CytCox) with NADH to resorufin and ferrocytochrome c (CytCred), respectively. A) The reduction rate of resazurin in the presence of NADH is linearly related to the concentration of PEG-HCCs. B) The reduction rate of resazurin while holding the concentration of resazurin and PEG-HCCs constant varies linearly with the concentration of NADH. C) The reaction rates of NADH with resazurin and PEG-HCCs is not linearly related to the concentration of resazurin and no saturation point is observed within the detection limits of our instrumentation. D) Lineweaver-Burk plot of C showing intersecting lines suggesting the role of a ternary complex in the reduction of resazurin. E) NADH-linked reduction of CytCox to CytCred showing a saturation point at all three concentrations of NADH and full sigmoidal curve.
Figure 4.
Figure 4.
Reaction rates of ascorbic acid with resazurin and PEG-HCCs at various concentrations of ascorbic acid and resazurin. A) Reduction rates of resazurin by ascorbic acid catalyzed by PEG-HCCs (4 mg/L) fit to Michaelis-Menten saturation curves. B) Lineweaver-Burk plots of the reaction between resazurin, Asc and PEG-HCCs showing intersecting lines suggesting a ternary complex.
Figure 5.
Figure 5.
Electron paramagnetic resonance spectrometry (EPR) of PEG-HCCs in the presence of NADH and ferricytochrome c or resazurin. A) PEG-HCCs exposed to NADH (solid line) for 10 min compared to PEG-HCCs without NADH (black dotted line). B) PEG-HCCs exposed to NADH for 10 min (black dotted line) followed by the addition of ferricytochrome c (CytC, blue line) or resazurin (Res, red line) and flash frozen 10 s later. The resulting EPR signals are slightly lower than the baseline intensity shown in (A). C) Time course plot of PEG-HCC reduction with NADH and its oxidation with Res. The difference in signal intensity between PEG-HCCs treated with only NADH and PEG-HCCs treated with NADH and Res is shown in black. D) Time course plot of PEG-HCC reduction with NADH and its oxidation with CytC. The difference in signal intensity between PEG-HCCs treated with only NADH and PEG-HCCs treated with NADH and CytC is shown in black.
Figure 6.
Figure 6.
Cyclic voltammogram and reaction rates of PEG-HCCs and EN-PEG-HCCs. A) Cyclic voltammogram showing PEG-HCCs and EN-PEG-HCCs. EN-PEG-HCCs are absent the strong reduction at −750 mV and −1750 mV but have a new shoulder at approximately −1500 mV. B) Resazurin reduction kinetics. EN-PEG-HCCs reduce resazurin markedly slower than PEG-HCCs at the same concentration of catalyst (4 mg/L).
Figure 7.
Figure 7.
Reaction rates of PEG-HCCs and PEG-PDIs (4 mg/L – 32 mg/L) with 0.5 mM NADH and 64 μM resazurin. The reaction rate of PEG-PDIs is effectively zero M/s while the reaction rate with PEG-HCCs increases linearly with catalyst concentration.
Figure 8.
Figure 8.
Deconvolution microscopy images of a bEnd.3 cell treated with PEG-HCCs for 5 min. Nucleus is labeled with DAPI (blue), mitochondria were labeled with GFP containing a CytC oxidase subunit IV targeting sequence (green), and PEG-HCCs were labeled with rabbit-AntiPEG with a secondary AlexaFluor 647-labeled anti-rabbit IgG (red). A) Z-projection of SHSY-5Y cell with mitochondria, nucleus, and PEG-HCCs labeled. B) Z-projection of ANDed binarized Z-stacks of GFP and AlexaFluor 647 signals. C) Composite Z-projection of AlexaFluor 647-GFP and DAPI. Scale bars are all 10 μm.
Figure 9.
Figure 9.
Comparison of PEG-HCCs and MB at 4 mg/L concentration on reduction of CytCox by NADH (500 μM). A) On a mass concentration basis, MB has a higher Vmax than PEG-HCCs by nearly one order of magnitude. Without NADH, neither PEG-HCCs nor MB reduce CytC. PEG-HCCs rescue bEnd.3 cells from H2O2toxicity while MB is intrinsically toxic. B) bEnd.3 cells were treated with 100 μM H2O2 (54%, p < 0.0001) and 8 mg/L PEG-HCCs were added at 15 minutes following the initial insult. Live cell counts (n = 32) were performed and no toxicity of the PEG-HCCs (94%, p = 0.511) is observed, and 8 mg/L PEG-HCCs protection of bEnd.3 cells against H2O2 (90%, p = 0.105). C) MB given at 5, 10, and 20 μM causes dose-dependent cytotoxicity in bEnd.3 cells (p < 0.0001 at all levels). D) No protection is afforded when given immediately following treatment with 100 μM H2O2 (p < 0.0001 at all levels except 5 μM, p = 0.409).
Figure 10.
Figure 10.
Effect of cyanide concentration and PEG-HCC administration time on LIVE cell count of bEnd3 cells. A) Triplicate experiments with 5 mM NaCN show that PEG-HCCs can significantly (** p = 0.003) reduce death in bEnd.3 cells when given immediately and trends with time to less effectiveness. Averages generated by counting live cells in duplicate wells 16 times. Significance calculated with a Dunnett-corrected one-way ANOVA. B) A survey experiment with 1, 5 and 10 mM NaCN showed that PEG-HCCs appear to protect bEnd.3 cells from 1 mM NaCN at 0, 15, and 30 min and afforded partial protection from 5 mM NaCN at 0 and 15 min. Partial protection was also provided by PEG-HCCs when given at 0 min against 10 mM NaCN. All results are relative to untreated negative controls. Positive controls were treated with sodium cyanide at 1, 5, and 10 mM but not PEG-HCCs. The results show an inverse time-dependent and dose-dependent effect. As administration delay increases, the rescue effect is reduced. Error bars show standard deviation of 32 cell counts.
Figure 11.
Figure 11.. Proposed electron transfer pathways for PEG-HCCs.
PEG-HCCs are reduced by NAD(P)H and Asc and can donate electrons to superoxide, CytC, or potentially the oxygen reduction site Cyta3 on Complex IV. Transferring electrons to CytC from NADH would bypass inhibited Complexes I and III. Transferring electrons from NAD(P)H to Cyta3 would bypass impairment of Complexes I, III, and IV while providing electrons to reduce dioxygen to water. Red dashed arrows: example of electron leakage sites. Green dashed arrow: potential bypassing effects of cyanide. Green solid arrows: potential electron transfer pathways.

References

    1. Segal BH, Grimm MJ, Khan AN, Han W and Blackwell TS, Free Radic Biol Med, 2012, 53, 72–80. - PMC - PubMed
    1. Brieger K, Schiavone S, Miller FJ Jr. and Krause KH, Swiss Med Wkly, 2012, 142, w13659. - PubMed
    1. Nour M, Scalzo F and Liebeskind DS, Intervent Neurol, 2013, 1, 185–199. - PMC - PubMed
    1. Bitner BR, Marcano DC, Berlin JM, Fabian RH, Cherian L, Culver JC, Dickinson ME, Robertson CS, Pautler RG, Kent TA and Tour JM, ACS Nano, 2012, 6, 8007–8014. - PMC - PubMed
    1. Zweier JL and Talukder MA, Cardiovasc Res, 2006, 70, 181–190. - PubMed

MeSH terms