. 2019 Jun;46(3):279-297.
doi: 10.1007/s10827-019-00717-5. Epub 2019 May 27.

Spatiotemporal discrimination in attractor networks with short-term synaptic plasticity

Affiliations

Spatiotemporal discrimination in attractor networks with short-term synaptic plasticity

Benjamin Ballintyn et al. J Comput Neurosci. 2019 Jun.

Abstract

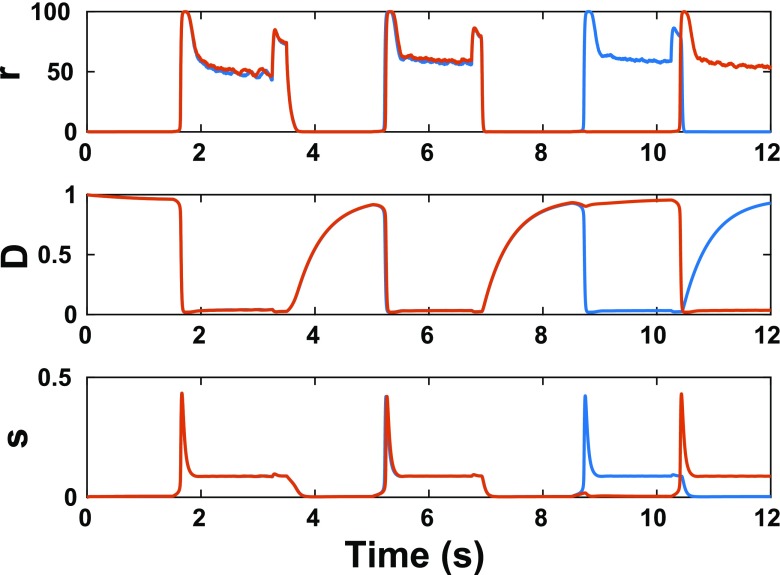
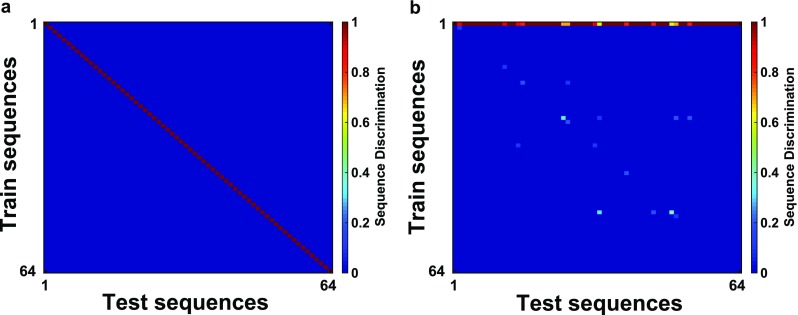
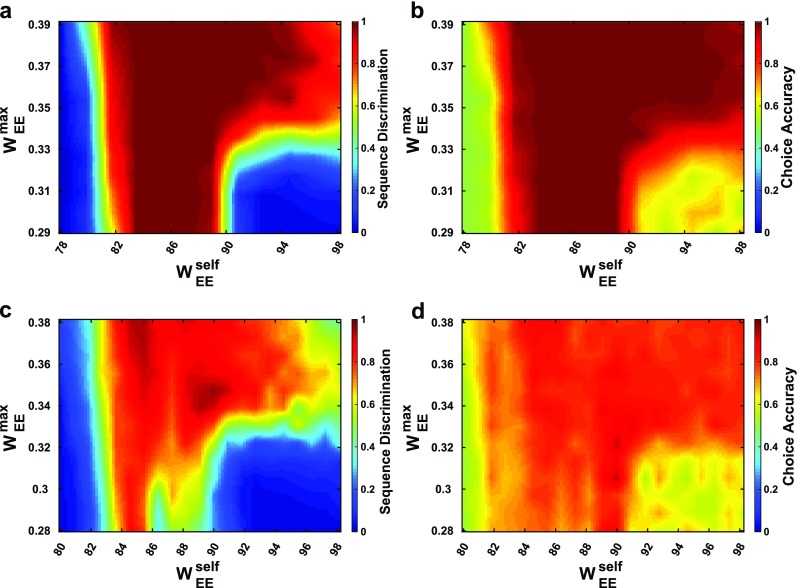
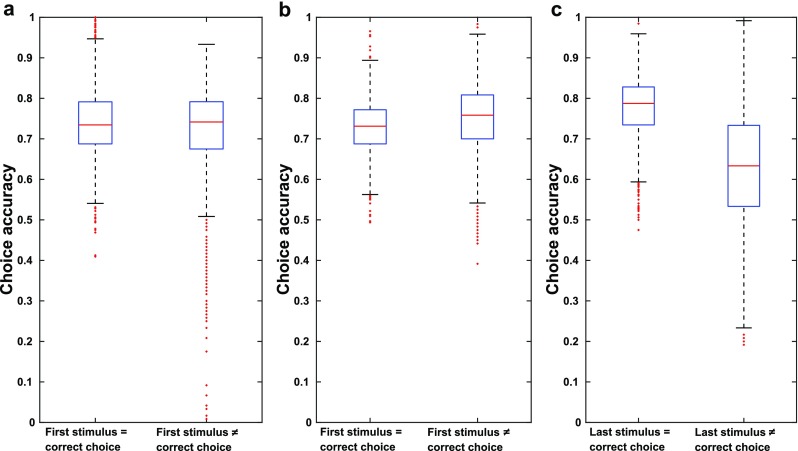
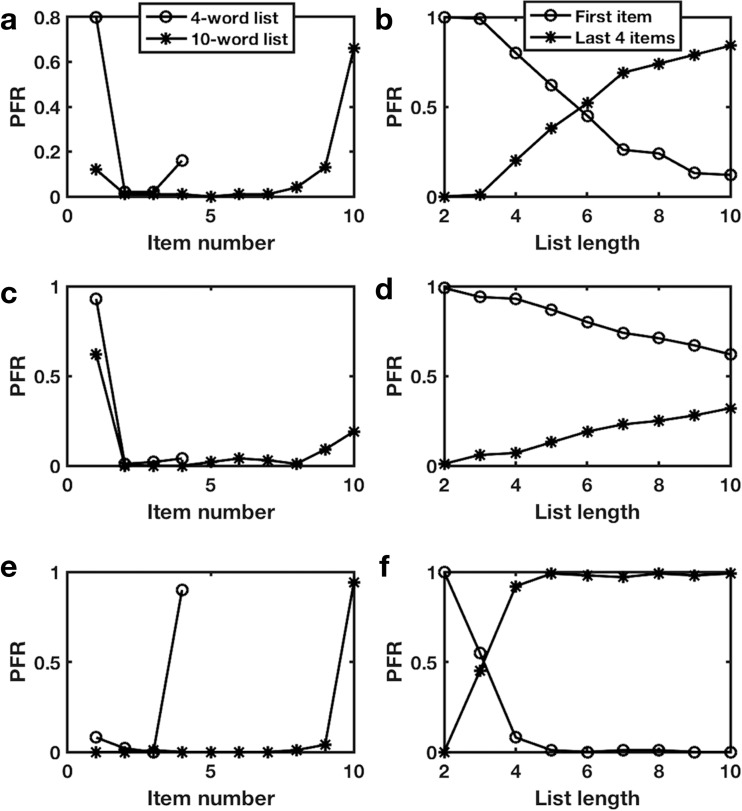
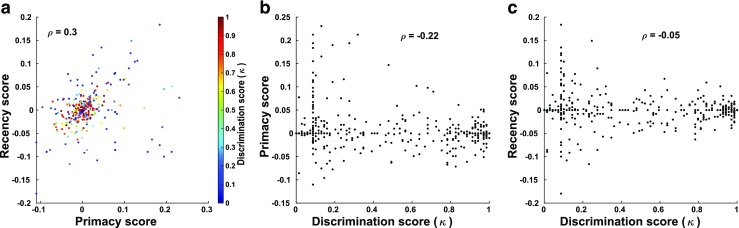
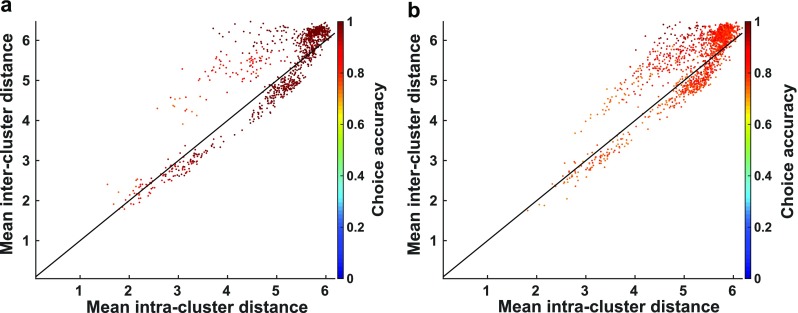
We demonstrate that a randomly connected attractor network with dynamic synapses can discriminate between similar sequences containing multiple stimuli suggesting such networks provide a general basis for neural computations in the brain. The network contains units representing assemblies of pools of neurons, with preferentially strong recurrent excitatory connections rendering each unit bi-stable. Weak interactions between units leads to a multiplicity of attractor states, within which information can persist beyond stimulus offset. When a new stimulus arrives, the prior state of the network impacts the encoding of the incoming information, with short-term synaptic depression ensuring an itinerancy between sets of active units. We assess the ability of such a network to encode the identity of sequences of stimuli, so as to provide a template for sequence recall, or decisions based on accumulation of evidence. Across a range of parameters, such networks produce the primacy (better final encoding of the earliest stimuli) and recency (better final encoding of the latest stimuli) observed in human recall data and can retain the information needed to make a binary choice based on total number of presentations of a specific stimulus. Similarities and differences in the final states of the network produced by different sequences lead to predictions of specific errors that could arise when an animal or human subject generalizes from training data, when the training data comprises a subset of the entire stimulus repertoire. We suggest that such networks can provide the general purpose computational engines needed for us to solve many cognitive tasks.

Keywords: Attractors; Decision-making; Sequence encoding; Synaptic depression.


Conflict of interest statement

The authors declare that they have no conflict of interest.

Figures

Fig. 1
Fig. 1
Schematic view of network. Excitatory self-connections render each excitatory unit bistable
Fig. 2
Fig. 2
Example unit dynamics. Dynamic variables are plotted for 2 units in response to a sequence of 6 alternating stimuli. (top) Firing rates (r) (middle) depression variable (D =1) indicates no depression) (bottom) synaptic output (s)
Fig. 3
Fig. 3
Confusion matrices for particular networks. Entry (i, j) gives the fraction of times test sequence j was identified as target sequence i. The particular network WEEself=88WEEmax=.476 in (a) achieved perfect discrimination (κ =1) while the network in (b) (WEEself=80,WEEmax=.28) achieved a discrimination of κ = .338
Fig. 4
Fig. 4
a–b Discrimination ability κ (a) and 2-choice accuracy (b) as a function of self and cross-excitation weights. One hundred twenty-one evenly spaced pairs of parameters were sampled and the results are interpolated across the self/cross-excitation space. All networks were noiseless with σ =0.c–d Same as a-b but for networks with a noise value of σ = .002. Two hundred seventy-three evenly spaced pairs of parameters were sampled
Fig. 5
Fig. 5
Likelihood of left choice vs. number of left cues. Psychometric curve for networks with a 2-choice accuracy > .73 (a threshold which could be achieved by guessing based solely on the last stimulus). Black line shows the mean left choice probability across networks while the shaded region shows the standard deviation
Fig. 6
Fig. 6
Patterns of choice errors relative to the first, 3rd, or last stimulus. Data shown is from all networks in Fig. 4c-d whose total choice accuracy was > .73. For all boxplots, red lines indicate the median, blue boxes indicate the range from 25th to 75th percentile, whiskers extend to 3 Median absolute deviations (MADs), and red “+” signs mark outliers (defined to be points beyond 3 MADs from the median. a Choice accuracies for sequences where the first stimulus does (left) or does not (right) support the correct choice. Mean choice accuracy for sequences where the first stimulus supported the correct choice were significantly higher than for sequences where the first stimulus did not support the correct choice (two-sample t-test: p ≪ .001). b Choice accuracies for sequences where the 3rd stimulus does (left) or does not (right) support the correct choice. Mean choice accuracy for sequences where the 3rd stimulus supported the correct choice were significantly lower than for sequences where the 3rd stimulus did not support the correct choice (two-sample t-test: p ≪ .001).c Choice accuracies for sequences where the last stimulus does (left) or does not (right) support the correct choice. Mean choice accuracy for sequences where the last stimulus supported the correct choice were significantly higher than for sequences where the first stimulus did not support the correct choice (two-sample t-test: p ≪ .001)
Fig. 7
Fig. 7
Correlations between excitatory unit activity and sequence properties from a network with perfect discrimination. a Correlations of unit activity with the last stimulus in a sequence were positively and significantly correlated with correlations of unit activity to the number of “left” stimuli (Pearson’s correlation ρ = .66, p ≪ .001). b Correlations of unit activity with the first stimulus in a sequence were not significantly correlated with correlations of unit activity to the number of “left” stimuli (Pearson’s correlation ρ = .22, p = .052)
Fig. 8
Fig. 8
Comparisons of trajectories through activity space due to sequences that differ in only 1 position. Transparent gray bars mark periods when the stimulus is active. a Networks differ in their 1st stimulus. Left: Network activity versus time for each sequence. Each row indicates the firing rate of one unit. While successive stimuli cause changes in the activity patterns, those changes are in part determined by the prior activity pattern. Right: Euclidean distance between the network states induced by the two sequences. Since the 2 sequences differ in their first stimulus, the activity trajectories separate immediately. b Same as (a) except the two sequences compared here differ in their 3rd stimulus
Fig. 9
Fig. 9
Probability of first recall exhibits primacy in short multi-item lists and recency in long multi-item lists. a, b: With appropriate parameters (Istim=0.9±0.2) matches behavioral data. c, d: Reduced stimulus strength (Istim=0.85±0.2) primacy dominates, but still decreases with increased list length. e, f: Increased stimulus strength (Istim=1.0±0.2) recency dominates in all lists beyond length 3. a, c, e: Probability of first recall (PFR) as a function of item position in the list for 4-item lists (circles) or 10-item lists (asterisks). b, d, f: Probability of recall for the first item (circles) or up to the last 4 items excluding the first item (asterisks) as a function of list length
Fig. 10
Fig. 10
Relationships between recall accuracy measures of primacy, recency, and discrimination ability for the multi-item task. a Scatterplot of primacy vs. recency scores. Color indicates discrimination ability (κ). Primacy and recency scores were found to have a significant positive correlation (Pearson’s correlation: ρ = .3, p ≪ .001). b Scatterplot of primacy scores vs. discrimination ability. Primacy scores and κ values were found to have a significant negative correlation (Pearson’s correlation: ρ =  − .22, p ≪ .001) c Scatterplot of recency scores vs. discrimination ability. Recency scores and κ values were not found to be significantly correlated (Pearson’s correlation: p = .067). Insets: correlation coefficients between each pair of variables. Note that the majority of the data points in all 3 plots are overlapping and indistinguishable. In the left plot these overlapping points are at (0,0) while in the middle/right plots they are at (0,1)
Fig. 11
Fig. 11
Effect of removing excitatory cross-connections. a–b Sequence discrimination (κ) with (a) and without (b) excitatory cross-connections as a function of excitatory self-connection strength. c–d Choice accuracy in the 2-choice task with (c) and without (d) excitatory cross-connections as a function of excitatory self-connection strength
Fig. 12
Fig. 12
Choice accuracy on trained vs. not trained sequences in the 2-choice task. Data shown are from 10 networks generated using the same parameter set. For all boxplots, red lines indicate the median, blue boxes indicate the range from 25th to 75th percentile, whiskers extend to 3 Median absolute deviations (MADs), and red “+” signs mark outliers (defined to be points beyond 3 MADs from the median. a–b Perceptrons were trained only on sequences where there were 4 of one stimulus type in the sequence (or equivalently 2 of the other stimulus type). (a) shows the distribution of choice accuracy (across the 10 networks) for sequences where there is more of one stimulus type than the other. (b) shows mean fraction of correct choices for sequences that were used to train the perceptrons or not. c–d Perceptrons were trained only on sequences where there were 5 or 6 of one stimulus type in the sequence (or equivalently 0 or 1 of the other stimulus type). (c) as in (a) shows mean error rates for sequences where there is more of one stimulus type than the other. (d) as in (b) shows the mean fraction of correct choices for sequences that were used to train the perceptrons (left) or not (right)
Fig. 13
Fig. 13
Separation of network states resulting from sequences with same number of “left” stimuli is similar to the separation of states resulting from sequences with different numbers of “left” stimuli. a Scatterplot of mean intra vs. inter-cluster distances for all networks in Fig. 4a that achieved a choice accuracy of > .73. A “cluster” is defined to be the set of binarized final network states produced by all sequences containing the same number of “left” (or “right”) stimuli. The mean inter-cluster distance across networks was found to be slightly but significantly greater than the mean intra-cluster distance (two-sample t-test: p ≪ .001). b Format is the same as (a) but shows data from all networks in Fig. 4b (noise value σ = .002) that achieved a choice accuracy > .73. Again, the mean inter-cluster distance across networks was found to be slightly but significantly higher (two-sample t-test: p ≪ .001). (Network states are defined as a binary vector, where each unit is designated to be “on” or “off” depending on whether its stable firing rate following a sequence of stimuli is greater than 30 Hz)

Similar articles

Cited by

References

    1. Barak O, Sussillo D, Romo R, Tsodyks M, Abbott LF. From fixed points to chaos: three models of delayed discrimination. Progress in Neurobiology. 2013;103:214–222. - PMC - PubMed
    1. Bathellier B, Ushakova L, Rumpel S. Discrete neocortical dynamics predict behavioral categorization of sounds. Neuron. 2012;76(2):435–449. - PubMed
    1. Bourjaily MA, Miller P. Synaptic plasticity and connectivity requirements to produce stimulus-pair specific responses in recurrent networks of spiking neurons. PLoS Computational Biology. 2011;7(2):e1001091. - PMC - PubMed
    1. Bourjaily MA, Miller P. Dynamic afferent synapses to decision-making networks improve performance in tasks requiring stimulus associations and discriminations. Journal of Neurophysiology. 2012;108(2):513–527. - PMC - PubMed
    1. Brunel N. Dynamics and plasticity of stimulus-selective persistent activity in cortical network models. Cerebral Cortex. 2003;13(11):1151–1161. - PubMed

Publication types

LinkOut - more resources