. 2021 Jan 28;22(1):68-81.
doi: 10.1093/biostatistics/kxz010.

The functional false discovery rate with applications to genomics

Affiliations

The functional false discovery rate with applications to genomics

Xiongzhi Chen et al. Biostatistics. .

Abstract

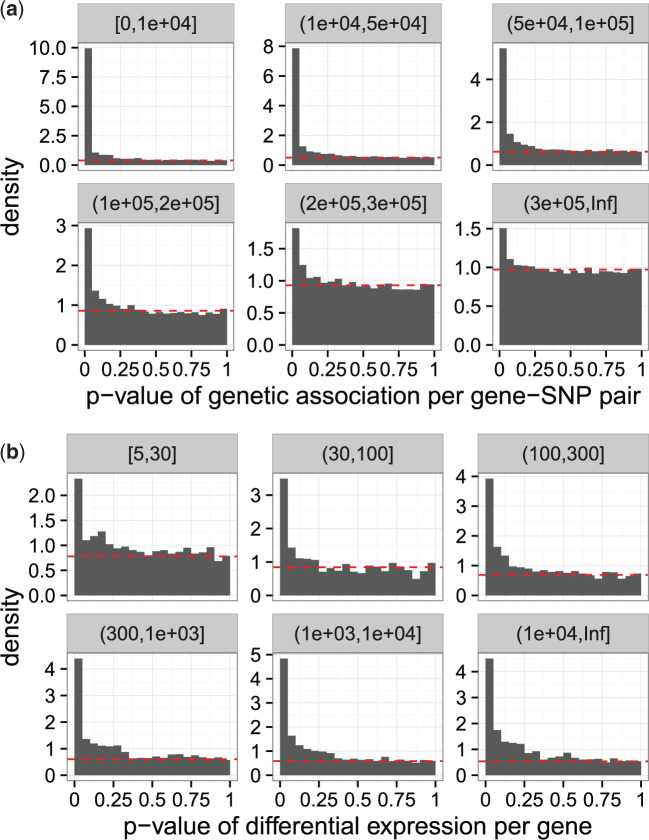
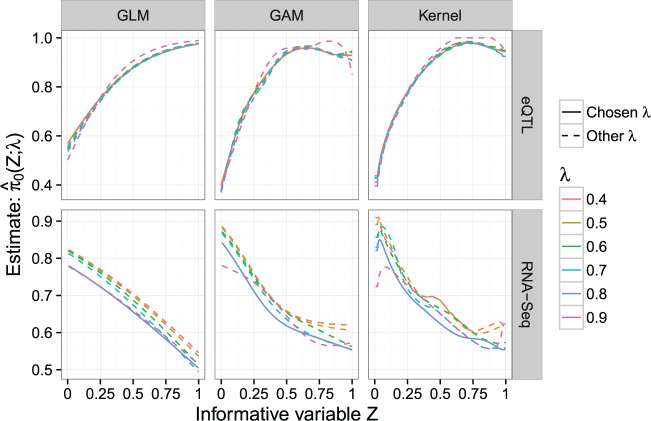
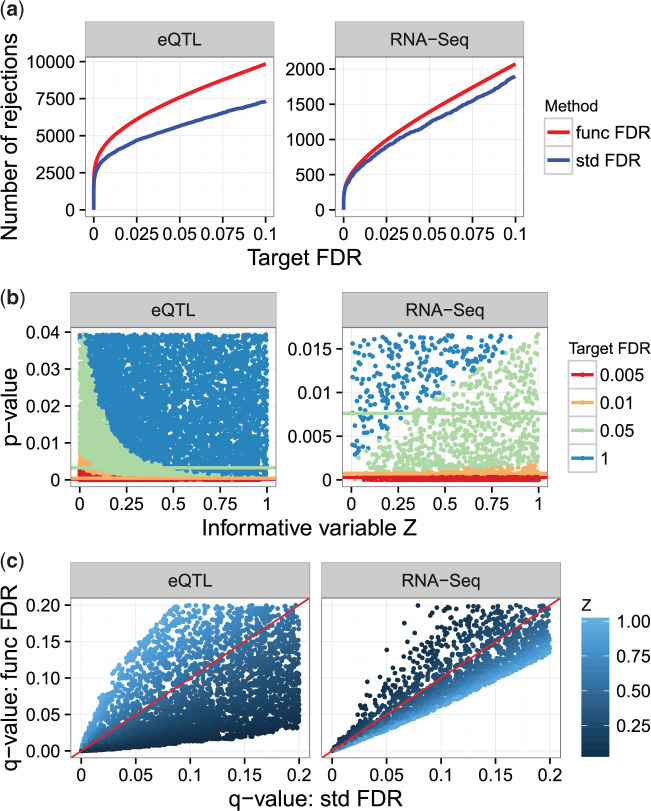
The false discovery rate (FDR) measures the proportion of false discoveries among a set of hypothesis tests called significant. This quantity is typically estimated based on p-values or test statistics. In some scenarios, there is additional information available that may be used to more accurately estimate the FDR. We develop a new framework for formulating and estimating FDRs and q-values when an additional piece of information, which we call an "informative variable", is available. For a given test, the informative variable provides information about the prior probability a null hypothesis is true or the power of that particular test. The FDR is then treated as a function of this informative variable. We consider two applications in genomics. Our first application is a genetics of gene expression (eQTL) experiment in yeast where every genetic marker and gene expression trait pair are tested for associations. The informative variable in this case is the distance between each genetic marker and gene. Our second application is to detect differentially expressed genes in an RNA-seq study carried out in mice. The informative variable in this study is the per-gene read depth. The framework we develop is quite general, and it should be useful in a broad range of scientific applications.

Keywords: q-value; FDR; Functional data analysis; Genetics of gene expression; Kernel density estimation; Local false discovery rate; Multiple hypothesis testing; RNA-seq; Sequencing depth; eQTL.


Figures

Fig. 1.
Fig. 1.
(a) P-value histograms of Wilcoxon tests for genetic association between genes and SNPs for the eQTL experiment in Smith and Kruglyak (2008), divided into six strata based on the gene–SNP basepair distance indicated by the strip names. The null hypothesis is “no association between a gene–SNP pair”. (b) P-value histograms for assessing differential gene expression in the RNA-seq study in Bottomly and others (2011), divided into six strata based on per-gene read depth indicated by the strip names. The null hypothesis is “no differential expression (for a gene) between two conditions”. In each subplot, the estimated proportion of true null hypotheses for all hypotheses in the corresponding stratum is based on Storey (2002) and indicated by the horizontal dashed line. It can be seen that gene–SNP genetic distance or per-gene read depth affects the prior probability of a gene–SNP association or differential gene expression.
Fig. 2.
Fig. 2.
Estimate formula image of the functional null proportion formula image for the eQTL and RNA-seq studies, using the GLM, GAM, or Kernel method. Each plot shows the estimate formula image for different values of the tuning parameter formula image, where the solid curve corresponds to the chosen tuning parameter value. The tuning parameter is chosen to balance the trade-off between the integrated bias and variance of the function formula image; details on how to choose formula image are given in Section 2 of the supplementary material available at Biostatistics online.
Fig. 3.
Fig. 3.
The fFDR method applied for multiple testing in the eQTL and RNA-seq analyses. (a) Number of significant hypothesis tests at various target FDRs. The fFDR method (func FDR) has more significant tests than the standard FDR method (std FDR) at all target FDRs. (b) The significance regions of the fFDR method for various target FDRs, indicated by scatter plots of the p-values and informative variable. The horizontal lines indicate the significance thresholds that would be used by the standard FDR method at the same target FDRs. Clearly, these lines do not take the informative variable into account. (c) A scatter plot comparing the q-values for the standard FDR method (formula image axis) to the q-values for the fFDR method (formula image axis), colored based on the informative variable formula image with reference line formula image in red. It is clear that the fFDR method re-ranks the significance of hypotheses tests.

References

    1. Benjamini, Y. and Heller, R. (2007). False discovery rates for spatial signals. Journal of the American Statistical Association 102, 1272–1281.
    1. Benjamini, Y. and Hochberg, Y. (1995). Controlling the false discovery rate: a practical and powerful approach to multiple testing. Journal of the Royal Statistical Society. Series B 57, 289–300.
    1. Boca, S. M. and Leek, J. T. (2018). A direct approach to estimating false discovery rates conditional on covariates. PeerJ 6: e6035. - PMC - PubMed
    1. Bottomly, D., Walter, N. A. R., Hunter, J. E., Darakjian, P., Kawane, S., Buck, K. J., Searles, R. P., Mooney, M., McWeeney, S. K. and Hitzemann, R. (2011). Evaluating gene expression in C57BL/6J and DBA/2J mouse striatum using RNA-Seq and microarrays. PLoS One 6, e17820. - PMC - PubMed
    1. Brem, R. B., Yvert, G., Clinton, R. and Kruglyak, L. (2002). Genetic dissection of transcriptional regulation in budding yeast. Science 296, 752–755. - PubMed

Publication types

Substances