. 2019 Aug;86(2):264-278.
doi: 10.1002/ana.25508. Epub 2019 Jun 19.

Induction of brain-infiltrating T-bet-expressing B cells in multiple sclerosis

Affiliations

Induction of brain-infiltrating T-bet-expressing B cells in multiple sclerosis

Jamie van Langelaar et al. Ann Neurol. 2019 Aug.

Abstract

Objective: Results from anti-CD20 therapies demonstrate that B- and T-cell interaction is a major driver of multiple sclerosis (MS). The local presence of B-cell follicle-like structures and oligoclonal bands in MS patients indicates that certain B cells infiltrate the central nervous system (CNS) to mediate pathology. Which peripheral triggers underlie the development of CNS-infiltrating B cells is not fully understood.

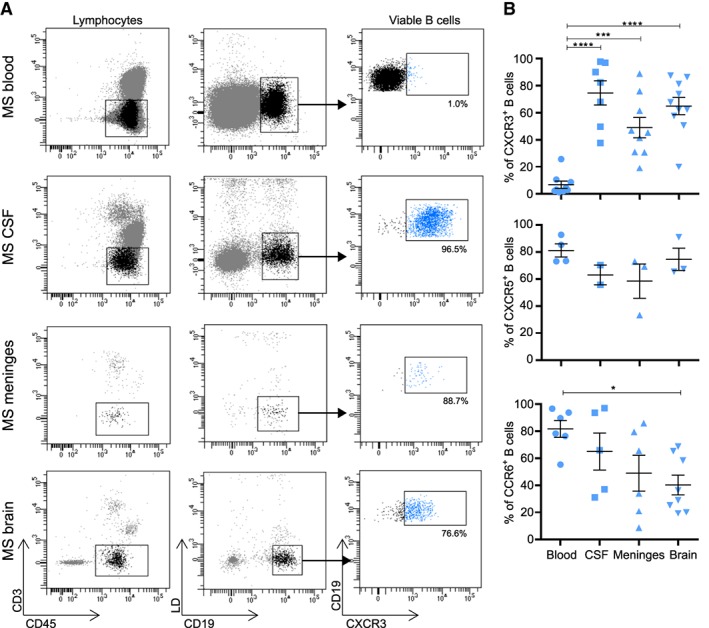
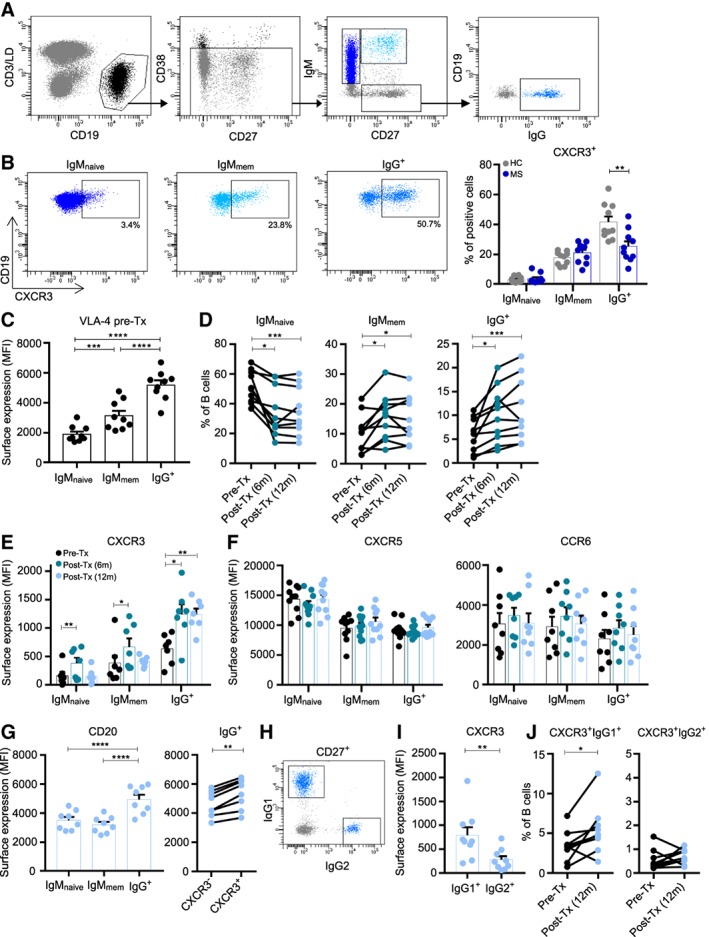
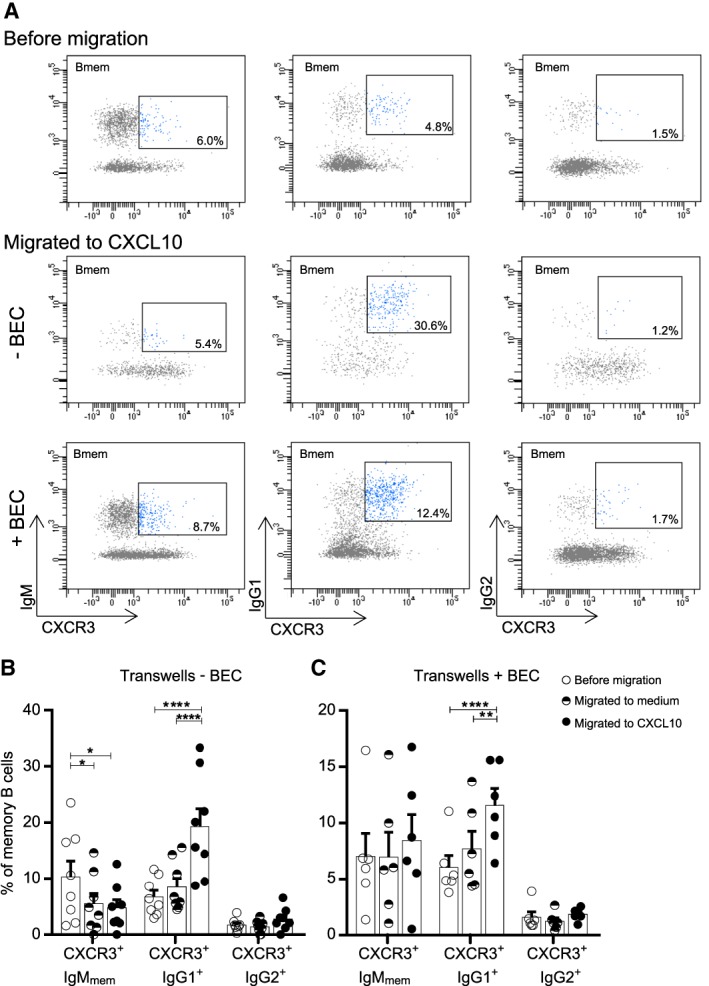
Methods: Ex vivo flow cytometry was used to assess chemokine receptor profiles of B cells in blood, cerebrospinal fluid, meningeal, and brain tissues of MS patients (n = 10). Similar analyses were performed for distinct memory subsets in the blood of untreated and natalizumab-treated MS patients (n = 38). To assess T-bet(CXCR3)+ B-cell differentiation, we cultured B cells from MS patients (n = 21) and healthy individuals (n = 34) under T helper 1- and TLR9-inducing conditions. Their CNS transmigration capacity was confirmed using brain endothelial monolayers.

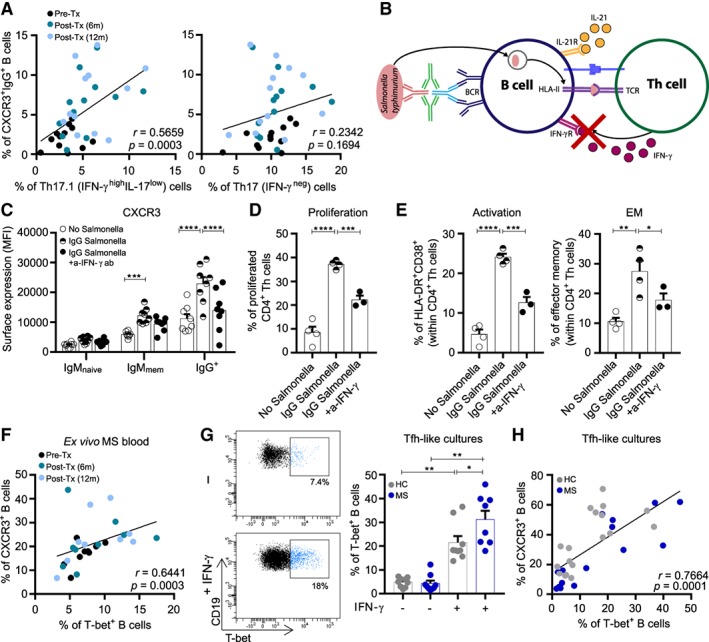
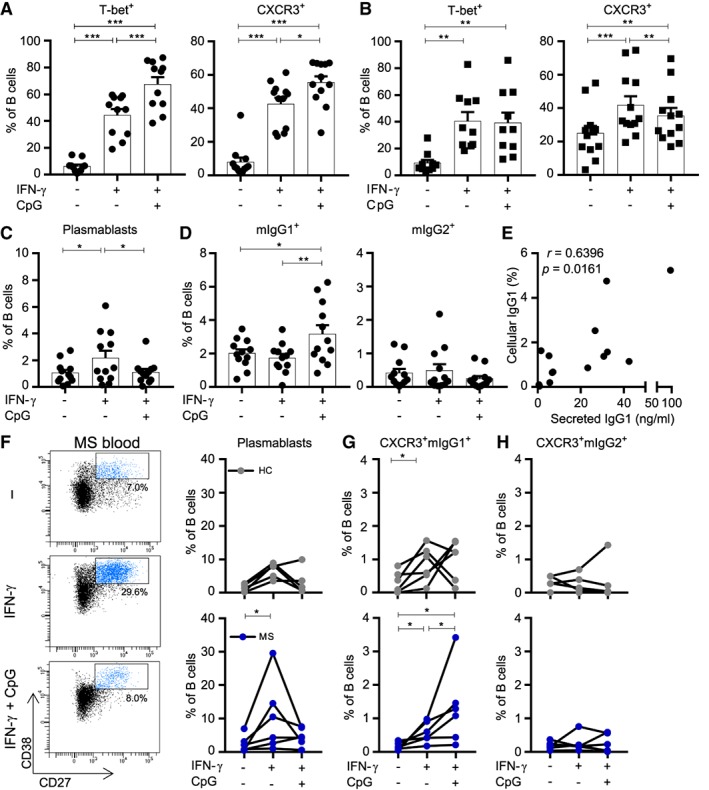
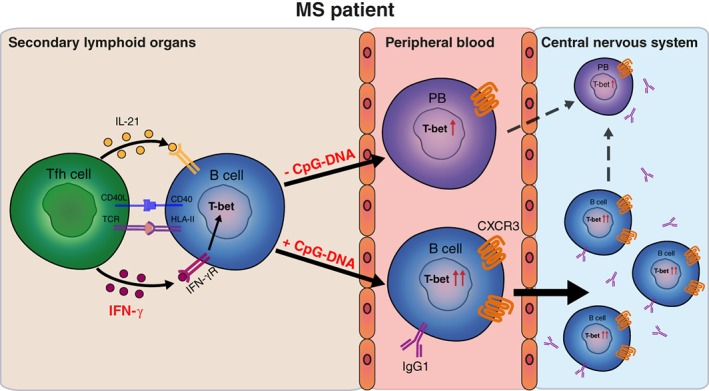
Results: CXC chemokine receptor 3 (CXCR3)-expressing B cells were enriched in different CNS compartments of MS patients. Treatment with the clinically effective drug natalizumab prevented the recruitment of CXCR3high IgG1+ subsets, corresponding to their increased ability to cross CNS barriers in vitro. Blocking of interferon-γ (IFNγ) reduced the transmigration potential and antigen-presenting function of these cells. IFNγ-induced B cells from MS patients showed increased T-bet expression and plasmablast development. Additional TLR9 triggering further upregulated T-bet and CXCR3, and was essential for IgG1 switching.

Interpretation: This study demonstrates that T-bethigh IgG1+ B cells are triggered by IFNγ and TLR9 signals, likely contributing to enhanced CXCR3-mediated recruitment and local reactivity in the CNS of MS patients. ANN NEUROL 2019;86:264-278.


Conflict of interest statement

Nothing to report.

Figures

Figure 1
Figure 1
CXCR3+ B cells are abundant in the central nervous system compared to blood of multiple sclerosis (MS) patients. (A) Representative flow‐activated cell sorting (FACS) plots and gating of CXCR3‐expressing CD19+ B cells within viable CD45+CD3 lymphocyte fractions derived from the blood, cerebrospinal fluid (CSF), meninges, and brain tissue of an MS patient. (B) Frequencies of CXCR3+, CXCR5+, and CCR6+ B cells in distinct paired compartments from MS patients. For blood, CSF, and meningeal samples each dot represents a different patient. A total of 10 brain tissues from 7 different MS patients were used for the analysis of CXCR3+ B cells. Any samples with <25 viable B cells were excluded from these analyses. Data are presented as the mean ± standard error of the mean. *p < 0.05, ***p < 0.001, ****p < 0.0001. The p values for B were calculated by a 1‐way analysis of variance test. LD = live/dead (for detection of viable cells).
Figure 2
Figure 2
Reduced frequencies and natalizumab‐mediated accumulation of CXCR3+IgG(1)+ B cells in multiple sclerosis (MS) blood. (A) FACS gating strategy used to define IgMnaive (CD27IgM+), IgMmem (CD27+IgM+), and IgG+ (CD27+IgG+) B‐cell subsets. (B) Gating and quantification of CXCR3‐expressing IgMnaive, IgMmem, and IgG+ B‐cell frequencies in the blood of untreated MS patients (n = 10; dark blue dots) and both age‐ and gender‐matched healthy controls (HC; n = 10; gray dots, see Table 1). (C) VLA‐4 surface expression on IgMnaive, IgMmem, and IgG+ B cells from blood of MS patients before natalizumab treatment (n = 9). (D) The percentage of IgMnaive, IgMmem, and IgG+ B cells in MS blood before (black dots) and both 6 months (marine blue dots) and 12 months (light blue dots) after natalizumab treatment (paired samples; n = 10; see Table 1). (E, F) Surface expression levels of CXCR3 (E), CXCR5 and CCR6 (F) on IgMnaive, IgMmem, and IgG+ B cells in MS patient blood before and after natalizumab treatment (n = 7–10). (G) CD20 expression on IgMnaive, IgMmem, and IgG+ B cells as well as paired CXCR3 and CXCR3+ IgG+ populations in blood of MS patients treated with natalizumab for 12 months (n = 8). (H–J) Gating example and quantifications of IgG1+ and IgG2+ B cells expressing CXCR3 in MS patients treated with natalizumab for 12 months (n = 9). Data are presented as the mean ± standard error of the mean. *p < 0.05, **p < 0.01, ***p < 0.001, ****p < 0.0001. The p values were calculated by Mann–Whitney U (B), 2‐way analysis of variance (C, G), Friedman paired (D–F), and Wilcoxon matched‐pairs signed rank (G, I, and J) tests. MFI = mean fluorescence intensity; Tx = treatment; LD = live/dead (for detection of viable cells).
Figure 3
Figure 3
Enhanced migration of CXCR3+IgG1+ B cells across transwell filters and human brain endothelial monolayers in vitro. Sorted memory B cells from healthy donor blood were assessed for selective in vitro transmigration toward CXCL10. (A) Representative FACS plots and (B, C) quantifications of viable CXCR3‐expressing IgMmem, IgG1+ and IgG2+ B cells migrating across transwell filters with and without confluent monolayers of human brain endothelial cells (BEC). Percentages of subsets within the total memory pool were compared before and after migration, both to medium and to CXCL10 (−BEC, n = 8; +BEC, n = 6). These experiments were performed in duplicate for each donor for which the average is shown. Data are presented as the mean ± standard error of the mean. *p < 0.05, **p < 0.01, ****p < 0.0001. The p values were calculated by 2‐way analysis of variance (B, C).
Figure 4
Figure 4
T helper (Th) 1 cytokine interferon‐γ (IFNγ) is a major trigger of CXCR3+(T‐bet+) B‐cell differentiation in multiple sclerosis (MS). (A) Correlation of ex vivo CXCR3+IgG+ B cells with Th17.1 (IFNγhighIL‐17low) and Th17 (IFNγneg) cells in MS blood before and after natalizumab treatment (pre‐Tx and post‐Tx; n = 12). (B) Experimental model of Salmonella‐primed autologous B‐ and T‐cell cocultures. (C–E) B cells from healthy donor blood were primed with S. typhimurium through B‐cell receptor (BCR) crosslinking using a tetrameric antibody complex, as described in Subjects and Methods. This allows BCR‐mediated Salmonella uptake, processing, and presentation on MHC II molecules to Th cells. IL‐21 was added with and without an IFNγ blocking antibody to analyze the effects on CXCR3 expression by B cells (C), and on the proliferation, activation, and effector memory (EM) phenotype of Th cells (D, E). These experiments were performed in 2 independent experiments and in duplicate for (C) 4 and (D, E) 2 different blood donors. (F) Correlation of surface CXCR3 and intracellular T‐bet expression in ex vivo B cells of MS patients before and after natalizumab treatment (pre‐Tx and post‐Tx; n = 9). (G, H) Total B cells from the blood of MS patients (n = 9) and both age‐ and gender‐matched healthy controls (HC; n = 10) were cultured in vitro under T follicular helper (Tfh)‐like conditions with IL‐21 and 3T3‐CD40L cells, and with or without IFNγ for 11 days. Representative FACS plots and quantification of in vitro–induced T‐bet+ B cells (G) and correlation of CXCR3 and T‐bet expression in these cultured B cells (H) are shown. Data are presented as the mean ± standard error of the mean. *p < 0.05, **p < 0.01, ***p < 0.001, ****p < 0.0001. The p values were calculated by 2‐way analysis of variance (ANOVA; C), 1‐way ANOVA (D, E), and Wilcoxon matched‐pairs signed rank (G) tests. The correlation coefficients and p values for A, F, H were calculated by Spearman rank. m = months; MFI = mean fluorescence intensity; TCR = T‐cell receptor.
Figure 5
Figure 5
Interferon‐γ (IFNγ) induces plasmablast differentiation, whereas both IFNγ and CpG‐DNA further upregulate T‐bet and trigger IgG1 switching in B cells of multiple sclerosis (MS) patients. (A–D) Naive (IgGCD27; dots) and memory (IgG+CD27+; squares) B cells were sorted from peripheral blood of healthy donors and were cultured under T follicular helper (Tfh)‐like conditions with IL‐21 and 3T3‐CD40L cells, with or without IFNγ and/or CpG‐DNA. Frequencies of T‐bet+ and CXCR3+ B cells after 11 days of culture using (A) naive B cells (n = 12) and 6 days of culture using (B) memory B cells (n = 10–12) are shown. The frequencies of (C) plasmablasts (CD38highCD27+; n = 12) and (D) membrane‐bound (m) mIgG1+ and mIgG2+ B cells were analyzed after culturing naive populations for 11 days (n = 12). (E) Correlation between cellular expression and secretion of IgG1 was determined by FACS and enzyme‐linked immunosorbent assay (pooled stimulation conditions for 5 donors). (F–H) Naive B cells from the blood of MS patients (n = 6; dark blue dots) and healthy controls (HC; n = 6; gray dots) were cultured under the same Tfh‐like conditions and analyzed for (F) plasmablast (CD38highCD27+) and (G, H) CXCR3+mIgG1+ and CXCR3+mIgG2+ B‐cell differentiation after 11 days of culture. Data are presented as the mean ± standard error of the mean. *p < 0.05, **p < 0.01, ***p < 0.001. The p values for A–D and F–H were calculated by the Wilcoxon matched‐pairs signed rank test. The correlation coefficient and p value for E were calculated by Spearman rank correlation.
Figure 6
Figure 6
Interferon‐γ (IFNγ) and Toll‐like receptor 9 (TLR9) signaling upregulate T‐bet in peripheral B cells, likely driving CXCR3‐mediated recruitment and IgG1 production in the central nervous system of multiple sclerosis (MS) patients. Our findings suggest that in the secondary lymphoid organs of MS patients, IFNγ triggers naive B cells to differentiate into T‐bet–expressing populations in a T follicular helper (Tfh)‐dependent manner. Human T‐bet+ B cells can either develop into plasmablasts or undergo further differentiation into IgG1+ memory B cells mediated by TLR9 ligation. The enhanced CXCR3 expression on both IFNγ‐ and TLR9‐induced IgG1+ B cells makes these subsets highly capable of transmigrating across the blood–brain barrier and mediate local pathology in MS. TCR = T‐cell receptor.

References

    1. Farh KKH, Marson A, Zhu J, et al. Genetic and epigenetic fine‐mapping of causal autoimmune disease variants. Nature 2015;518:337–343. - PMC - PubMed
    1. von Büdingen HC, Kuo TC, Sirota M, et al. B cell exchange across the blood‐brain barrier in multiple sclerosis. J Clin Invest 2012;122:4533–4543. - PMC - PubMed
    1. Eggers EL, Michel BA, Wu H, et al. Clonal relationships of CSF B cells in treatment‐naive multiple sclerosis patients. JCI Insight 2017;2(22). - PMC - PubMed
    1. Greenfield AL, Dandekar R, Ramesh A, et al. Longitudinally persistent cerebrospinal fluid B cells can resist treatment in multiple sclerosis. JCI Insight 2019;4(6). - PMC - PubMed
    1. Stern JNH, Yaari G, Vander Heiden JA, et al. B cells populating the multiple sclerosis brain mature in the draining cervical lymph nodes. Sci Transl Med 2014;6:107. - PMC - PubMed

Publication types