. 2019 Sep;34(9):1315-1324.
doi: 10.1002/mds.27728. Epub 2019 May 28.

Parafoveal thinning of inner retina is associated with visual dysfunction in Lewy body diseases

Affiliations

Parafoveal thinning of inner retina is associated with visual dysfunction in Lewy body diseases

Ane Murueta-Goyena et al. Mov Disord. 2019 Sep.

Abstract

Background: Retinal optical coherence tomography findings in Lewy body diseases and their implications for visual outcomes remain controversial. We investigated whether region-specific thickness analysis of retinal layers could improve the detection of macular atrophy and unravel its association with visual disability in Parkinson's disease.

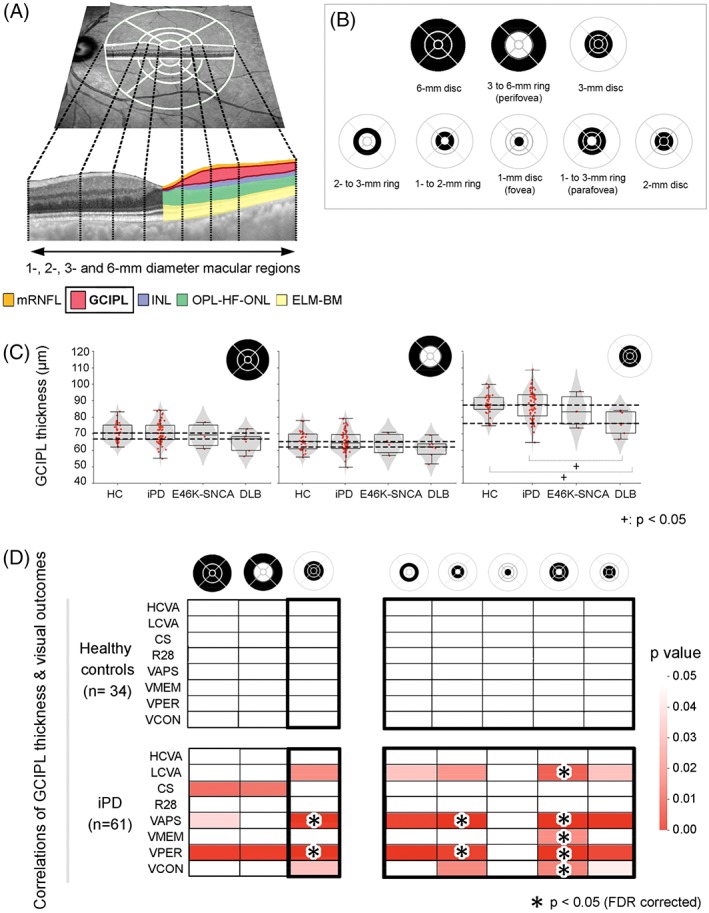
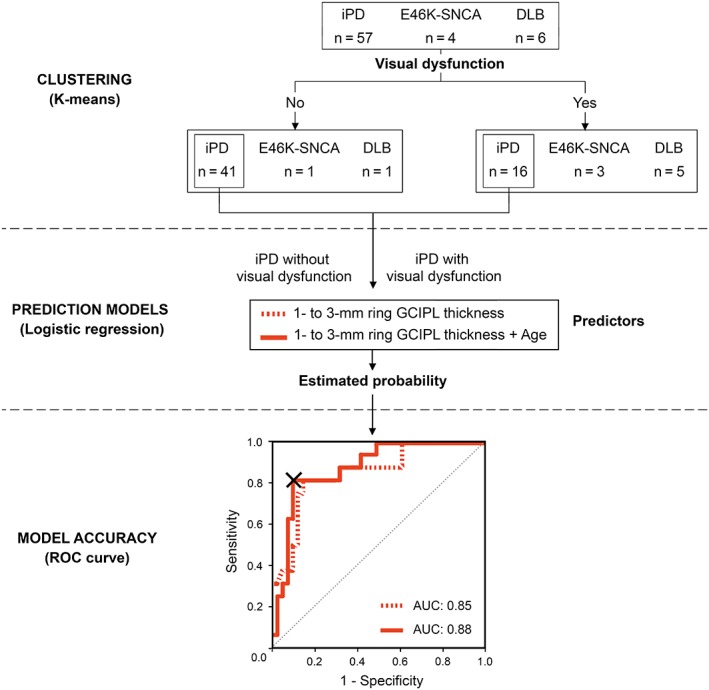
Methods: Patients with idiopathic Parkinson's disease (n = 63), dementia with Lewy bodies (n = 8), and E46K mutation carriers in the α-synuclein gene (E46K-SNCA) (n = 4) and 34 controls underwent Spectralis optical coherence tomography macular scans and a comprehensive battery of visual function and cognition tests. We computed mean retinal layer thicknesses of both eyes within 1-, 2-, 3-, and 6-mm diameter macular discs and in concentric parafoveal (1- to 2-mm, 2- to 3-mm, 1- to 3-mm) and perifoveal (3- to 6-mm) rings. Group differences in imaging parameters and their relationship with visual outcomes were analyzed. A multivariate logistic model was developed to predict visual impairment from optical coherence tomography measurements in Parkinson's disease, and cutoff values were determined with receiver operating characteristic analysis.

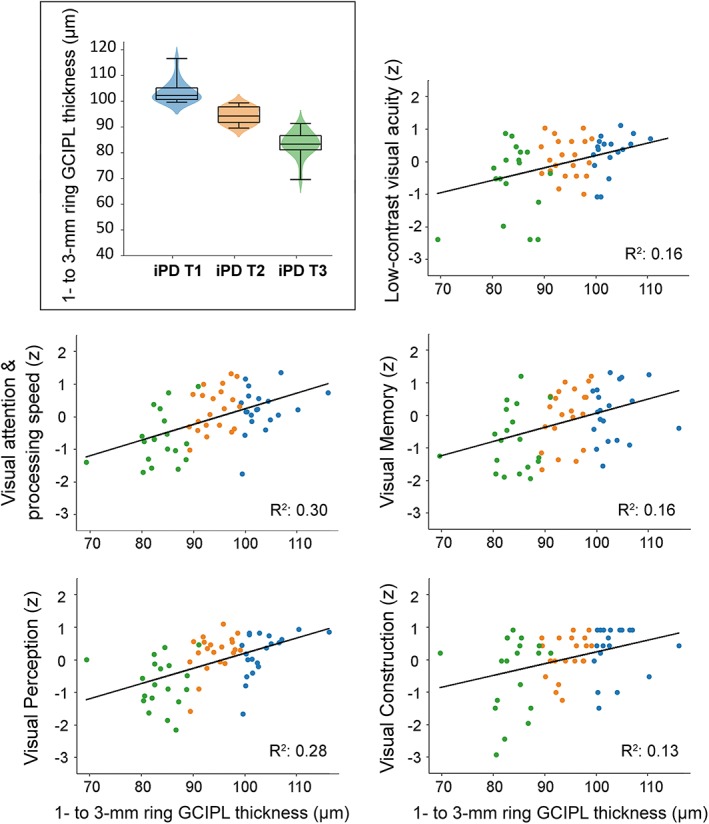
Results: When compared with controls, patients with dementia with Lewy bodies had significant thinning of the ganglion cell-inner plexiform layer complex within the central 3-mm disc mainly because of differences in 1- to 3-mm parafoveal thickness. This parameter was strongly correlated in patients, but not in controls, with low contrast visual acuity and visual cognition outcomes (P < .05, False Discovery Rate), achieving 88% of accuracy in predicting visual impairment in Parkinson's disease.

Conclusion: Our findings support that parafoveal thinning of ganglion cell-inner plexiform complex is a sensitive and clinically relevant imaging biomarker for Lewy body diseases, specifically for Parkinson's disease. © 2019 The Authors. Movement Disorders published by Wiley Periodicals, Inc. on behalf of International Parkinson and Movement Disorder Society.

Keywords: Parkinson's disease; dementia with Lewy bodies; macula; optical coherence tomography; visual dysfunction.


Figures

Figure 1
Figure 1
(A) A funduscopic image with superimposed foveola‐centered 1‐, 3‐, 6‐mm diameter and 1‐, 2‐, 3‐mm diameter Early Treatment Diabetic Retinopathy Study (ETDRS) grids provided by the Spectralis optical coherence tomography (OCT) (above). Dotted lines delimitate foveal, parafoveal, and perifoveal boundaries in a transversal macular OCT section (below), in which colors represent the set of macular layers and/or layer complexes analyzed for the present study. (B) Macular regions used for calculating mean layer thicknesses of both eyes. (C) Combined violin‐ and box‐plots with individual data points of each diagnostic group for the distribution of mean GCIPL thicknesses of 6‐mm disc (left), 3‐ to 6‐mm ring (middle), and 3‐mm disc (right). Dashed lines indicate highest and lowest median GCIPL thickness values for all groups within each plot. (D) Age‐adjusted partial correlations between mean GCIPL thicknesses in different macular regions and visual outcomes in control participants (above) and iPD patients (below). Only macular parameters that were statistically significant (P < .05) in partial correlations are shown in color. Asterisks represent correlations that remained statistically significant after False Discovery Rate (FDR) adjustment of P values for multiple comparisons. CS, contrast sensitivity; DLB, dementia with Lewy bodies; E46K‐SNCA, carriers of E46K mutation in α‐synuclein gene; ELM‐BM, the complex including external limiting membrane, ellipsoid band, retinal pigment epithelium and Bruch membrane; GCIPL, ganglion cell–inner plexiform layer complex; HC, healthy controls; HCVA, high‐contrast visual acuity; INL, inner nuclear layer; iPD, idiopathic Parkinson's disease; LCVA, low‐contrast visual acuity; mRNFL, macular retinal nerve fiber layer; OPL‐HF‐ONL, outer plexiform–Henle fiber–outer nuclear layer complex; R28, Roth 28 hue test; VAPS, visual attention and processing speed composite; VCON, visual construction composite; VMEM, visual memory composite; VPER, visual perception composite; FDR, False Discovery Rate. [Color figure can be viewed at http://wileyonlinelibrary.com]
Figure 2
Figure 2
Scatterplots representing the relationship between 1‐ to 3‐mm mean GCIPL thickness and visual outcomes in iPD patients. Individual dots of scatter plots have been color‐coded according to iPD tertiles obtained from 1‐ to 3‐mm mean GCIPL thickness distribution: blue for upper tertile (T1), orange for middle tertile (T2) and green for lower tertile (T3). A combined violin‐ and box‐plot for 1‐ to 3‐mm mean GCIPL thickness distribution displaying iPD tertiles is shown in the upper left corner. Visual outcomes are provided in z‐scores. R 2 represents the proportion of the variance explained for each individual visual outcome by GCIPL thickness. Only False Discovery Rate (FDR)‐adjusted significant correlations are plotted. GCIPL, ganglion cell–inner plexiform layer complex; iPD, idiopathic Parkinson's disease. [Color figure can be viewed at http://wileyonlinelibrary.com]
Figure 3
Figure 3
Upper panel, visual function–based clustering of patients. Middle panel, logistic regression analysis to assess the predictive ability of 1‐ to 3‐mm GCIPL thickness in differentiating iPD patients with visual dysfunction from visually unaffected iPD patients as a single predictor (dashed red line) or in combination with age (continuous red line). Lower panel, receiver operating characteristic (ROC) curve. Estimated probabilities resulting from logistic regression were used as classifiers. The “X” inside the ROC curve indicates the cutoff point of multivariate analysis that corresponds to an estimated probability of 0.44. The individual probability can be calculated using the following formula: P = 1 / [1 + e^(−4.98 + 0.15·[parafoveal GCIPL thickness] − 0.13·(age)]. Patients with probabilities above the cutoff value are considered to have visual dysfunction. AUC, area under the curve; DLB, dementia with Lewy bodies; E46K‐SNCA, carriers of E46K mutation in α‐synuclein gene; GCIPL, ganglion cell–inner plexiform layer complex; iPD, idiopathic Parkinson's disease. [Color figure can be viewed at http://wileyonlinelibrary.com]

Comment in

References

    1. Zarranz JJ, Alegre J, Gomez‐Esteban JC, et al. The new mutation, E46K, of alpha‐synuclein causes Parkinson and Lewy body dementia. Ann Neurol 2004;55(2):164‐173. - PubMed
    1. Inigo‐Marco I, Valencia M, Larrea L, et al. E46K alpha‐synuclein pathological mutation causes cell‐autonomous toxicity without altering protein turnover or aggregation. Proc Natl Acad Sci U S A 2017;114(39):E8274‐E8283. - PMC - PubMed
    1. Schapira AHV, Chaudhuri KR, Jenner P. Non‐motor features of Parkinson disease. Nat Rev Neurosci 2017;18(7):435‐450. - PubMed
    1. Armstrong RA. Visual dysfunction in Parkinson's disease. Int Rev Neurobiol 2017;134:921‐946. - PubMed
    1. Williams‐Gray CH, Foltynie T, Brayne CE, Robbins TW, Barker RA. Evolution of cognitive dysfunction in an incident Parkinson's disease cohort. Brain 2007;130(Pt 7):1787‐1798. - PubMed

Publication types

MeSH terms