. 2019 Oct;50(7):3164-3180.
doi: 10.1111/ejn.14477. Epub 2019 Jun 17.

Involvement of rat posterior prelimbic and cingulate area 2 in vocalization control

Affiliations

Involvement of rat posterior prelimbic and cingulate area 2 in vocalization control

Peter Julian Garnett Bennett et al. Eur J Neurosci. 2019 Oct.

Abstract

Microstimulation mapping identified vocalization areas in primate anterior cingulate cortex. Rat anterior cingulate and medial prefrontal areas have also been intensely investigated, but we do not know, how these cortical areas contribute to vocalizations and no systematic mapping of stimulation-evoked vocalizations has been performed. To address this question, we mapped microstimulation-evoked (ultrasonic) vocalizations in rat cingulate and medial prefrontal cortex. The incidence of evoked vocalizations differed markedly between frontal cortical areas. Vocalizations were most often evoked in posterior prelimbic cortex and cingulate area 2, whereas vocalizations were rarely evoked in dorsal areas (vibrissa motor cortex, secondary motor cortex and cingulate area 1) and anterior areas (anterior prelimbic, medial-/ventral-orbital cortex). Vocalizations were observed at intermediate frequencies in ventro-medial areas (infralimbic and dorsopeduncular cortex). Various complete, naturally occurring calls could be elicited. In prelimbic cortex superficial layer microstimulation evoked mainly fear calls with low efficacy, whereas deep layer microstimulation evoked mainly 50 kHz calls with high efficacy. Vocalization stimulation thresholds were substantial (70-500 μA, the maximum tested; on average ~400 μA) and latencies were long (median 175 ms). Posterior prelimbic cortex projected to numerous targets and innervated brainstem vocalization centers such as the intermediate reticular formation and the nucleus retroambiguus disynaptically via the periaqueductal gray. Anatomical position, stimulation effects and projection targets of posterior prelimbic cortex were similar to that of monkey anterior cingulate vocalization cortex. Our data suggest that posterior prelimbic cortex is more closely involved in control of vocalization initiation than in specifying acoustic details of vocalizations.

Keywords: USVs; microstimulation; periaqueductal gray; prefrontal cortex; transsynaptic tracing.


Conflict of interest statement

The authors declare no competing financial interests.

Figures

Figure 1
Figure 1
Ultrasonic vocalizations evoked in a microstimulation penetration through rat frontal cortex. (a) Histological example of an electrode track and lesion in a cytochrome c oxidase‐stained section cut in the coronal plane. (b) Schematic showing cortical areas along the path of the stimulation electrode. The gray line indicates the electrode track, whereas the gray circle indicates an electrolytic lesion. Microstimulations at sites marked by an x did not evoke vocalizations. Stimulations at sites marked by dots evoked vocalizations. The stimulation threshold and evoked call type are indicated for each individual site. Abbreviations: M1, primary motor cortex; M2, secondary motor cortex; Cg1, primary cingulate cortex; PrL, prelimbic cortex; InL, infralimbic cortex; DPC, dorsopeduncular cortex. (c) Top: Spectrogram of an example frequency‐modulated 50 kHz vocalization, evoked by microstimulation in dorsal prelimbic cortex. Bottom: Spectrogram of an example frequency‐modulated 50 kHz vocalization, comprising two components (~70 kHz & ~40 kHz), evoked by microstimulation in dorsal prelimbic cortex. (d) Top: Spectrogram of an example fear vocalization (or 22 kHz vocalization) including an initial frequency‐modulated component and several harmonic components, evoked by microstimulation in ventral prelimbic cortex. Bottom: Spectrogram of an example fear vocalization (or 22 kHz vocalization) including several harmonic components, evoked by microstimulation in ventral prelimbic cortex. Note the different time scale. (e) Plot showing onset latencies for 50 kHz vocalizations upon microstimulations in prelimbic cortex across 10 trials. Line plots are aligned to stimulation onsets as indicated in C. Red dashed line indicates median latency at 67 ms. (f) Plot showing onset latencies for fear vocalizations upon microstimulations in prelimbic cortex across ten trials. Red‐dashed line indicates median latency at 137 ms. Line plots are aligned to stimulation onsets as indicated in D. Gray lines indicate trials that did not evoke vocalizations. [Colour figure can be viewed at http://wileyonlinelibrary.com]
Figure 2
Figure 2
Areal distribution of microstimulation‐evoked vocalizations evoked in rat frontal cortex. (a) microstimulation map of evoked vocalizations in the frontal cortex of a rat. Nonresponsive sites (x) and vocalization evoking sites (black dots) were studied in seven tracks and after histological verification were superimposed on a parasagittal section with color‐coded cortical areas. For all tracks, the stimulation electrode was inserted 0.75 mm lateral from bregma. Most but not all vocalization evoking sites fall into the prelimbic (PrL) and cingulate area 2 (Cg2) areas. Other abbreviations: cingulate area 1 (Cg1); secondary motor cortex M2; vibrissa motor cortex (VMC); medial‐orbital area (MO); ventral‐orbital area (VO), infralimbic cortex (IL); dorsopenducular cortex (DP). The areal boundaries were drawn according to Paxinos & Watson, 1986 and Brecht et al., 2004. (b) left, average map vocalization responsiveness superimposed on a parasagittal section (= 4 animals). Right, outline of cortical area boundaries for reference. The dashed line indicates an alternative portioning scheme, that is, a split of the prelimbic area split into an anterior portion (antPrL) and a posterior portion (postPrL). When superimposing stimulation tracks on an average maps, we adjusted for histologically correct rostro‐caudal coordinates. We also factored in that in the 1 mm stimulation electrodes did only travel about 0.5 mm due to dimpling; hence we aligned tracks at +0.5 mm relative to the cortical surface. Conventions as in (a). (c) areal distribution of nonresponsive and vocalization evoking sites (expressed as fraction of vocalization evoking sites) across areas of frontal cortex. The numbers on top of the columns refer to the number of vocalization evoking sites and total number of histologically assigned sites, respectively. Data refer to four animals in which in total 261 sites were tested. The value from the Chi‐squared test was >43.3, < 0.00001. We also compared the distribution of nonresponsive and vocalization evoking sites between prelimbic cortex (the area with the largest fraction of vocalization sites) and the other cortical areas with Fisher's exact test and found significant differences to four of the seven areas (**< 0.001; *< 0.05). Abbreviations as in (a), MO/VO pooled data from medial‐orbital and ventral‐orbital cortex. (d) areal distribution of nonresponsive and vocalization evoking sites with a split prelimbic area as indicated by the dashed line in right hand schematic in (b). The numbers on top of the columns refer to the number of vocalization‐evoking sites and total number of histologically assigned sites, respectively. Data refer to four animals in which in total 261 sites were tested. The value from the Chi‐squared test was >51.3, < 0.00001. We also compared pairwise the distribution of nonresponsive and vocalization evoking sites between prelimbic cortex (the area with the largest fraction of vocalization sites) and the other cortical areas with Fishers exact test and found significant differences to four of the seven areas (**< 0.001; *< 0.05). [Colour figure can be viewed at http://wileyonlinelibrary.com]
Figure 3
Figure 3
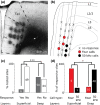
Both microstimulation efficacy and evoked call types differ between superficial and deep layers of prelimbic cortex. (a) Histological example of multiple tracks and microstimulation sites in the prelimbic cortex of a coronal section. (b) Schematic of the micrograph shown in (a) depicting all four tracks (gray) and all 24 microstimulation sites in relation to the different layers (calls on the border between L2/3 and 5 were always assigned to superficial layers). The circles indicate responsive sites and nonresponsive sites are marked with an x. Note that in this example most responsive sites (4/6) were found in deep layers and most of them evoked 50 kHz calls (3/4, black circles) but that sites in superficial layers exclusively (2/2, red circles) evoked fear calls. (c) Responsiveness population data of experiments designed for laminar analysis in the prelimbic cortex (three rats, 72 sites) pooled with prelimbic cortex data that are shown in Figure 2c (four rats, 77 sites; layers were post‐hoc assigned, two sites were excluded because layer assignment was not possible). Left, bar graphs show the fraction of responsive (gray bars) and nonresponsive (white bars) sites relative to the total number of sites tested within that layer. The numbers in the bar graphs indicate the absolute numbers of responsive and nonresponsive sites. Right, same as left but for deep layers. Note that it was much more likely to evoke calls in deep layers than in superficial layers (***< 0.0001, Fishers exact test). (d) Call type population data of evoked call types of experiments designed for laminar analysis in prelimbic cortex (three rats, 17 responsive sites, mixed calls were excluded) pooled with prelimbic cortex data that are shown in Figure 2c (4 rats, 39 responsive sites, layers were post‐hoc assigned). Left, bar graphs show the fraction of sites that evoked fear and 50 kHz calls relative to the total number of responsive sites within that layer. The numbers in the bar graphs indicate the absolute numbers of sites that evoked fear or 50 kHz calls, respectively. Right, same as left but for deep layers. Note that microstimulation in deep layers by and large evoked 50 kHz calls. In contrast, almost exclusively fear calls were evoked at the few responsive sites in superficial layers, indicating that the types of evoked calls are different between superficial and deep layers (*< 0.05, Fishers exact test). [Colour figure can be viewed at http://wileyonlinelibrary.com]
Figure 4
Figure 4
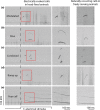
Comparison of electrically evoked (left) and naturally occurring (right) USVs. (a) Left, microstimulation‐evoked modulated calls are within the 50–60 kHz range and show strong rippled frequency modulation during the rising phase of the call. Middle, high‐time resolution spectrogram of the same call. Right, a similar call observed during natural play behavior. (b) Left, microstimulation‐evoked bow call: This call has a rising and a falling phase but it is not frequency‐modulated as shown in A. Middle, high‐time resolution spectrogram of the same call. Right, a similar bow call observed during natural play behavior. (c) Left, microstimulation‐evoked combined call typically showing two components: A first 50–60 kHz call, immediately followed by a 45 kHz call with its 90 kHz harmonic. Middle, high‐time resolution spectrogram of the same call. Right, a similar combined call observed during natural play behavior. (d) Left, microstimulation‐evoked ramp up call, characterized by a rising phase but without falling phase. Middle, high‐time resolution spectrogram of the same call. Right, a similar call observed during natural play behavior. (e) Left, microstimulation‐evoked fear call. These calls are long, continuous USVs in the 22 kHz range with multiple harmonics. They start at about 30 kHz and approach 22 kHz with time as shown in electrically induced and natural fearful conditions. Middle, high‐time resolution spectrogram of the initial parts of the same call. Right, a similar call emitted by a fearful animal. [Colour figure can be viewed at http://wileyonlinelibrary.com]
Figure 5
Figure 5
Vocalization thresholds, vocalization latencies, call types and response types. (a) distribution of stimulation thresholds for evoking vocalizations. Note that these data refer only to the subset of stimulation sites, at which calls were evoked. There were no significant differences in thresholds between different areas and we therefore pooled all data (ANOVA, f‐ratio = 0.10777; = 0.955164, 62 sites, four animals). There were only few <100 μA threshold sites. (b) latencies of all stimulation‐evoked vocalizations. Data are shown in 25 ms bins. Note the almost complete absence of < 25 ms latencies, and the small number of < 50 ms latencies. (c) evoked call types. Note that these data refer only to the subset of stimulation sites, at which calls were evoked. As fear call sites, we classified sites, where microstimulation evoked characteristic long and loud calls in the 20–30 kHz range; as 50 kHz calls sites we classified sites, where a diversity of calls in the 30–100 kHz range was evoked; as mixed sites we classified sites, where microstimulation evoked both types of calls. (d) on and off response patterns. Note that these data refer only to the subset of stimulation sites, at which calls were evoked. As on‐calls, we classified calls evoked during the 1 s stimulation train. As off‐calls we classified calls evoked in the first second after the end of the stimulation train
Figure 6
Figure 6
Projections of posterior prelimbic cortex revealed by anterograde tracing. (a) Injection site of the tracer biotinylated dextran amine (BDA; Molecular Weight: 10,000, a potent anterograde tracer) in posterior prelimbic cortex (PrL). The injection site is marked with a red star. The nucleus accumbens is a prominent projection target of prelimbic cortex and is revealed by dark axonal staining. (b) in a more posterior section anterograde labeling in cingulate area 2 (Cg2) and the striatum are visible. (c) Top, further posterior cortical labeling is seen in retrosplenial cortex (surrounded by a dashed box and shown enlarged at the bottom right micrograph. Labeling is also seen in the habenula, medial dorsal thalamus and the zona incerta/the dorsal hypothalamus (surrounded by a dashed box and shown enlarged at the bottom left micrograph). (d) Top, midbrain section with labeling in the periaqueductal gray (dashed box). Bottom, enlarged view of labeled axons in the periaqueductal gray. [Colour figure can be viewed at http://wileyonlinelibrary.com]
Figure 7
Figure 7
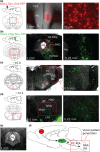
Anterograde transsynaptic viral tracing reveals a prelimbic cortex—periaqueductal gray—brainstem vocalization centers circuit. (a) Prelimbic (PrL) injection site of the AAV1.Syn.iCre.RFP used for anterograde transsynaptic tracing. Left, parasagittal and coronal scheme of the AAV1.Syn.iCre.RFP injection at + 3 mm from Bregma. Middle, micrograph of the AAV1.Syn.iCre.RFP injection site in the PrL showing Cre‐expressing cells (red). Cg1, cingulate cortex, area 1; PrL, prelimbic cortex; IL, infralimbic cortex. Right, magnification of micrograph shown in the middle panel (the picture was acquired as a stack image that was collapsed such that nuclei appear in one focal plane). Note that RFP expression is restricted to the putative nuclei (small, circumscribed spheres with a week halo) due to a nuclear translocation sequence—thereby no neuronal processes are visible. (b) Anatomical location of the periaqueductal (PAG). Left, parasagittal and coronal scheme of the Cre‐dependent AAV1.CAG.flex.GFP injection at −7.8 mm from Bregma. Middle, micrograph of the AAV1.CAG.flex.GFP injection site in the PAG showing Cre‐dependent GFP‐expressing neurons (green) that receive input from PrL. DLPAG, dorsolateral periaqueductal gray; LPAG, lateral periaqueductal gray; VLPAG, ventrolateral periaqueductal gray; Aq, aqueduct. Right, magnification of micrograph shown in the middle panel. Cytosolic GFP expression allows visualization of axons and dendrites. Note that presynaptic terminals from prelimbic neurons are not visible because the presynaptic reporter (red fluorescent protein) is restricted to the nucleus. (c) Anatomical location at the rostral brainstem level. Left, parasagittal and coronal scheme of the section shown in the middle and right panel at −10 mm from Bregma. Middle, micrograph showing green fluorescent fibers in the PC‐RtA (parvocellular reticular formation, alpha part). Pr5VL, principal sensory trigeminal nucleus, ventrolateral part; 7n, facial nerve; 4v, fourth ventricle. Right, magnification of micrograph shown in the middle panel. Note that Green fibers are localized at the dorsal part of the PC‐RtA. (d) Anatomical location at the caudal brainstem level. Left, parasagittal and coronal scheme of the section shown in the middle and right panel at −14.2 mm from Bregma. Middle, micrograph showing green fluorescent fibers in the NRA and the surrounding reticular formation. NRA, nucleus retroambiguus; IRT, intermediate reticular nucleus; MdD, medullary reticular nucleus, dorsal part; MdV, medullary reticular nucleus, ventral part; LRt, lateral reticular nucleus. Right, magnification of micrograph shown in the middle panel. Note the diffuse spread of green fluorescent fibers within the NRA and the surrounding reticular formation. (e) Control AAV1.CAG.flex.GFP injection in the periaqueductal gray without AAV1.Syn.iCre.RFP injection in the prelimbic cortex. Note the absence of green fluorescent cells, indicating that the Cre‐dependent (flex) virus only leads to GFP expression when Cre‐recombinase is expressed. (f) Possible prefrontal cortex to brainstem circuit for vocalization production. The periaqueductal gray (PAG) receives input from the PrL and conveys that information to the brainstem vocal pattern generator nuclei (PC‐RtA and NRA/Rt). PC‐RtA, parvocellular reticular formation, alpha part; NRA, nucleus retroambiguus; Rt, reticular formation. [Colour figure can be viewed at http://wileyonlinelibrary.com]

References

    1. Aitken, P. G. (1981). Cortical control of conditioned and spontaneous vocal behavior in rhesus monkeys. Brain and Language, 13(1), 171–184. - PubMed
    1. Arriaga, G. , Zhou, E. P. , & Jarvis, E. D. (2012). Of mice, birds, and men: The mouse ultrasonic song system has some features similar to humans and song‐learning birds. PLoS ONE, 7(10), e46610. - PMC - PubMed
    1. Brecht, M. , Krauss, A. , Muhammad, S. , Sinai‐Esfahani, L. , Bellanca, S. , & Margrie, T. W. (2004). Organization of rat vibrissa motor cortex and adjacent areas according to cytoarchitectonics, microstimulation, and intracellular stimulation of identified cells. The Journal of Comparative Neurology, 479(4), 360–373. - PubMed
    1. Brecht, M. , & Sakmann, B. (2002). Dynamic representation of whisker deflection by synaptic potentials in spiny stellate and pyramidal cells in the barrels and septa of layer 4 rat somatosensory cortex. Journal of Physiology, 543(Pt 1), 49–70. - PMC - PubMed
    1. Burgdorf, J. , Wood, P. L. , Kroes, R. A. , Moskal, J. R. , & Panksepp, J. (2007). Neurobiology of 50‐kHz ultrasonic vocalizations in rats: Electrode mapping, lesion, and pharmacology studies. Behavioral Brain Research, 182(2), 274–283. - PubMed

Publication types