. 2019 Sep;112(3):785-799.
doi: 10.1111/mmi.14316. Epub 2019 Jun 11.

Division plane placement in pleomorphic archaea is dynamically coupled to cell shape

Affiliations

Division plane placement in pleomorphic archaea is dynamically coupled to cell shape

James C Walsh et al. Mol Microbiol. 2019 Sep.

Abstract

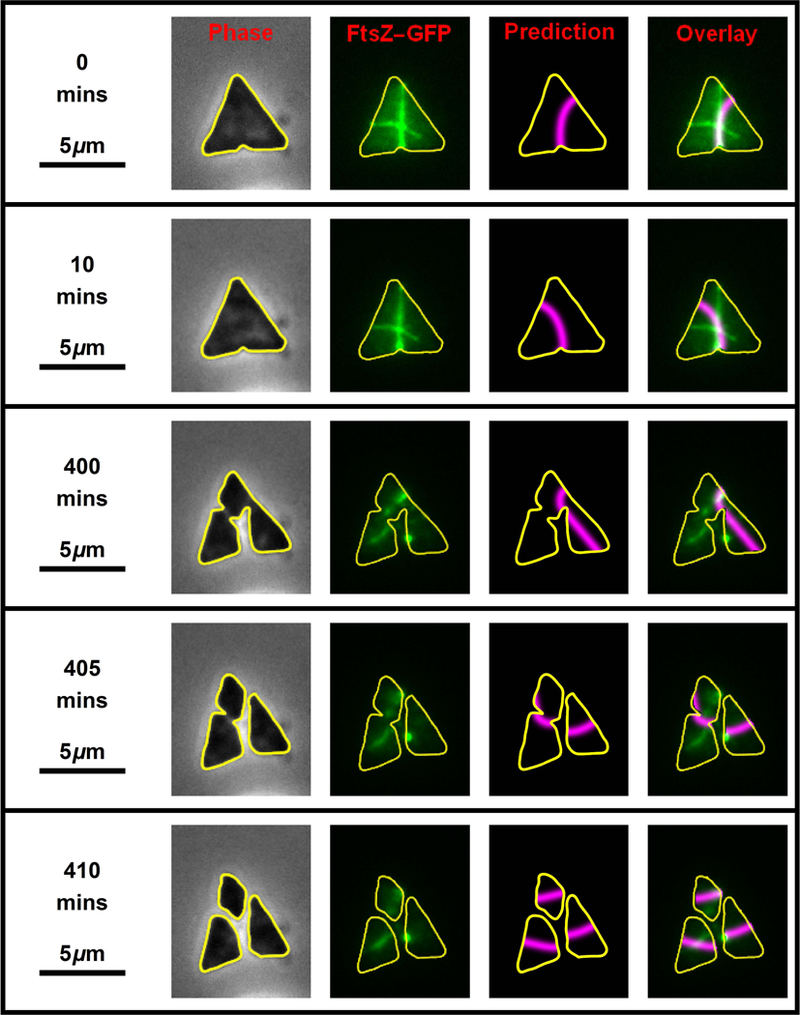
One mechanism for achieving accurate placement of the cell division machinery is via Turing patterns, where nonlinear molecular interactions spontaneously produce spatiotemporal concentration gradients. The resulting patterns are dictated by cell shape. For example, the Min system of Escherichia coli shows spatiotemporal oscillation between cell poles, leaving a mid-cell zone for division. The universality of pattern-forming mechanisms in divisome placement is currently unclear. We examined the location of the division plane in two pleomorphic archaea, Haloferax volcanii and Haloarcula japonica, and showed that it correlates with the predictions of Turing patterning. Time-lapse analysis of H. volcanii shows that divisome locations after successive rounds of division are dynamically determined by daughter cell shape. For H. volcanii, we show that the location of DNA does not influence division plane location, ruling out nucleoid occlusion. Triangular cells provide a stringent test for Turing patterning, where there is a bifurcation in division plane orientation. For the two archaea examined, most triangular cells divide as predicted by a Turing mechanism; however, in some cases multiple division planes are observed resulting in cells dividing into three viable progeny. Our results suggest that the division site placement is consistent with a Turing patterning system in these archaea.


Figures

Fig. 1.
Fig. 1.. An example of division plane prediction.
(A) A sample phase-contrast image of H. volcanii (H98 + pIDJL40-FtsZ1) overlaid with the cell shape outlines generated by automated image analysis. Numbers adjacent to each cell correspond to the aspect ratio of the outline: the closer the value is to 1 the higher the degree of rotational (>2-fold) symmetry (for example a circle, equilateral triangle or square). Conversely, the lower the value, the closer the cell outline resembles a one-dimensional line. Outlines are color coded to reflect this aspect ratio, with quasi-circular cells (> 0.9) in red– moderately elongated cells (0.65–0.9) in yellow and elongated cells (<0.75) in blue. (B) The corresponding FtsZ1-GFP fluorescence image showing the future division plane orientation of each cell. This image has been overlaid with the cell outlines calculated using the phase-contrast image shown in (A) with the same aspect ratio color coding. (C) Theoretically calculated predictions for the division plane in each cell. These are given by the nodal line of the lowest harmonic of the cell outlines from (A) which are overlaid with the same aspect ratio color coding. The panel is shown on a black background to match the positions of the actual cells. (D) A false colored overlay of (B) and (C), the experimental FtsZ1-GFP distribution is show in green, the predicted division plane distribution in magenta. The intersection of the two creates white. Numbers adjacent to each cell correspond to the cross-correlation between experimental and predicted division plane distributions. Identical distributions would have a value of one while uncorrelated distributions would have a value of zero.
Fig. 2.
Fig. 2.. Analysis of division plane prediction.
(A) The division ring width as measured by selecting for elongated cells and fitting a Gaussian to the profile along the major axis of the cells. This histogram shows all of the standard deviations for the best fit Gaussian of each cell. (B) Surface plots for a typical cell isolated from Fig. 1 are shown below each of the respective microscopy images used to generate them. Top left is the phase-contrast image, bottom left shows the resulting theoretically predicted division plane distribution for the FtsZ1 in the cell. The right-hand column shows the FtsZ1-GFP fluorescence distribution as an image (top) and surface plot representation (bottom). (C) Scatter plot with point density (color scale on right) showing the cross-correlation between the predicted division plane and the experimental FtsZ1-GFP distribution as a function of cell aspect ratio for 22,217 analyzed cells of H. volcanii (H98 + pIDJL40-FtsZ1). (D) The mean cross-correlation between the predicted and observed division plane orientation for wild type cells (solid blue line) as a function of aspect ratio. The light blue line shows the mean cross-correlation between randomly rotated division planes and the FtsZ-GFP distribution. The green line shows the mean cross-correlation between a randomly offset division plane and the FtsZ-GFP distribution.(E) Scatter plot with point density (color scale on right) showing the cross-correlation between the predicted division plane and the experimental FtsZ1 distribution for cetZ1 gene deletion strain. (F) The mean cross-correlation for predictions using the cetZ1 gene deletion strain (solid blue line) versus the wild type strain (dashed blue line) as a function of aspect ratio. The frequency (probability density) of cells as a function of aspect ratio is shown for wild type cells (dashed pink line) and cetZ1 gene deletion strain (solid pink line).
Fig. 3.
Fig. 3.. Experimental cell division orientation in triangular H. volcanii cells.
An array showing the division plane orientation in the cells of the CetZ1 knockout of H. volcanii (ID59 + pIDJL40-FtsZ1) that have formed triangular shapes. The left-hand number of each panel is the aspect ratio of the cell outline, while the right-hand number is the resulting cross-correlation between prediction and observation. The left most image is the phase-contrast micrograph, the middle image is the experimental FtsZ1 fluorescence distribution and the right most image is the predicted division plane. The cells have been ordered by the cross-correlation between the predicted and observed division.
Fig. 4.
Fig. 4.. Two rounds of cell division.
Four still frames (one per row) from the time-lapse movie (Movie S1) showing two consecutive rounds of H. volcanii (H98 + pIDJL40-FtsZ1) cell division. The left-hand images show the phase-contrast micrographs which were used to automatically generate cell outline (shown in yellow). The second column of images shows the FtsZ1 fluorescence with the cell outline superposed (yellow). The third column of images shows the predicted division planes (magenta lines) based on the cell shape. The far right column of images are the overlay of the FtsZ1 fluorescence and the predicted division plane. The first round of cell division (top two rows) correspond to movie frames 17 and 19, while the second round of cell division (bottom two rows) correspond to movie frames 36 and 43. Successive frames are separated by 10 minutes.
Fig. 5.
Fig. 5.. Time-lapse of a dividing equilateral triangular-shaped cell.
Key frames from the time-lapse of an H. volcanii (H26 + pIDJL40-FtsZ1) cell that is dividing, as shown in Movie S2. The left-hand column shows the phase-contrast image, the second image shows the fluorescent signal superimposed with the cell outline in yellow. The third column shows the predicted division plane and the far right column shows the overlay of the FtsZ1 fluorescence on the predicted plane.

References

    1. Addi C, Bai J, and Echard A (2018) Actin, microtubule, septin and ESCRT filament remodeling during late steps of cytokinesis. Curr Opin Cell Biol 50: 27–34. - PubMed
    1. Allers T, Barak S, Liddell S, Wardell K, and Mevarech M (2010) Improved strains and plasmid vectors for conditional overexpression of His-tagged proteins in Haloferax volcanii. Appl Environ Microbiol 76: 1759–1769. - PMC - PubMed
    1. Allers T, Ngo HP, Mevarech M, and Lloyd RG (2004) Development of additional selectable markers for the halophilic archaeon Haloferax volcanii based on the leuB and trpA genes. Appl Environ Microbiol 70: 943–953. - PMC - PubMed
    1. Antonny B (2011) Mechanisms of membrane curvature sensing. Annu Rev Biochem 80: 101–123. - PubMed
    1. Bailey MW, Bisicchia P, Warren BT, Sherratt DJ, and Mannik J (2014) Evidence for divisome localization mechanisms independent of the Min system and SlmA in Escherichia coli. PLoS Genet 10: e1004504. - PMC - PubMed

Publication types

Substances