. 2019 Aug;33(8):9453-9465.
doi: 10.1096/fj.201900166R. Epub 2019 May 28.

Chemopreventive efficacy of oral curcumin: a prodrug hypothesis

Affiliations

Chemopreventive efficacy of oral curcumin: a prodrug hypothesis

Garvey Liu et al. FASEB J. 2019 Aug.

Abstract

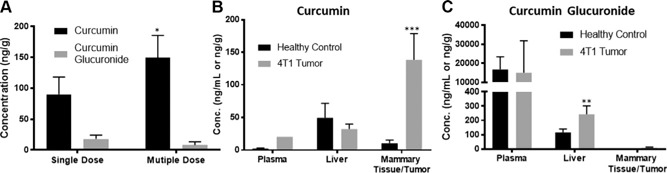
Oral consumption of curcumin, a natural polyphenol, is associated with reduced incidence of cancer. Yet, a significant amount of the orally dosed compound is eliminated in the feces, and a major fraction of the absorbed compound is metabolized to inactive glucuronides, resulting in poor bioavailability (<1%). It is not known how oral curcumin exhibits chemopreventive activity. We propose curcumin glucuronide is an inflammation-responsive natural prodrug that is converted back to curcumin on demand at the site of action. Our studies show elevated levels of β-glucuronidase, an enzyme that hydrolyzes the glycosidic bond of glucuronides to generate the parent compound, in human breast cancer. Oral administration of curcumin in mouse tumor models generated significant tumor levels of the polyphenol. Intravenous administration of the glucuronide resulted in the formation of curcumin in the tumor tissue. Chronic daily oral curcumin dosing led to tumor accumulation of curcumin and inhibition of tumor growth in tumor models with high β-glucuronidase activity. Overall, the study presented here provides preliminary evidence for a novel mechanism of action for orally administered curcumin.-Liu, G., Khanna, V., Kirtane, A., Grill, A., Panyam, J. Chemopreventive efficacy of oral curcumin: a prodrug hypothesis.

Keywords: cancer prevention; curcumin glucuronide; β-glucuronidase.


Figures

Figure 1
Figure 1
β‐Glucuronidase expression quantified in human breast tumors by IHC. A) Representative images of human breast tumor tissue stained for β‐glucuronidase (brown is indicative of positive staining). B) Quantitation of β‐glucuronidase levels (percent of core stained) according to breast cancer subtype in human tissue microarray sections. P < 0.05 overall; individual differences not statistically significant (1‐way ANOVA with multiple comparisons). C) Quantitation of β‐glucuronidase levels according to cancer stage. ER/PR, estrogen and progesterone receptor. Data shown are means ±sd. P < 0.05 overall, *P< 0.05 for normal vs. malignant (1‐way ANOVA with multiple comparisons).
Figure 2
Figure 2
β‐Glucuronidase expression quantified in mouse mammary tumors. A) Mammary tumor samples from different age groups of female transgenic Balb‐neuT mice were analyzed for β‐glucuronidase expression by Western blotting. B) Quantitation of the normalized expression determined by Western blotting. P < 0.05 overall; individual differences not statistically significant (1‐way ANOVA with multiple comparisons). C) Specific activity (nmol NP formed/h/mg protein) of β‐glucuronidase in HER‐2+ transgenic Balb‐neuT mammary tumor tissue and wild‐type (WT) Balb/c healthy mammary tissue. Data were analyzed using 2‐way ANOVA and multiple Student's t tests. D) Specific activity of β‐glucuronidase in 4 mammary tumor models. Statistical significance is based on comparison with the lowest value in each group. Data were analyzed using 2‐way ANOVA. E) Specific activity of β‐glucuronidase in lungs with 4T1 metastases and healthy lung. Data were analyzed using a Student's t test. All data shown are means ± sd; n = 3. *P < 0.05, **P < 0.01, ***P < 0.001, ****P < 0.0001.
Figure 3
Figure 3
β‐Glucuronidase expression quantified in vivo. A) In vivo imaging of β‐glucuronidase activity in MDA‐MB‐231‐LM2 tumor model (fluorescence from the tumor and liver are identified in the first image of the top panel). B) Quantitation of the fluorescence (mean area of fluorescence in total flux) in tumor from A. Data shown are means ± sd; n = 3.
Figure 4
Figure 4
Concentration‐time profiles of curcumin and its metabolite curcumin glucuronide following a single oral dose of curcumin SMEDDS formulation (100 mg/kg) as determined by LC‐MS/MS. Data are means ± sd (n = 3–4). Plasma concentrations for 4T1 tumor‐bearing mice (A), tumor concentrations for 4T1 tumor‐bearing mice (B), plasma concentrations for TuBo tumor‐bearing mice (C), and tumor concentrations for TuBo tumor‐bearing plasma (D).
Figure 5
Figure 5
Concentration‐time profiles of curcumin and its metabolite curcumin glucuronide following a single intravenous dose of curcumin glucuronide (2 mg/kg) as determined by LC‐MS. Data are means ± sd (n = 3–4/group/time point). Plasma concentrations for 4T1 tumor‐bearing mice (A), tumor concentrations for 4T1 tumor‐bearing mice (B), plasma concentrations for TuBo tumor‐bearing mice (C), and tumor concentrations for TuBo tumor‐bearing plasma (D).
Figure 6
Figure 6
A) Construction of pharmacokinetic model for prodrug hypothesis. B) Results of simulation based on varying CL e (1, 3, and 5 ml/min), CLmet (3–19 ml/min), and CLactivation (1–100 ml/min). CL12m, clearance of the metabolite form the central compartment to the target compartment; CL21m, clearance of the metabolite from the target compartment to the central compartment; CL12p, clearance of the parent drug from the central compartment to the target compartment; CL21p, clearance of the parent drug from the target compartment to the central compartment.
Figure 7
Figure 7
Mice bearing orthotopic 4T1 tumors received either a single dose or multiple doses of curcumin SMEDDS formulation daily at 100 mg/kg for 14 d prior to tissue and plasma collection. Data shown are means ± sd (n = 4–5). A) Accumulation of curcumin in the tumor tissue after single and multiple oral doses of curcumin. *P < 0.05 compared with curcumin concentrations after 1 single dose. B) Curcumin concentrations in plasma, tumors, and livers of healthy Balb/c mice and mice bearing orthotopic 4T1 tumors. ***P< 0.001 compared with curcumin concentrations in healthy mammary tissue. C) Curcumin glucuronide concentrations in plasma, tumors, and livers of healthy Balb/c mice and mice bearing orthotopic 4T1 tumors. Plasma concentrations are provided in ng/ml. All tissue concentrations are in ng/g. Conc., concentration. **P< 0.01 compared with liver concentrations in healthy animals.
Figure 8
Figure 8
Effect of oral curcumin dosing on tumor growth in MDA‐MB‐231 (A), 4T1 (B), JC (C), and TuBo (D) tumor models. Data shown are means ± se (2 way ANOVA with multiple comparisons). Values of P mentioned are based on statistical analysis of the last day of study between blank SMEDDS and curcumin SMEDDS. *P< 0.05, ****P< 0.0001.

References

    1. Prasad, K. , Mantha, S. V. , Kalra, J. , and Lee, P. (1997) Prevention of hypercholesterolemic atherosclerosis by garlic, an antioxidant. J. Cardiovasc. Pharmacol. Ther. 2, 309–320 - PubMed
    1. Kazemi‐Lomedasht, F. , Rami, A. , and Zarghami, N. (2013) Comparison of inhibitory effect of curcumin nanoparticles and free curcumin in human telomerase reverse transcriptase gene expression in breast cancer. Adv. Pharm. Bull. 3, 127–130 - PMC - PubMed
    1. Tomren, M. A. , Másson, M. , Loftsson, T. , and Tønnesen, H. H. (2007) Studies on curcumin and curcuminoids XXXI. Symmetric and asymmetric curcuminoids: stability, activity and complexation with cyclodextrin. Int. J. Pharm. 338, 27–34 - PubMed
    1. Pan, M. H. , Huang, T. M. , and Lin, J. K. (1999) Biotransformation of curcumin through reduction and glucuronidation in mice. Drug Metab. Dispos. 27, 486–494 - PubMed
    1. Ravindranath, V. , and Chandrasekhara, N. (1980) Absorption and tissue distribution of curcumin in rats. Toxicology 16, 259–265 - PubMed

Publication types

MeSH terms

LinkOut - more resources