. 2019 Sep 1;453(1):86-104.
doi: 10.1016/j.ydbio.2019.04.020. Epub 2019 May 25.

Lens differentiation is characterized by stage-specific changes in chromatin accessibility correlating with differentiation state-specific gene expression

Affiliations

Lens differentiation is characterized by stage-specific changes in chromatin accessibility correlating with differentiation state-specific gene expression

Joshua Disatham et al. Dev Biol. .

Abstract

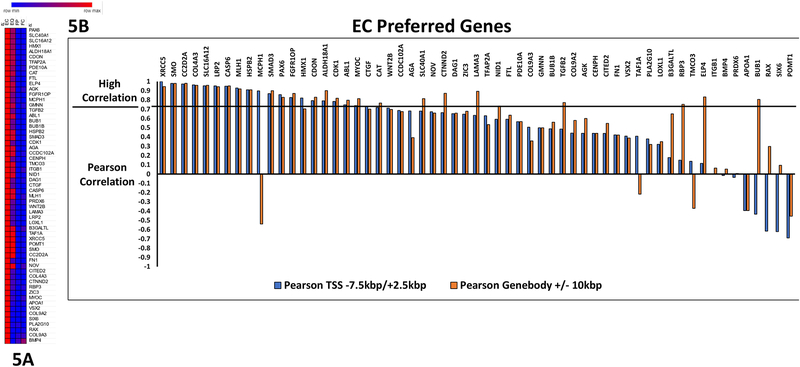
Changes in chromatin accessibility regulate the expression of multiple genes by controlling transcription factor access to key gene regulatory sequences. Here, we sought to establish a potential function for altered chromatin accessibility in control of key gene expression events during lens cell differentiation by establishing genome-wide chromatin accessibility maps specific for four distinct stages of lens cell differentiation and correlating specific changes in chromatin accessibility with genome-wide changes in gene expression. ATAC sequencing was employed to generate chromatin accessibility profiles that were correlated with the expression profiles of over 10,000 lens genes obtained by high-throughput RNA sequencing at the same stages of lens cell differentiation. Approximately 90,000 regions of the lens genome exhibited distinct changes in chromatin accessibility at one or more stages of lens differentiation. Over 1000 genes exhibited high Pearson correlation coefficients (r ​> ​0.7) between altered expression levels at specific stages of lens cell differentiation and changes in chromatin accessibility in potential promoter (-7.5kbp/+2.5kbp of the transcriptional start site) and/or other potential cis-regulatory regions ( ±10 ​kb of the gene body). Analysis of these regions identified consensus binding sequences for multiple transcription factors including members of the TEAD, FOX, and NFAT families of transcription factors as well as HIF1a, RBPJ and IRF1. Functional mapping of genes with high correlations between altered chromatin accessibility and differentiation state-specific gene expression changes identified multiple families of proteins whose expression could be regulated through changes in chromatin accessibility including those governing lens structure (BFSP1,BFSP2), gene expression (Pax-6, Sox 2), translation (TDRD7), cell-cell communication (GJA1), autophagy (FYCO1), signal transduction (SMAD3, EPHA2), and lens transparency (CRYBB1, CRYBA4). These data provide a novel relationship between altered chromatin accessibility and lens differentiation and they identify a wide-variety of lens genes and functions that could be regulated through altered chromatin accessibility. The data also point to a large number of potential DNA regulatory sequences and transcription factors whose functional analysis is likely to provide insight into novel regulatory mechanisms governing the lens differentiation program.


Figures

Figure 1.
Figure 1.. Chromatin accessible DNA regions cluster in potential cis-regulatory regions of the chick eye lens genome.
A. Experimental Design: Duplicate pools (n=100) of E13 Embryonic chick lenses were micro-dissected into regions corresponding with progressive stages of lens cell differentiation including central epithelium (EC), equatorial epithelium (EQ), newly formed fiber cells (FP), and mature fiber cells (FC). Samples were analyzed by ATAC sequencing as described in methods. A total of 89,904 chromatin accessible regions were identified (Supplementary table 1) B. Day 13 embryonic chick lenses stained with phalloidin and DAPI with labeled microdissected regions. C. Representative ATAC sequencing tracks derived for chromosome 28 (1,580,876–3,161,751) showing multiple accessible chromatin peaks throughout the indicated chromosomal region. Gene bodies are shown in the top most track labeled Refseq Genes (dark blue). Red peaks represent chromatin accessible regions identified in undifferentiated quiescent central lens epithelial cells (EC). Purple peaks represent chromatin accessible regions identified in differentiating lens epithelial cells that first proliferate and subsequently exit the cell cycle (EQ). Light blue peaks represent chromatin accessible regions identified in actively differentiating nascent lens fiber cells (FP). Green peaks represent chromatin accessible regions identified in terminally differentiated core lens fiber cells (FC). D. Distribution of sites of chromatin accessibility within 5kbp of Transcription Start Sites (TSS) and within 2kbp of Genebodies for each differentiation-stage replicate. E. Locations of chromatin accessibility sites (ATAC-seq peaks) relative to Promoters (−7.5kbp to +2.5kbp of the TSS), Genebodies (contained within the gene sequence) and Intergenic regions of 10,698 annotated genes established for each stage of lens cell differentiation (EC, EQ, FP and FC). “Control” represents the computer-generated random distribution of peaks against the same annotations. Relative percentage differences between chromatin accessible sites in Promoters, Genebodies, and Intergenic Regions of each differentiation-stage specific lens region relative to the same three regions in the randomly generated “Control”.
Figure 2.
Figure 2.. Specific stages of lens cell differentiation are marked by key differences in chromatin accessibility most abundant between differentiating lens epithelial cells and nascent lens fiber cells.
A. Distribution of peak tag numbers between biological duplicates of samples (intra-sample variation), and between lens micro-dissected regions (inter-sample variation) indicating low intrasample variation and significant intersample differences that increase as lens cell differentiation proceeds (EC to EQ, EQ to FP, FP to FC). B. Number of differentiation stage-specific sites of chromatin accessibility (ATACseq peaks) detected in each micro-dissected lens region. Peaks that were found in two adjacent lens regions are also indicated. C. Bar graph of the number of altered sites of chromatin accessibility determined for each stage of lens cell differentiation. Number of sites common to adjacent stages of lens differentiation and common to all four stages of lens differentiation are also included. D. Differential analysis of sites of chromatin accessibility reveals altered levels of chromatin accessibility (open or closed) in specific stages of lens cell differentiation analyzed by pairwise comparison and displayed as volcano plots (red dots indicate sites with |Log2 fold change average peak intensity| > 1, FDR adj p-value < 0.05). A differential analysis of sites of chromatin accessibility differences common to combined epithelial cell stages of differentiation and combined fiber cell states of differentiation is also shown for comparison (E vs. F).
Figure 3.
Figure 3.. Differentiation state-specific expression patterns of key lens genes correlate with changes in chromatin accessibility in potential gene regulatory regions.
A. Chromatin accessibility map of the lens structural gene filensin (BFSP1) during progressive stages of lens cell differentiation (Red-EC, Violet-EQ, Blue-FP, Green-FC). Highlights and arrows indicate regions of altered chromatin accessibility within −7.5kbp/+2.5kbp of the transcription start site (TSS). B. The average peak intensity of chromatin accessible peaks within −7.5kbp/+2.5kbp of the TSS of BFSP1 across progressive stages of lens cell differentiation. Peak intensity data is provided by the ATACseq analysis. C. The corresponding gene expression profile of BFSP1 during progressive stages of lens cell differentiation. Gene expression data is taken from RNAseq analysis and quantified as FPKM. D. Plot of BFSP1 transcript FPKM vs Average peak intensity within −7.5kbp/+2.5kbp of the TSS of BFSP1 across the four progressive stages of lens differentiation. Data was correlated via Pearson correlation coefficient and is included in the plot. The same analysis was performed on the lens structural gene CP49 (BFSP2, E–H), the lens crystallin gene gamma-crystallin (CRYGN, I–L), the lens transcription factor paired box 6 (PAX6, M–P), and the lens cystallin gene delta-cystallin (ASL1, Q–T).
Figure 4.
Figure 4.. Differentiation state-specific expression patterns of multiple genes are highly correlated with chromatin accessibility changes in potential DNA regulatory regions.
A. Barplot showing the percentage of differentially expressed genes (|Log2 fold change FPKM| >1 between any two adjacent stages of lens cell differentiation, and adj p-value < 0.05) that are highly correlated (r > 0.7) with chromatin accessibility changes proximal to the transcription start site (within −7.5kbp/+2.5kbp of the TSS). Chi-squared analysis was performed to compare the result to the percentage of non-differentially expressed genes (|Log2 fold change FPKM <1|, and/or adj-p-value > 0.05) that were highly correlated with chromatin accessibility changes proximal to the transcription start site. B. Barplot showing the percentage of differentially expressed genes at each stepwise comparison (EC/EQ, EQ/FP, FP/FC) that are highly correlated (r > 0.7) with chromatin accessibility changes proximal to the transcription start site. Chi-squared analysis was performed to compare the results of each stepwise comparison to each other. *** p<0.001, * p<0.05, ns p>0.05. C. 1373 genes with a high pearson correlation (r > 0.7) between chromatin accessibility changes and statistically significant gene expression changes between progressive stages of lens cell differentiation (EC/EQ, EQ/FP, FP/FC) were analyzed for statistical overrepresentation of key Biological Processes associated with these genes. This gene enrichment analysis revealed 5 overrepresented biological processes associated with the genes differentially expressed between quiescent epithelial cells (EC) and differentiating epithelial cells (EQ), 15 overrepresented biological processes associated with the genes differentially expressed between differentiating epithelial cells (EQ) and nascent lens fiber cells (FP), 0 overrepresented biological process associated with the genes differentially expressed between nascent lens fiber cells (FP) and terminally differentiated lens fiber cells (FC).
Figure 5.
Figure 5.. Expression patterns of important lens genes correlate with chromatin accessibility changes in potential DNA regulatory regions.
A. Morpheus heatmaps demonstrating expression profiles of specific lens genes most highly expressed in quiescent lens epithelial cells (EC, quantified by FPKM from RNAseq) across the four stages of lens differentiation (red high expression, blue low expression). B. Barplots showing pearson correlation coefficient values calculated between average peak intensity of chromatin accessibility regions proximal to the transcription start site (dark blue) and proximal to the gene body (orange) of these specific lens genes compared to their gene expression profiles. The same analysis was performed for specific lens genes most highly expressed in differentiating lens epithelial cells (EQ, C–D), nascent lens fiber cells (FP, E–F), and terminally differentiated lens fiber cells (FC, G–H).
Figure 6.
Figure 6.. Multiple transcription factor binding sites are located in regions of altered chromatin accessibility in potential DNA regulatory regions of important lens genes.
A. The chromatin accessibility profiles proximal to the TSS (−7.5kbp/+2.5kbp) and Genebodies (+/−10 kbp) of 73 genes with associated lens functions were highly correlated with their respective gene expression profiles across the four stages of lens differentiation (Fig. 5). Analysis of chromatin accessible regions of these genes (AME tool MEME-suite 5.0.3) revealed 25 transcription factor binding motifs with high statistically significant representation (E-value < 0.05) in the chromatin accessible regions of these genes. The E-value, percent of sequences containing the motif, and the consensus binding sequences are listed. B. Morpheus heatmaps demonstrating expression profiles of these 25 transcription factors (quantified by FPKM from RNAseq) across the four stages of lens differentiation (red is high expression, blue is low expression). C. Chromatin accessibility map of the lens crystallin gene crystallin gamma-N (CRYGN) during progressive stages of lens cell differentiation. Blue highlights indicate regions of chromatin accessibility that contain the detected transcription factor binding sites. Also labeled are the relative positions of the most statistically significant transcription factor binding sites detected in these chromatin accessible regions. Transcription factor binding motifs, corresponding DNA sequences, and p-values for each match are reported. The same analysis and depiction of transcription factor binding sites matched to the fiber cell structural proteins filensin (BFSP1) and CP49 (BFSP2) (D and E respectively), the lens transcription factor Paired Box 6 (PAX6, F), the transmembrane protein of the Notch signaling pathway (NOTCH1, G), and the lens crystallin gene delta crystallin (ASL1, H). For each gene ATACseq tracks representing the differentiation state specific region that each gene is most highly expressed in are shown to visualize regions of open chromatin containing the transcription factor binding motifs.
Figure 7.
Figure 7.. Experession patterns of selected chromatin modifying proteins at distinct stages of lens cell differentiation.
Morpheus heatmaps demonstrating expression profiles of genes encoding chromatin remodeling enzymes and DNA modification proteins (quantified by FPKM from RNAseq) across the four stages of lens differentiation (red high expression, blue low expression). The genes are sorted by the differentiation state-specific region each gene is most highly expressed in.

Comment in

Similar articles

Cited by

References

    1. Ackermann AM, Wang Z, Schug J, Naji A, Kaestner KH, 2016. Integration of ATAC-seq and RNA-seq identifies human alpha cell and beta cell signature genes. Mol. Metab 5, 233–244. 10.1016/j.molmet.2016.01.002 - DOI - PMC - PubMed
    1. Bailey TL, Boden M, Buske FA, Frith M, Grant CE, Clementi L, Ren J, Li WW, Noble WS, 2009. MEME SUITE: tools for motif discovery and searching. Nucleic Acids Res 37, W202–W208. 10.1093/nar/gkp335 - DOI - PMC - PubMed
    1. Bailey TL, Gribskov M, 1998. Combining evidence using p-values: application to sequence homology searches. Bioinformatics 14, 48–54. 10.1093/bioinformatics/14.1.48 - DOI - PubMed
    1. Beyer EC, Berthoud VM, 2014. Connexin hemichannels in the lens. Front. Physiol 5, 20 10.3389/fphys.2014.00020 - DOI - PMC - PubMed
    1. Brennan LA, McGreal-Estrada R, Logan CM, Cvekl A, Menko AS, Kantorow M, 2018. BNIP3L/NIX is required for elimination of mitochondria, endoplasmic reticulum and Golgi apparatus during eye lens organelle-free zone formation. Exp. Eye Res 174, 173–184. 10.1016/j.exer.2018.06.003 - DOI - PMC - PubMed

Publication types

LinkOut - more resources