

The Lipid and Glyceride Profiles of Infant Formula Differ by Manufacturer, Region and Date Sold
- PMID: 31137537
- PMCID: PMC6567151
- DOI: 10.3390/nu11051122
The Lipid and Glyceride Profiles of Infant Formula Differ by Manufacturer, Region and Date Sold
Abstract
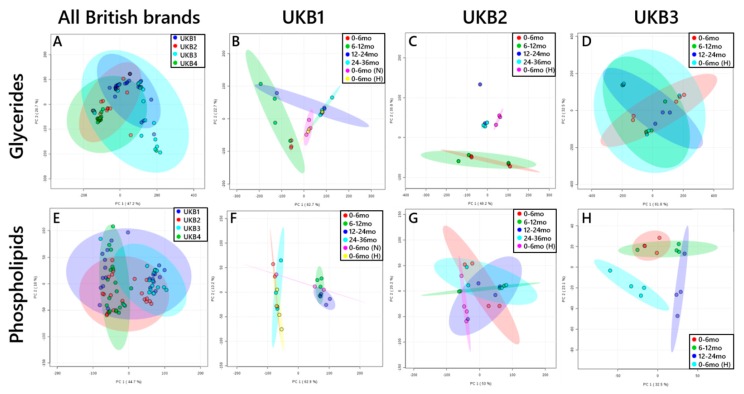
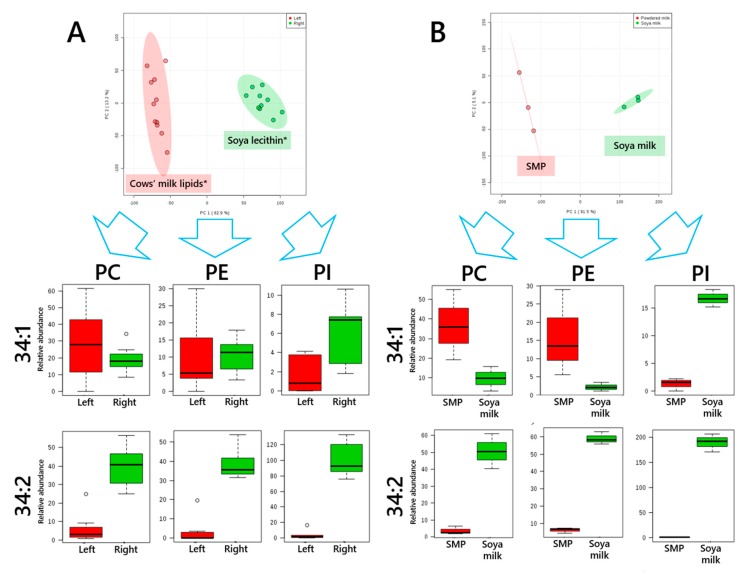
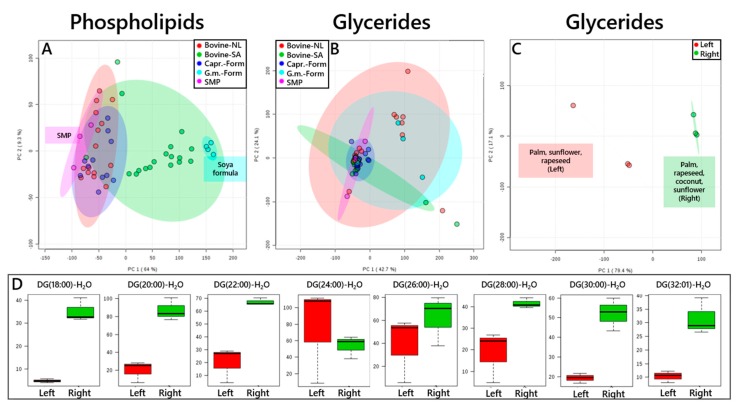
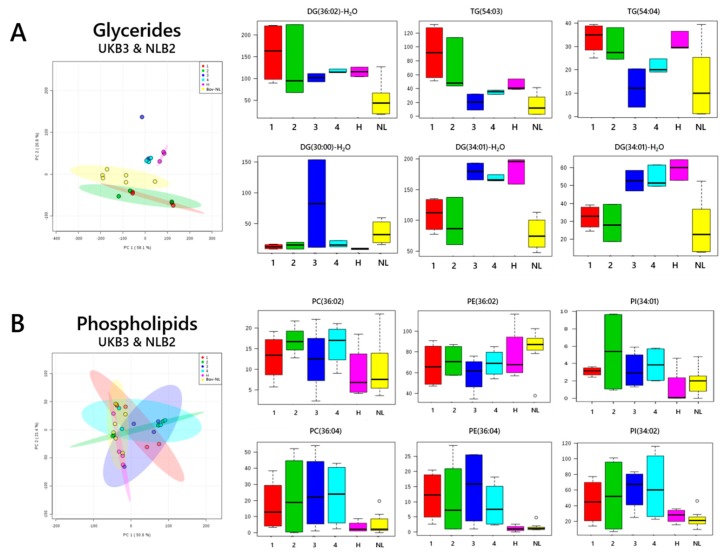
We tested the hypothesis that the lipid composition of infant formula is consistent between manufacturers, countries and target demographic. We developed techniques to profile the lipid and glyceride fraction of milk and formula in a high throughput fashion. Formula from principal brands in the UK (2017-2019; bovine-, caprine-, soya-based), the Netherlands (2018; bovine-based) and South Africa (2018; bovine-based) were profiled along with fresh British animal and soya milk and skimmed milk powder. We found that the lipid and glyceride composition of infant formula differed by region, manufacturer and date of manufacture. The formulations within some brands, aimed at different target age ranges, differed considerably where others were similar across the range. Soya lecithin and milk lipids had characteristic phospholipid profiles. Particular sources of fat, such as coconut oil, were also easy to distinguish. Docosahexaenoic acid is typically found in triglycerides rather than phospholipids in formula. The variety by region, manufacturer, date of manufacture and sub-type for target demographics lead to an array of lipid profiles in formula. This makes it impossible to predict its molecular profile. Without detailed profile of the formula fed to infants, it is difficult to characterise the relationship between infant nutrition and their growth and development.
Keywords: Lipidomics; infant development; infant nutrition; lipid metabolism.
Conflict of interest statement
The authors declare no conflict of interest.
Figures
Similar articles
-
Comparative Lipidomic Study of Human Milk from Different Lactation Stages and Milk Formulas.Nutrients. 2020 Jul 21;12(7):2165. doi: 10.3390/nu12072165. Nutrients. 2020. PMID: 32708300 Free PMC article.
-
Fermentation of Milk into Yoghurt and Cheese Leads to Contrasting Lipid and Glyceride Profiles.Nutrients. 2019 Sep 11;11(9):2178. doi: 10.3390/nu11092178. Nutrients. 2019. PMID: 31514309 Free PMC article.
-
No effect of adding dairy lipids or long chain polyunsaturated fatty acids on formula tolerance and growth in full term infants: a randomized controlled trial.BMC Pediatr. 2018 Jan 22;18(1):10. doi: 10.1186/s12887-018-0985-2. BMC Pediatr. 2018. PMID: 29357820 Free PMC article. Clinical Trial.
-
Infant Formula Fat Analogs and Human Milk Fat: New Focus on Infant Developmental Needs.Annu Rev Food Sci Technol. 2016;7:139-65. doi: 10.1146/annurev-food-041715-033120. Annu Rev Food Sci Technol. 2016. PMID: 26934172 Review.
-
Whole Goat Milk as a Source of Fat and Milk Fat Globule Membrane in Infant Formula.Nutrients. 2020 Nov 13;12(11):3486. doi: 10.3390/nu12113486. Nutrients. 2020. PMID: 33202897 Free PMC article. Review.
Cited by
-
Comparative Lipidomic Study of Human Milk from Different Lactation Stages and Milk Formulas.Nutrients. 2020 Jul 21;12(7):2165. doi: 10.3390/nu12072165. Nutrients. 2020. PMID: 32708300 Free PMC article.
-
TAILOR-MS, a Python Package that Deciphers Complex Triacylglycerol Fatty Acyl Structures: Applications for Bovine Milk and Infant Formulas.Anal Chem. 2021 Apr 13;93(14):5684-5690. doi: 10.1021/acs.analchem.0c04373. Epub 2021 Apr 2. Anal Chem. 2021. PMID: 33797237 Free PMC article.
-
Extraction of Lipids from Liquid Biological Samples for High-Throughput Lipidomics.Molecules. 2020 Jul 13;25(14):3192. doi: 10.3390/molecules25143192. Molecules. 2020. PMID: 32668693 Free PMC article.
-
Maternal diet-induced obesity during pregnancy alters lipid supply to mouse E18.5 fetuses and changes the cardiac tissue lipidome in a sex-dependent manner.Elife. 2022 Jan 13;11:e69078. doi: 10.7554/eLife.69078. Elife. 2022. PMID: 35025731 Free PMC article.
-
Characterisation of the Paternal Influence on Intergenerational Offspring Cardiac and Brain Lipid Homeostasis in Mice.Int J Mol Sci. 2023 Jan 17;24(3):1814. doi: 10.3390/ijms24031814. Int J Mol Sci. 2023. PMID: 36768137 Free PMC article.
References
Publication types
MeSH terms
Substances
Grants and funding
LinkOut - more resources
Full Text Sources
Medical
