. 2019 May 20;11(5):281.
doi: 10.3390/toxins11050281.

Binding to The Target Cell Surface Is The Crucial Step in Pore Formation of Hemolysin BL from Bacillus cereus

Affiliations

Binding to The Target Cell Surface Is The Crucial Step in Pore Formation of Hemolysin BL from Bacillus cereus

Nadja Jessberger et al. Toxins (Basel). .

Abstract

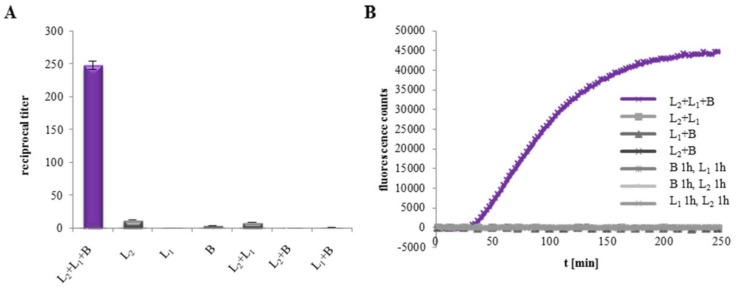
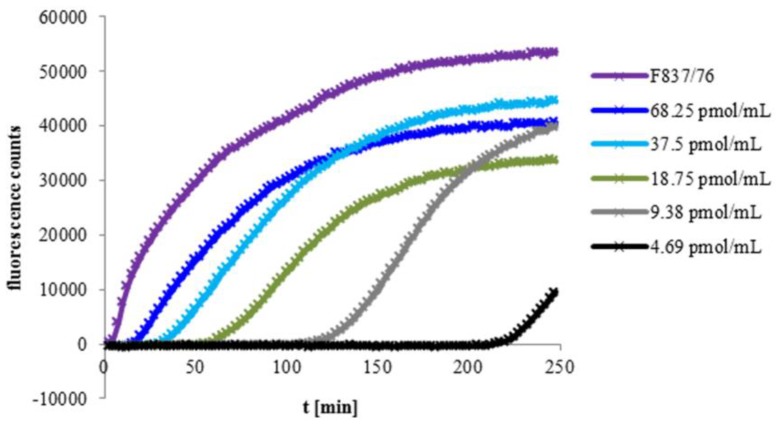
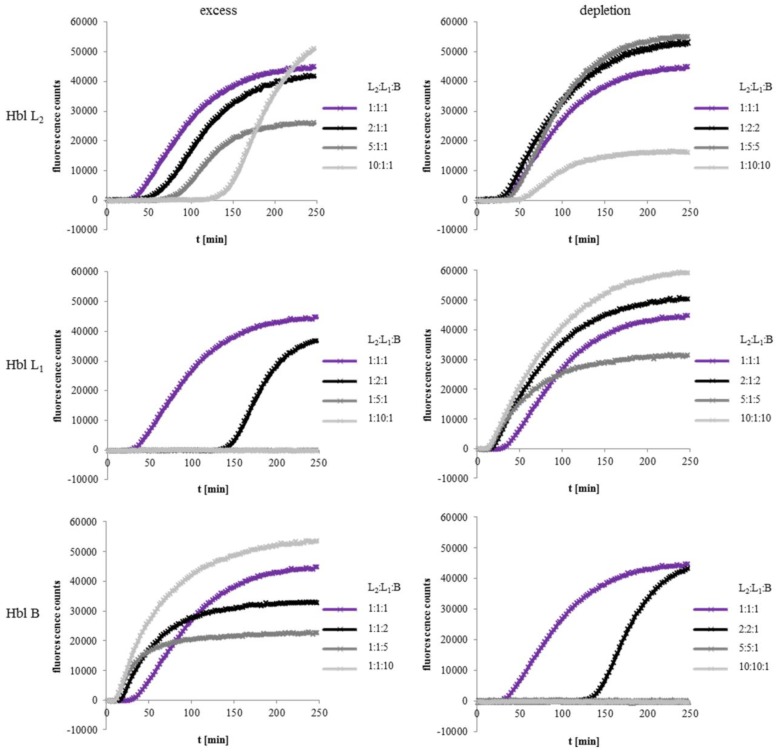
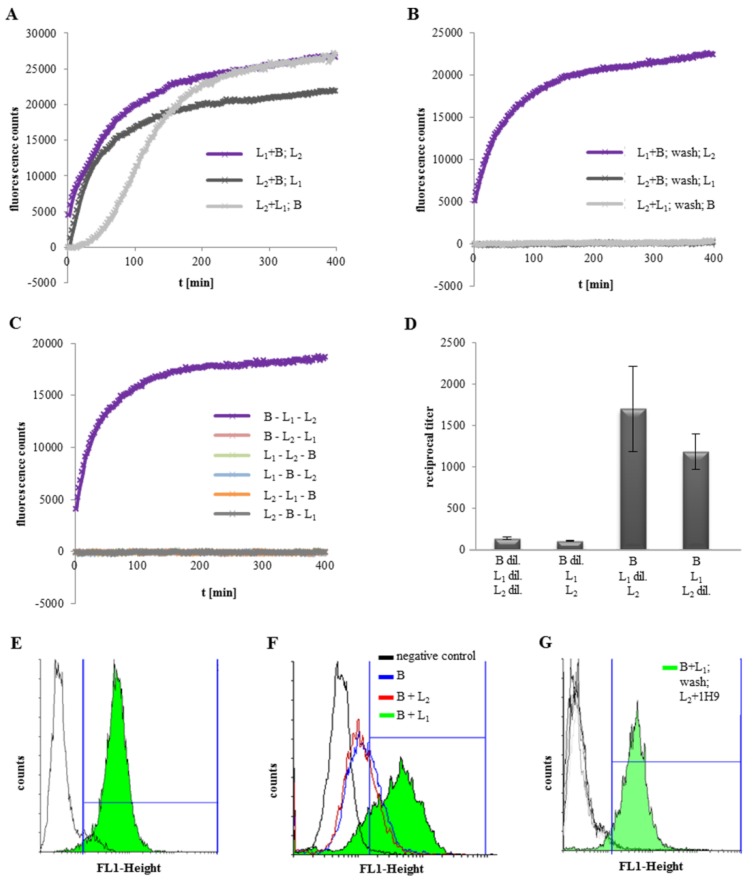
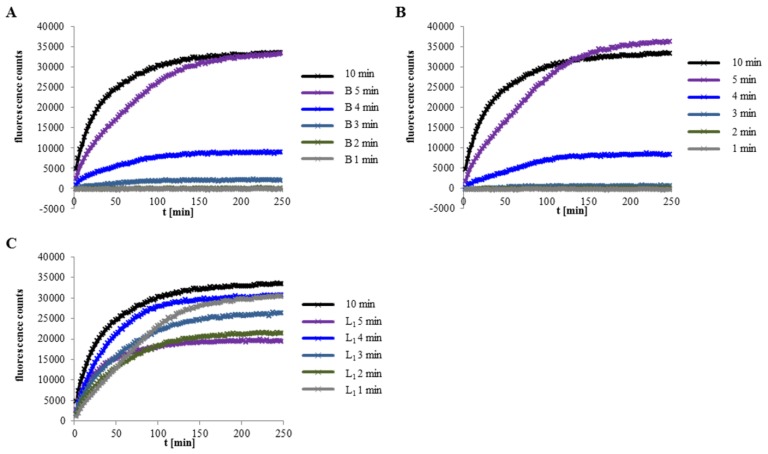
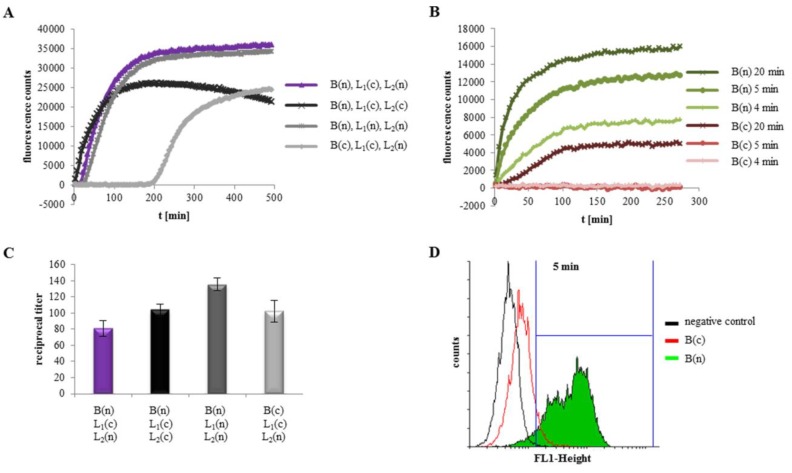
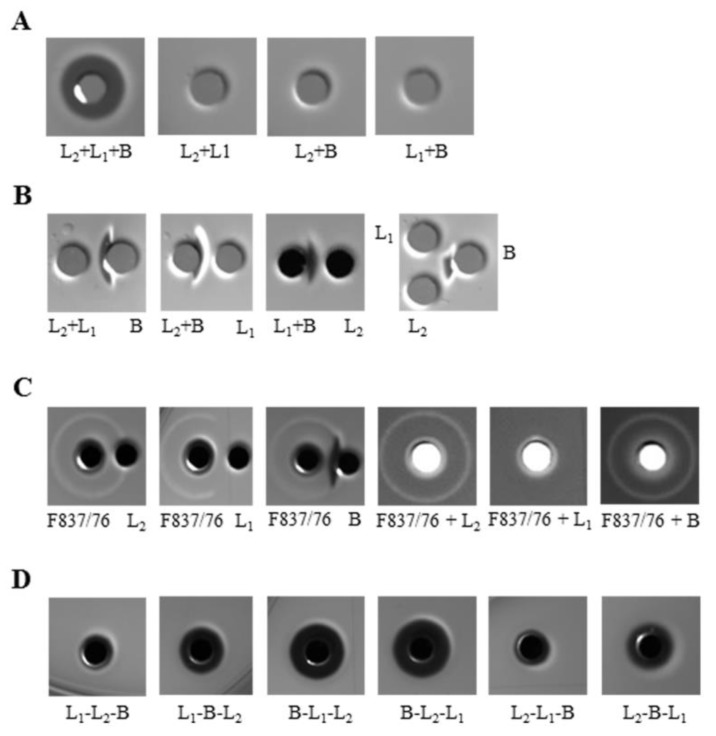
A major virulence factor involved in Bacillus cereus food poisoning is the three-component enterotoxin hemolysin BL. It consists of the binding component B and the two lytic components L1 and L2. Studying its mode of action has been challenging, as natural culture supernatants additionally contain Nhe, the second three-component enterotoxin, and purification of recombinant (r) Hbl components has been difficult. In this study, we report on pore-forming, cytotoxic, cell binding and hemolytic activity of recently generated rHbl components expressed in E. coli. It is known that all three Hbl components are necessary for cytotoxicity and pore formation. Here we show that an excess of rHbl B enhances, while an excess of rHbl L1 hinders, the velocity of pore formation. Most rapid pore formation was observed with ratios L2:L1:B = 1:1:10 and 10:1:10. It was further verified that Hbl activity is due to sequential binding of the components B - L1 - L2. Accordingly, all bioassays proved that binding of Hbl B to the cell surface is the crucial step for pore formation and cytotoxic activity. Binding of Hbl B took place within minutes, while apposition of the following L1 and L2 occurred immediately. Further on, applying toxin components simultaneously, it seemed that Hbl L1 enhanced binding of B to the target cell surface. Overall, these data contribute significantly to the elucidation of the mode of action of Hbl, and suggest that its mechanism of pore formation differs substantially from that of Nhe, although both enterotoxin complexes are sequentially highly related.

Keywords: Bacillus cereus; enterotoxins; hemolysin BL; mode of action; three-component toxin.


Conflict of interest statement

The authors declare no conflict of interest. The funders had no role in the design of the study; in the collection, analyses, or interpretation of data; in the writing of the manuscript, or in the decision to publish the results.

Figures

Figure 1
Figure 1
Toxic activity of the rHbl components on Vero cells. (A) WST-1 bioassay. The rHbl components were mixed in 1:1:1 ratios and applied as serial dilution to the cells, starting with 75 pmol/mL. Shown are reciprocal titers, which were defined as the dilution necessary to gain 50% dead cells after 24 h. Titers below 20 indicate no specific toxic activity. (B) PI influx test. The rHbl components were mixed in 1:1:1 ratios and applied to the cells (37.5 pmol/mL each). Alternatively, cells were incubated for 1 h with one component, washed and then incubated for another h with the second component. Only for the sample with rHbl L2+L1+B, PI influx and thus, pore formation was measured.
Figure 2
Figure 2
PI influx into Vero cells. The rHbl components were adjusted to the indicated molar concentrations, mixed in 1:1:1 ratios and applied to Vero cells. Increasing fluorescence was measured representing influx of propidium iodide. Supernatant of strain F837/76 was used as a control.
Figure 3
Figure 3
PI influx test on Vero cells with rHbl components L2, L1 and B mixed in different ratios. The components were pre-mixed in the ratio 1:1:1 or with 2×, 5× and 10× excess or depletion of each component compared to the other two. The 1:1:1 ratio corresponds to 37.5 pmol/mL each. Upper row: Results for Hbl L2. Middle row: Results for Hbl L1, lower row: Results for Hbl B. Left: 2× (black), 5× (dark grey) and 10× (light grey) excess of each Hbl component. Right: 2× (black), 5× (dark grey) and 10× (light grey) depletion of each Hbl component. The 1:1:1 (purple) sample is shown in every diagram as control.
Figure 4
Figure 4
Toxicity of rHbl to Vero cells. If not stated otherwise, the rHbl components were used in molar concentrations of 37.5 pmol/mL each. (A) Two rHbl components were mixed in 1:1 ratio and applied to the cells. After 1 h, the corresponding third component was added. Immediately after that, PI influx was measured. (B) Two rHbl components were again mixed in a 1:1 ratio and applied to the cells. After 1 h, the mixture was removed and Vero cells were washed three times with medium. Subsequently the corresponding third component was added and the PI influx was measured. (C) Each component was added individually to the cells. After 1 h each, cells were washed three times in medium. After adding the third component, PI influx was measured immediately. (D) WST-1 bioassays on Vero cells. The single rHbl components were added consecutively to the cells with two intermediate washing steps with medium each time. Because of the high toxic activity in this approach, rHbl components were used in concentrations of 3.75 pmol/mL. In each setup, two components were applied constantly, and the third as a dilution series of 1:2. Each component was incubated for only 45 min. After the third component was applied, cells were again washed two times and incubated with WST-1 for 1.5 h before measuring. Titers were determined as the toxin dilution causing 50% dead cells (dil. = dilution series.). (E) Flow cytometry results of rHbl B binding to Vero cells. Cells were incubated successively for 1 h with rHbl B, mAb 1G8, and for 45 min with Alexa Fluor® 488 goat anti mouse IgG. A fluorescence shift (green) was visible compared to the negative control (no rHbl B). (F) Flow cytometry results of rHbl B (blue), rHbl B+L2 (red) and rHbl B+L1 (green) detected with mAb 1B8 and Alexa Fluor® 488 goat anti mouse IgG. (G) Flow cytometry results. Vero cells were incubated with 1. mAb 1H9, 2. rHbl L2+1H9, 3. rHbl B and L2+1H9, 4. rHbl L1 and L2+1H9 and 5. rHbl B+L1 and after washing L2+1H9. Only the latter showed fluorescence. Fluorescence was again detected with Alexa Fluor® 488 goat anti mouse IgG.
Figure 5
Figure 5
PI influx test on Vero cells. The rHbl components (37.5 pmol/mL each) were successively applied. Application order was B - L1 - L2. After B and L1 cells were washed twice in medium. After addition of L2, measurement was started immediately. (A) Incubation time with L1 was constantly 10 min, incubation times with B were decreased. (B) Decreasing incubation times with B as well as L1. (C) Incubation time with B was constantly 10 min, incubation times with L1 were decreased.
Figure 6
Figure 6
Interaction of rHbl with Vero cells. The rHbl components with N-terminal (n) as well as C-terminal (c) strep-tag were used. Proteins were applied to Vero cells in concentrations of 37.5 pmol/mL each. (A) Compared to the original combination—rHbl B (n), rHbl L1 (c) and rHbl L2 (n) (purple) [30]—exchange of the tag at rHbl B from the N- to the C-terminus resulted in a significantly delayed PI influx. (B) Consecutive application of rHbl B (n and c), L1 (c) and L2 (n); constant incubation times for L1 and L2; decreasing incubation times for the two B proteins. rHbl B (n) = green; rHbl B (c) = red. (C) When the different rHbl constructs were tested in WST-1 bioassays (start concentration 75 pmol/mL each, ratio 1:1:1), no reduction of toxic activity was observed. (D) Results of flow cytometry. rHbl B (n) = green and rHbl B (c) = red were applied to Vero cells for 5 min. mAb 1G8 directly labeled with Alexa Fluor® 488 was used for detection.
Figure 7
Figure 7
Hemolytic activity of rHbl on sheep blood agar. The rHbl stock solutions (1.5 pmol/µL) were pre-mixed, and 10 µL each were applied to 3.5 mm diameter stamp holes on sheep blood agar plates. Plates were photographed after 3–6 h of incubation at 32 °C. (A) All three components are necessary for hemolytic activity. (B) 10 µL of a single component or a mix of two were applied to 2–3 stamp holes with a distance of approximately 3 mm. (C) 10 µL supernatant of strain F837/76 and 10 µL of each rHbl component were applied individually to 2 stamp holes with approximately 3 mm distance or together to 1 stamp hole. (D) 10 µL rHbl components were successively filled into the stamp hole and incubated for 1 h each.

Similar articles

Cited by

References

    1. European Food Safety Authority The European Union summary report on trends and sources of zoonoses, zoonotic agents and food-borne outbreaks 2011. EFSA J. 2013;11:3129.
    1. Mead P.S., Slutsker L., Dietz V., McCaig L.F., Bresee J.S., Shapiro C., Griffin P.M., Tauxe R.V. Food-related illness and death in the United States. Emerg. Infect. Dis. 1999;5:607–625. doi: 10.3201/eid0505.990502. - DOI - PMC - PubMed
    1. Scallan E., Griffin P.M., Angulo F.J., Tauxe R.V., Hoekstra R.M. Foodborne illness acquired in the United States--unspecified agents. Emerg. Infect. Dis. 2011;17:16–22. doi: 10.3201/eid1701.P21101. - DOI - PMC - PubMed
    1. Stenfors Arnesen L.P., Fagerlund A., Granum P.E. From soil to gut: Bacillus cereus and its food poisoning toxins. FEMS Microbiol. Rev. 2008;32:579–606. - PubMed
    1. Lund T., Granum P.E. Characterisation of a non-haemolytic enterotoxin complex from Bacillus cereus isolated after a foodborne outbreak. FEMS Microbiol. Lett. 1996;141:151–156. doi: 10.1111/j.1574-6968.1996.tb08377.x. - DOI - PubMed

Publication types

LinkOut - more resources