. 2019 May 24;11(5):718.
doi: 10.3390/cancers11050718.

ROR1 Potentiates FGFR Signaling in Basal-Like Breast Cancer

Affiliations

ROR1 Potentiates FGFR Signaling in Basal-Like Breast Cancer

Gaurav Pandey et al. Cancers (Basel). .

Erratum in

Abstract

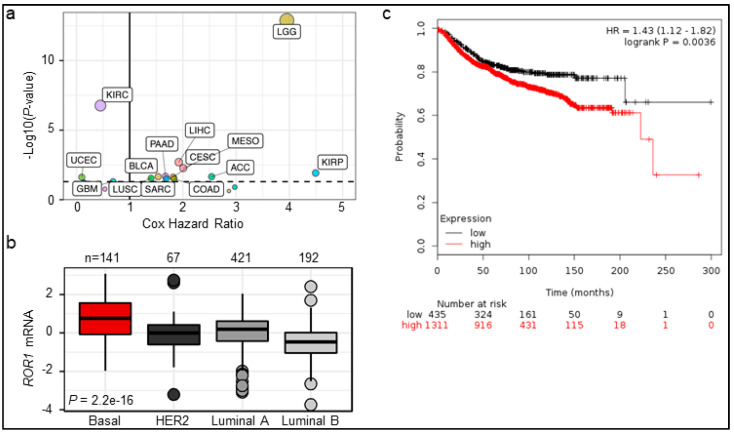
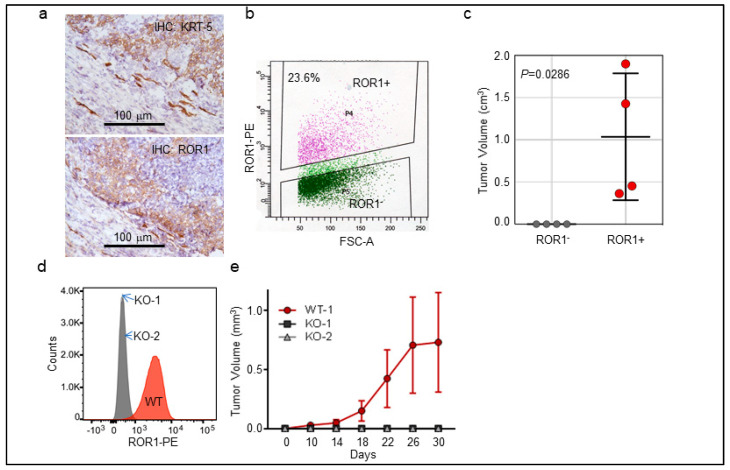
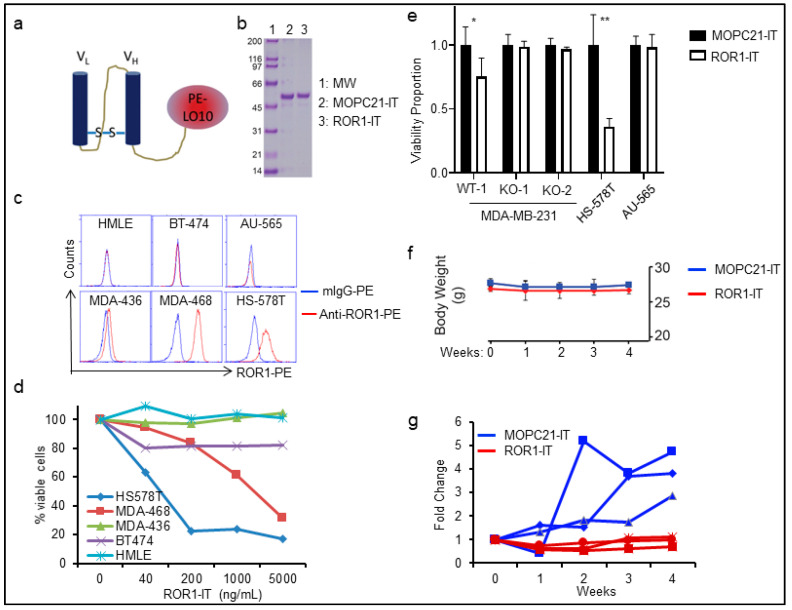
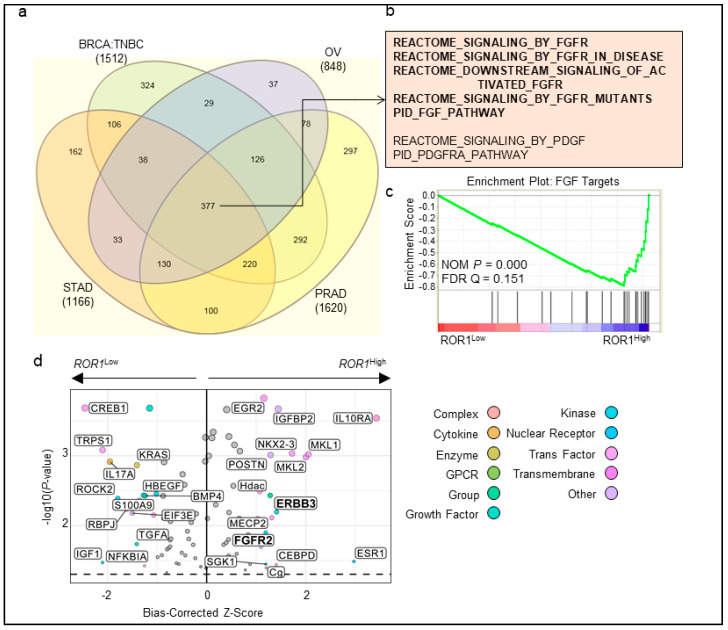
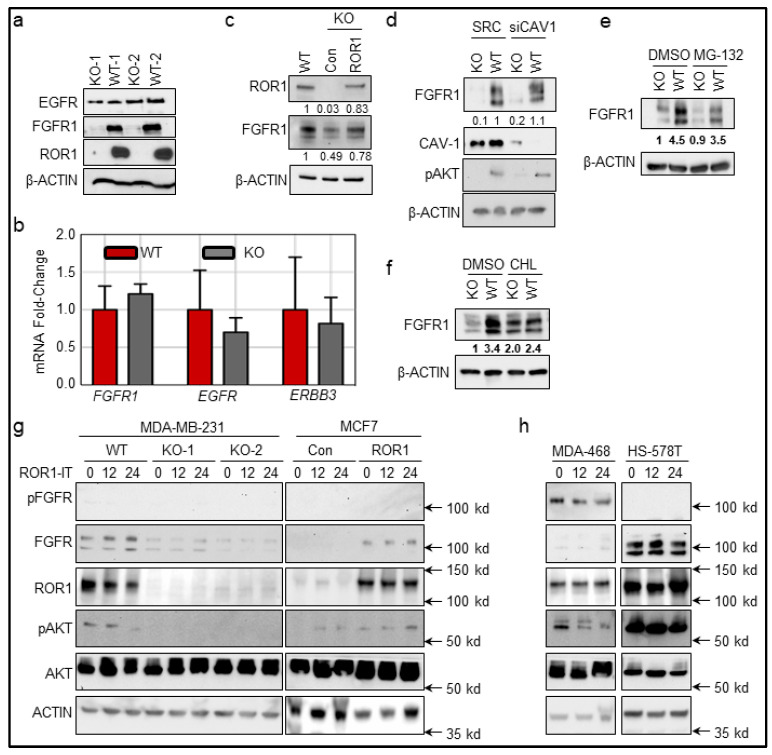
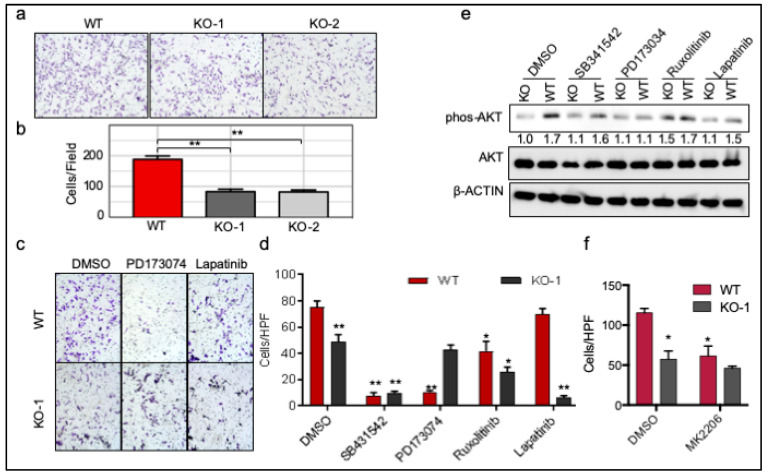
Among all breast cancer types, basal-like breast cancer (BLBC) represents an aggressive subtype that lacks targeted therapy. We and others have found that receptor tyrosine kinase-like orphan receptor 1 (ROR1) is overexpressed in BLBC and other types of cancer and that ROR1 is significantly correlated with patient prognosis. In addition, using primary patient-derived xenografts (PDXs) and ROR1-knockout BLBC cells, we found that ROR1+ cells form tumors in immunodeficient mice. We developed an anti-ROR1 immunotoxin and found that targeting ROR1 significantly kills ROR1+ cancer cells and slows down tumor growth in ROR1+ xenografts. Our bioinformatics analysis revealed that ROR1 expression is commonly associated with the activation of FGFR-mediated signaling pathway. Further biochemical analysis confirmed that ROR1 stabilized FGFR expression at the posttranslational level by preventing its degradation. CRISPR/Cas9-mediated ROR1 knockout significantly reduced cancer cell invasion at cellular levels by lowering FGFR protein and consequent inactivation of AKT. Our results identified a novel signaling regulation from ROR1 to FGFR and further confirm that ROR1 is a potential therapeutic target for ROR1+ BLBC cells.

Keywords: FGFR signaling; ROR1; breast cancer; cancer therapy.


Conflict of interest statement

The authors declare no conflict of interest.

Figures

Figure 1
Figure 1
Higher expression of ROR1 is correlated with poor overall survival in several cancers. (a) Cox proportional hazard regression summary of hazard ratios and –log10 (p-value) across the TCGA Pan Can cohort. Labeled points indicate significance of p < 0.05, which is also marked by the horizontal dotted line. (b) Z-score transformed mRNA for ROR1 across PAM50 subtypes in the breast cancer TCGA cohort. Samples compared using one-way ANOVA test. (c) KM plotter was used to analyze ROR1 expression and prognosis. Using ROR1 max probe: 205805_s_at and optimal cutoff, ROR1 mRNA is inversely correlated with distal metastasis free survival (DMFS) in all breast cancer patients (n = 1311 in the ROR1-high group and n = 435 in the low group, p = 0.0036).
Figure 2
Figure 2
ROR1+ cells are tumorigenic. (ac) One clinical TNBC specimen was stained with cytokeratin-5 (KRT-5) for defining basal cancer type and with ROR1 for its positivity (a). A fresh TNBC with confirmed basal type was digested into single cell suspensions, following with flow cytometry to separate into ROR1+ and ROR1 epithelial (labeled by EpCAM+) populations (b). 5000 ROR1+ or ROR1- TNBC cells were orthotopically injected into 7-week old immunodeficient female NSG mice for tumor growth, with one #4 fatpad injected with ROR1+ and the other #4 fatpad with ROR1 cells for stringent comparison. Tumors were monitored (c, shown as mean ± SD, n = 4). (d,e) CRISPR/Cas9-mediated KO of ROR1 in MDA-MB-231 cells with two clones shown as negative of surface ROR1 staining by flow cytometry (d) and 2 million of WT and KO MDA-MB-231 cells were injected into #4 fatpad of NSG mice and tumor growth were measured (e, shown as mean ± SD, n = 7–8, p < 0.001, 2-way ANOVA).
Figure 3
Figure 3
Targeting ROR1+ cancer cells with immunotoxin. (a,b) Construction and purification of anti-ROR1-immunotoxin by fusing variable region of anti-human ROR1 antibody (clone 2A2) with modified exotoxin A (PElo10) from Pseudomonas aeruginosa (a), using variable region of MOPC21 (a non-specific mouse antibody)-fused with PElo10 as control. Plasmids encoding ROR1-IT or MOPC21-IT were used to transform E. coli for purification (b). (c) A panel of breast epithelial or cancer cells were screened for ROR1 expression by flow cytometry, including immortalized HMLE cells, three ROR1-negative (BT-474 and AU-565) or low (MDA-MB-436), and two ROR1-positive (MDA-MB-468 and Hs578T) cells. (d) Cells in c. were treated with different doses of ROR1-IT or MOPC-21-IT (0, 40, 200, 1000, 5000 ng/mL). 48 h later, cells were collected and stained with 7-AAD for viability and quantitated by flow cytometry (n = 3, only data for ROR1-IT was shown here). (e) WT or KO cells of MDA-MB-231, ROR1+ Hs578T, or ROR1 AU-565 cells were treated with 400 ng/mL of ROR1-IT or MOPC-21-IT for 48 h, following with counting of viable cells. ROR1-IT-treated cells were normalized to their corresponding MOPC-21-IT-treated cells (n = 3). * p < 0.05; ** p < 0.001. (f,g) ROR1+ Hs578T cells were injected orthotopically into NSG mice and treated with MOPC21-IT or ROR1-IT daily at 100 µg/injection for 4 weeks. Body weight (f) and tumor volume (g) were monitored weekly (n = 3).
Figure 4
Figure 4
ROR1 is associated with FGFR signaling across different cancers. (ac) Stomach adenocarcinoma (STAD: data from TCGA), triple-negative breast cancer (BrCa: data from GSE76275), ovarian (OV: data from TCGA) and prostate adenocarcinoma (PRAD: data from TCGA) were separated into low and high ROR1 expressing groups (77 samples with the lowest expression vs. 77 samples with the highest expression) and gene set enrichment analysis was performed. (a) Venn diagram of genesets significantly enriched (FDR < 0.25) in the ROR1 high group from each dataset. (b) Genesets related to FGFR and PDGFR receptor tyrosine kinase signaling pathways from the common 377 genesets in (a) are indicated. (c) Enrichment plot for FGFR geneset showing enrichment in ROR1-high expressing group in the BrCa TNBC dataset. (d) Ingenuity Pathway Analysis (IPA) for upstream regulators comparing the ROR1high versus ROR1low tertiles in the BLBC samples in the TCGA. Labeled regulators have a –log10 (p-value) > 1.3, the equivalent of p < 0.05, and bias-corrected Z-scores > 1.2.
Figure 5
Figure 5
ROR1 stabilizes FGFR1 protein level. (a) CRISPR/Cas9-mediated KO of ROR1 in MDA-MB-231 cells with two clones shown as ROR1-KO clones. Representative lanes are shown from immunoblots of cell lysate probed with the antibody against EGFR, FGFR1, ROR1, and β-ACTIN was used as loading control. (b) Real-time PCR analysis of FGFR1, EGFR1, and ERBB3 (HER3) in MDA-MB-231 ROR1-WT or KO cells. (c) ROR1 cells were transfected with ROR1 plasmid for 48 h. Representative lanes are shown from immunoblots of cell lysate probed with the antibody against ROR1, FGFR1, and β-ACTIN was used as loading control. (d) Cells were transfected with scrambled control siRNA and Cav-1 (CAV1) siRNA for 48 h. Representative lanes are shown from immunoblots of cell lysate probed with the antibody against CAV-1, FGFR1, p-AKT and β-ACTIN was used as loading control. (e,f) Cells were treated with MG-132 (e) or chloroquine (f, CHL) for 4 h, or mock-treated with DMSO (e,f). Representative lanes are shown from immunoblots of cell lysate probed with the antibody against FGFR1 and β-ACTIN was used as loading control. For all western blots, summary of band densities, normalized to β-ACTIN (n = 3). (g,h) Listed cell lines were treated with 200 ng/mL of ROR1-IT or MOPC21-IT for the indicated periods. The 0 h control were lysates from MOPC21-IT-treated cells for 24 h. Cell lysates were collected in, following with SDS-PAGE and immunoblotting of pFGFR1, FGFR1, ROR1, pAKT, AKT and β-ACTIN was used as loading control. Con or ROR1 in MCF7 groups refers to MCF7 cells that stably express empty plasmid or ROR1-encoding plasmid. MDA-468 refers to MDA-MB-468 cells.
Figure 6
Figure 6
ROR1 regulates invasion through FGFR1 in BLBC cells. (a) Cells in Figure 5a were used for invasion assay. Scale bar represents 200 μm. (b) The graph represents the average cell number/microscopic field (n = 3). (c,d) WT or KO Cells were plated for invasion assay and treated with control DMSO, SB-431542 (5 µM), PD173074 (50 nM), ruxolitinib (10 µM), or lapatinib (100 nM) for 24 h. Representative images were shown (c) and quantitated (d, shown as mean ± SD, n = 3–4). (e) WT or KO Cells were treated with same set of inhibitors for 2 hours in the complete media. Cells lysates were collected for immunoblotting with pAKT and AKT, with β-ACTIN as a loading control. (f) WT or KO Cells were plated for invasion assay and treated with control DMSO or AKT inhibitor MK2206 for 24 h and quantitated. Data shown as mean ± SD (n = 3), * p < 0.05, ** p < 0.01.

References

    1. Bray F., Ferlay J., Soerjomataram I., Siegel R.L., Torre L.A., Jemal A. Global cancer statistics 2018: GLOBOCAN estimates of incidence and mortality worldwide for 36 cancers in 185 countries. CA Cancer J. Clin. 2018;68:394–424. doi: 10.3322/caac.21492. - DOI - PubMed
    1. Siegel R.L., Miller K.D., Jemal A. Cancer statistics, 2016. CA Cancer J. Clin. 2016;66:7–30. doi: 10.3322/caac.21332. - DOI - PubMed
    1. Perou C.M., Sorlie T., Eisen M.B., van de Rijn M., Jeffrey S.S., Rees C.A., Pollack J.R., Ross D.T., Johnsen H., Akslen L.A., et al. Molecular portraits of human breast tumours. Nature. 2000;406:747–752. doi: 10.1038/35021093. - DOI - PubMed
    1. Cancer Genome Atlas N. Comprehensive molecular portraits of human breast tumours. Nature. 2012;490:61–70. doi: 10.1038/nature11412. - DOI - PMC - PubMed
    1. Rakha E.A., Ellis I.O. Triple-negative/basal-like breast cancer: review. Pathology. 2009;41:40–47. doi: 10.1080/00313020802563510. - DOI - PubMed

LinkOut - more resources