

Human epigenetic ageing is logarithmic with time across the entire lifespan
- PMID: 31138013
- PMCID: PMC6691990
- DOI: 10.1080/15592294.2019.1623634
Human epigenetic ageing is logarithmic with time across the entire lifespan
Abstract
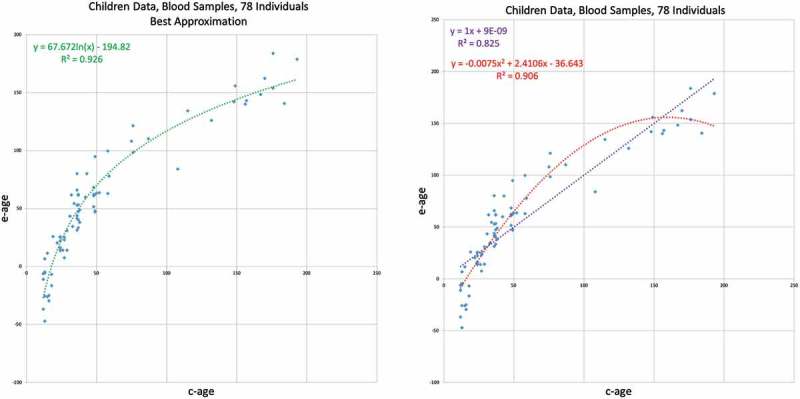
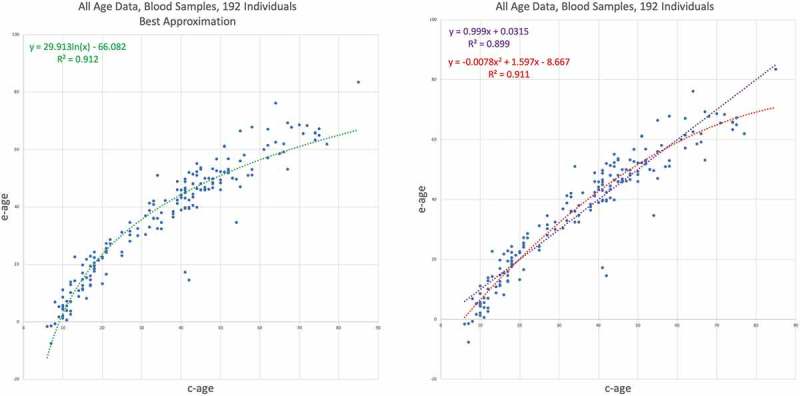
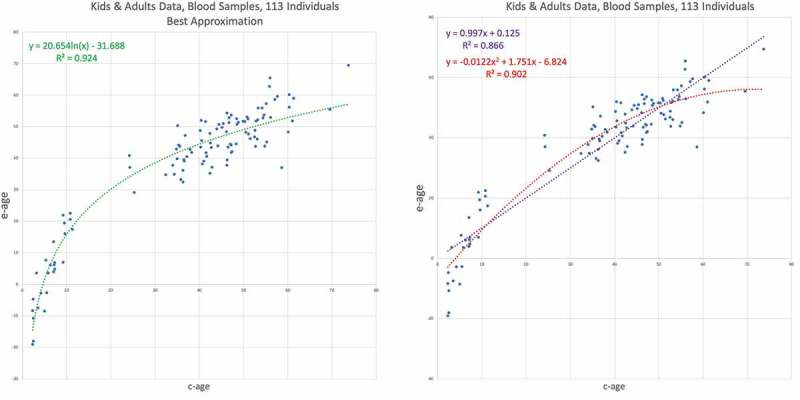
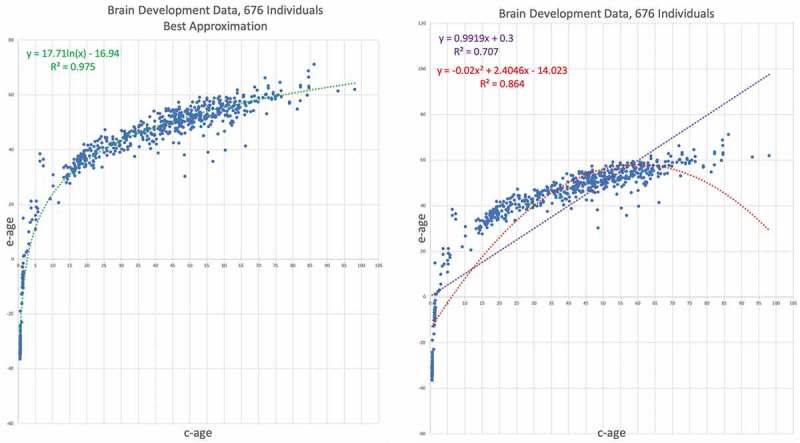
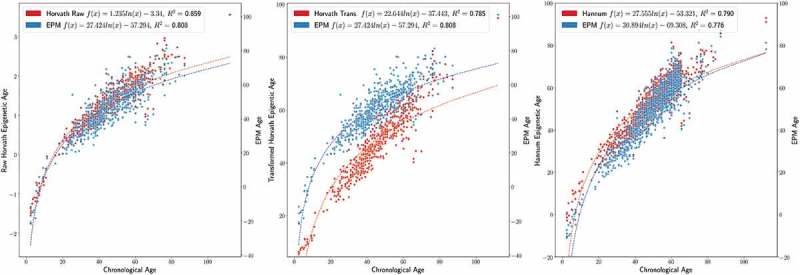
Epigenetic changes during ageing have been characterized by multiple epigenetic clocks that allow the prediction of chronological age based on methylation status. Despite their accuracy and utility, epigenetic age biomarkers leave many questions about epigenetic ageing unanswered. Specifically, they do not permit the unbiased characterization of non-linear epigenetic ageing trends across entire life spans, a critical question underlying this field of research. Here we provide an integrated framework to address this question. Our model, inspired from evolutionary models, is able to account for acceleration/deceleration in epigenetic changes by fitting an individual's model age, the epigenetic age, which is related to chronological age in a non-linear fashion. Application of this model to DNA methylation data measured across broad age ranges, from before birth to old age, and from two tissue types, suggests a universal logarithmic trend characterizes epigenetic ageing across entire lifespans.
Keywords: Aging; DNA methylation.
Figures
Similar articles
-
Dysfunctional epigenetic aging of the normal colon and colorectal cancer risk.Clin Epigenetics. 2020 Jan 3;12(1):5. doi: 10.1186/s13148-019-0801-3. Clin Epigenetics. 2020. PMID: 31900199 Free PMC article.
-
DNA methylation-based age clocks: From age prediction to age reversion.Ageing Res Rev. 2021 Jul;68:101314. doi: 10.1016/j.arr.2021.101314. Epub 2021 Mar 5. Ageing Res Rev. 2021. PMID: 33684551 Review.
-
A Statistical Framework to Identify Deviation from Time Linearity in Epigenetic Aging.PLoS Comput Biol. 2016 Nov 11;12(11):e1005183. doi: 10.1371/journal.pcbi.1005183. eCollection 2016 Nov. PLoS Comput Biol. 2016. PMID: 27835646 Free PMC article.
-
Genetic and environmental causes of variation in epigenetic aging across the lifespan.Clin Epigenetics. 2020 Oct 22;12(1):158. doi: 10.1186/s13148-020-00950-1. Clin Epigenetics. 2020. PMID: 33092643 Free PMC article.
-
Epigenetic genome-wide association methylation in aging and longevity.Epigenomics. 2012 Oct;4(5):503-9. doi: 10.2217/epi.12.41. Epigenomics. 2012. PMID: 23130832 Free PMC article. Review.
Cited by
-
Epigenetic age acceleration predicts subject-specific white matter degeneration in the human brain.Aging Cell. 2025 Apr;24(4):e14426. doi: 10.1111/acel.14426. Epub 2024 Nov 28. Aging Cell. 2025. PMID: 39605173 Free PMC article.
-
Pan-primate studies of age and sex.Geroscience. 2023 Dec;45(6):3187-3209. doi: 10.1007/s11357-023-00878-3. Epub 2023 Jul 26. Geroscience. 2023. PMID: 37493860 Free PMC article.
-
Disentangling age-dependent DNA methylation: deterministic, stochastic, and nonlinear.Sci Rep. 2021 Apr 28;11(1):9201. doi: 10.1038/s41598-021-88504-0. Sci Rep. 2021. PMID: 33911141 Free PMC article.
-
Hibernation slows epigenetic ageing in yellow-bellied marmots.Nat Ecol Evol. 2022 Apr;6(4):418-426. doi: 10.1038/s41559-022-01679-1. Epub 2022 Mar 7. Nat Ecol Evol. 2022. PMID: 35256811 Free PMC article.
-
BayesAge: A maximum likelihood algorithm to predict epigenetic age.Front Bioinform. 2024 Apr 4;4:1329144. doi: 10.3389/fbinf.2024.1329144. eCollection 2024. Front Bioinform. 2024. PMID: 38638123 Free PMC article.
References
-
- Qianhua X, Xie W.. Epigenome in early mammalian development: inheritance, reprogramming and establishment. Trends Cell Biol. 2018;28(3):237–253. - PubMed
-
- Bernstein BE, Meissner A, Lander ES.. The mammalian epigenome. Cell. 2007;128(4):669–681. - PubMed
-
- Jones PA, Takai D. The role of dna methylation in mammalian epigenetics. Science. 2001;293(5532):1068–1070. - PubMed
MeSH terms
Grants and funding
LinkOut - more resources
Full Text Sources
Other Literature Sources
Medical