. 2019 May 28;20(1):273.
doi: 10.1186/s12859-019-2885-3.

Robust identification of molecular phenotypes using semi-supervised learning

Affiliations

Robust identification of molecular phenotypes using semi-supervised learning

Heinrich Roder et al. BMC Bioinformatics. .

Abstract

Background: Modern molecular profiling techniques are yielding vast amounts of data from patient samples that could be utilized with machine learning methods to provide important biological insights and improvements in patient outcomes. Unsupervised methods have been successfully used to identify molecularly-defined disease subtypes. However, these approaches do not take advantage of potential additional clinical outcome information. Supervised methods can be implemented when training classes are apparent (e.g., responders or non-responders to treatment). However, training classes can be difficult to define when assessing relative benefit of one therapy over another using gold standard clinical endpoints, since it is often not clear how much benefit each individual patient receives.

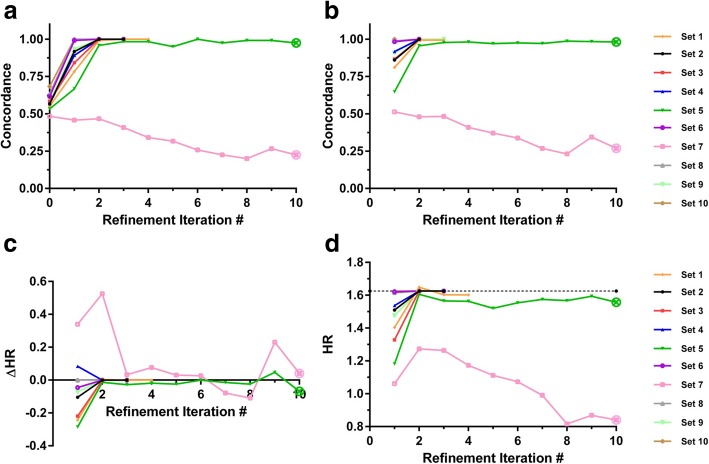
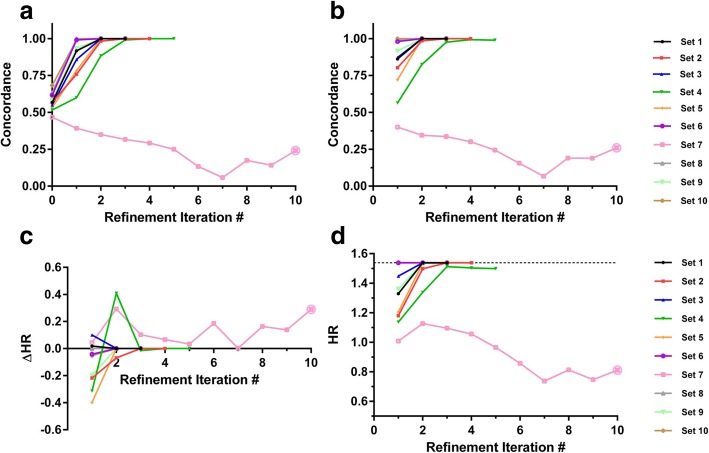
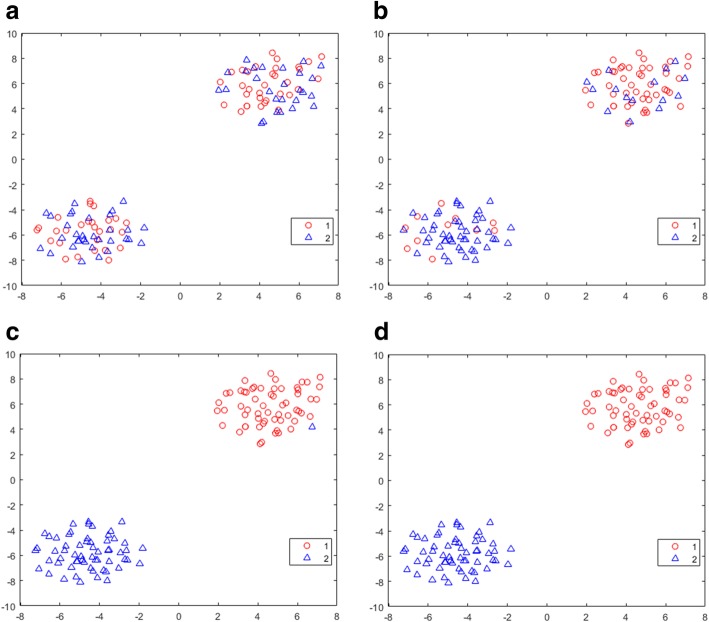
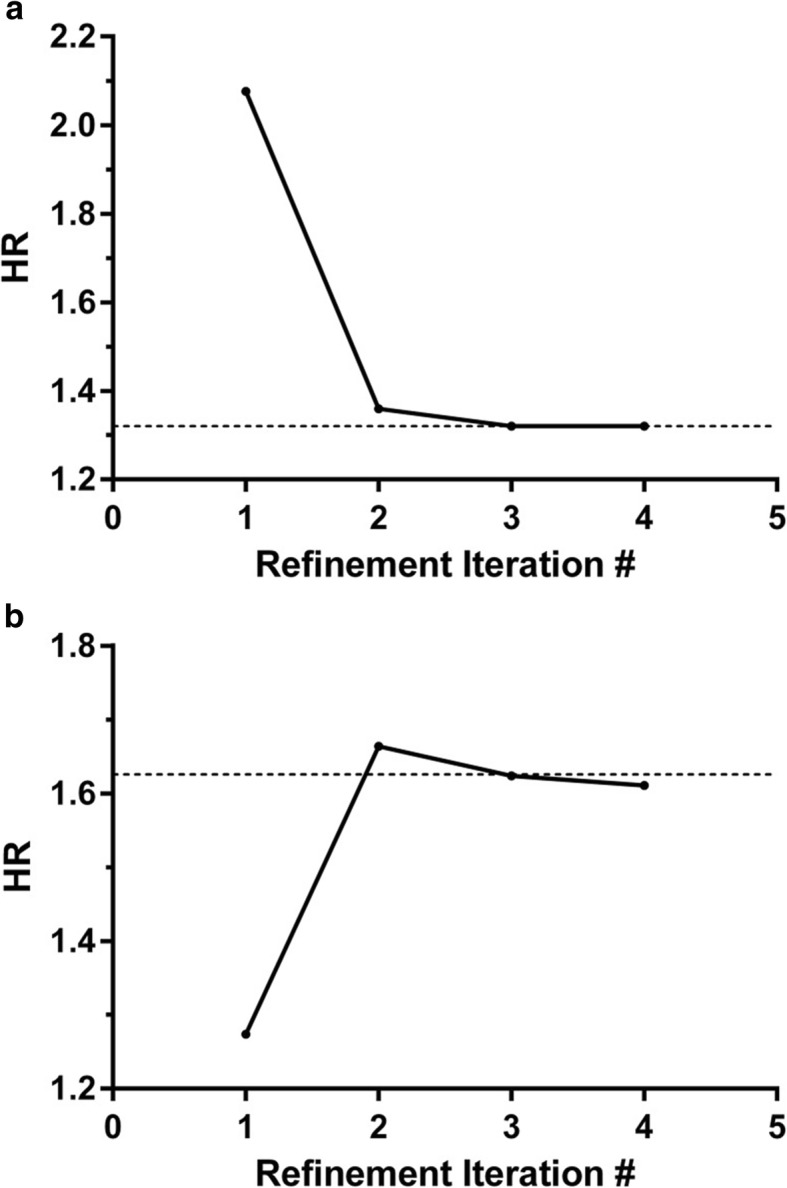
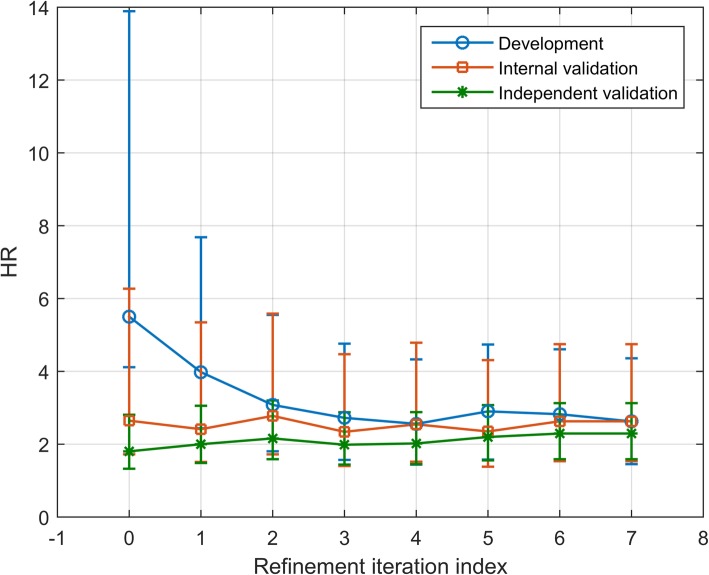
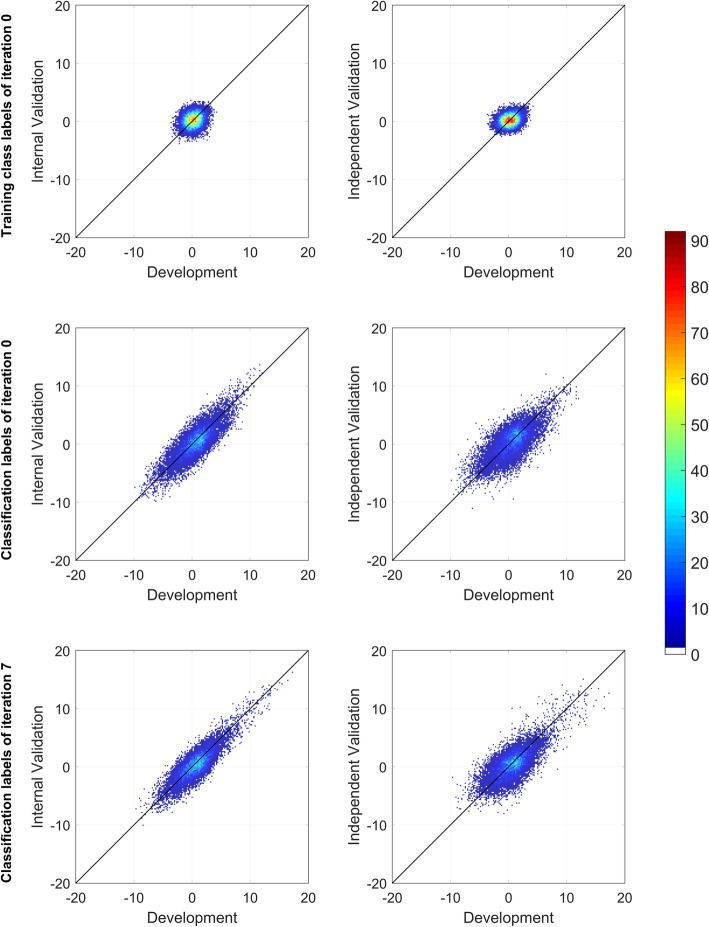
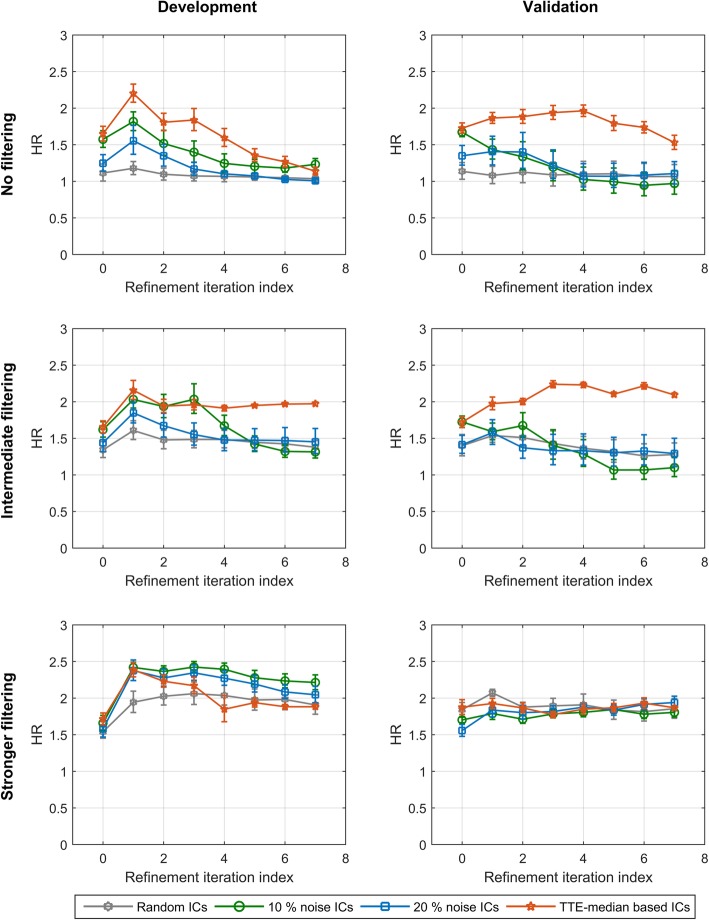
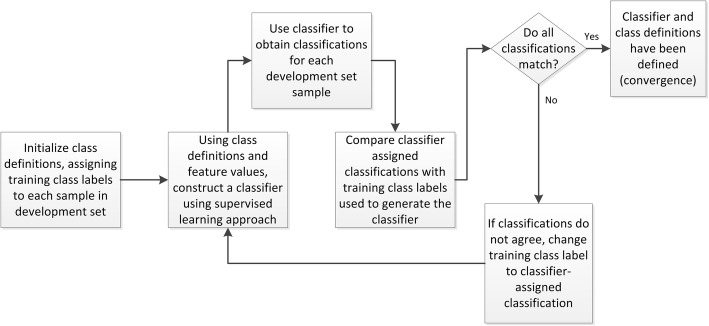
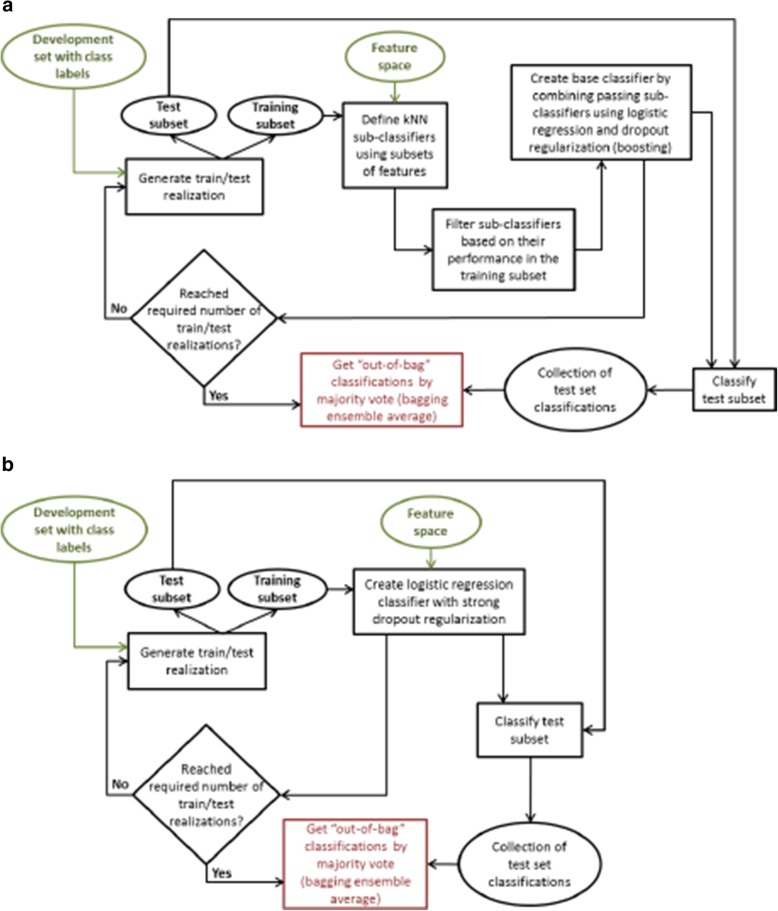
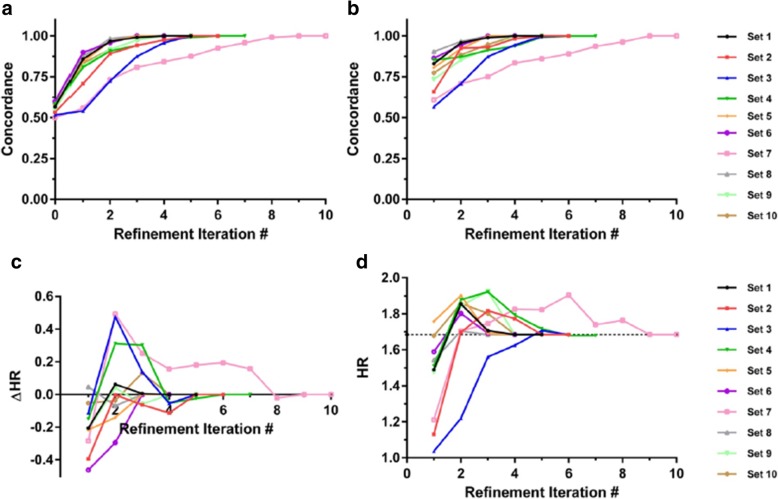
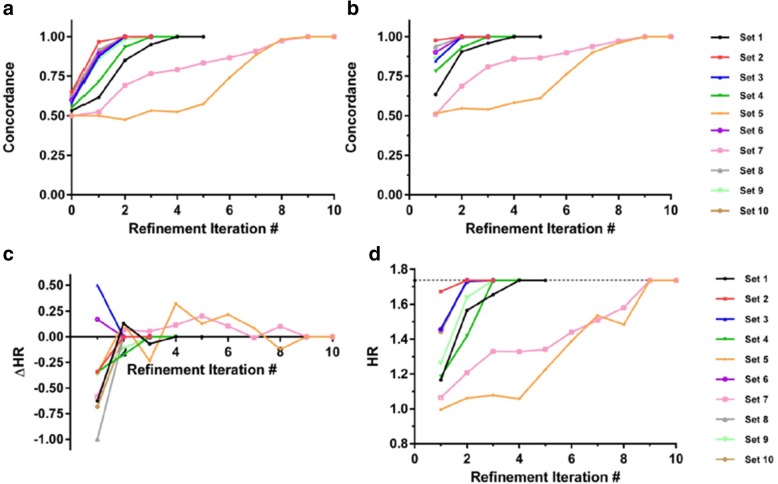
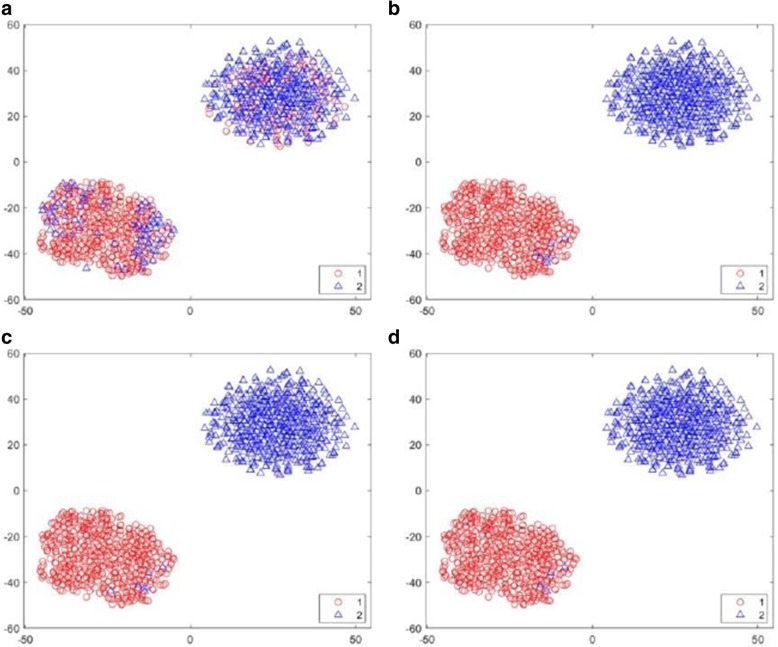
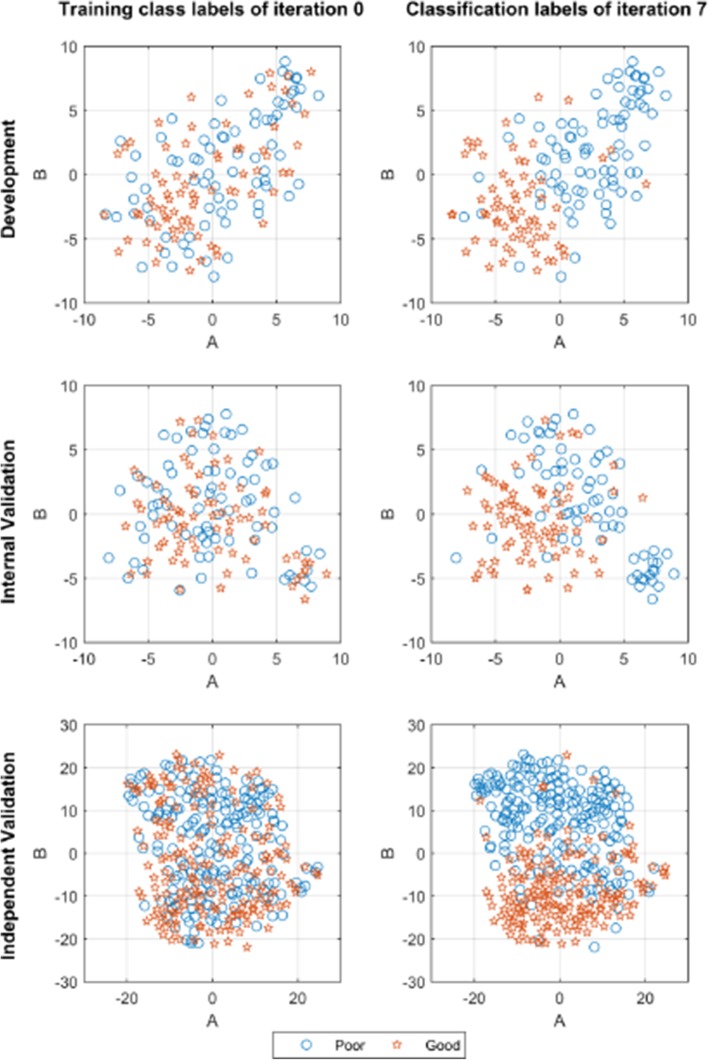
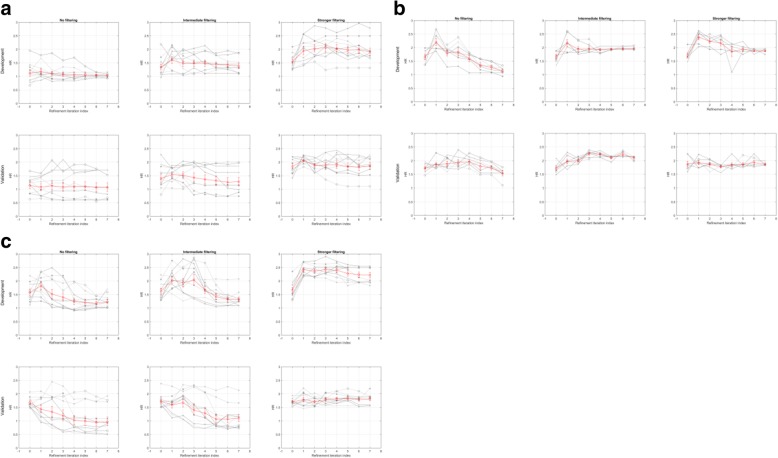
Results: We introduce an iterative approach to binary classification tasks based on the simultaneous refinement of training class labels and classifiers towards self-consistency. As training labels are refined during the process, the method is well suited to cases where training class definitions are not obvious or noisy. Clinical data, including time-to-event endpoints, can be incorporated into the approach to enable the iterative refinement to identify molecular phenotypes associated with a particular clinical variable. Using synthetic data, we show how this approach can be used to increase the accuracy of identification of outcome-related phenotypes and their associated molecular attributes. Further, we demonstrate that the advantages of the method persist in real world genomic datasets, allowing the reliable identification of molecular phenotypes and estimation of their association with outcome that generalizes to validation datasets. We show that at convergence of the iterative refinement, there is a consistent incorporation of the molecular data into the classifier yielding the molecular phenotype and that this allows a robust identification of associated attributes and the underlying biological processes.

Conclusions: The consistent incorporation of the structure of the molecular data into the classifier helps to minimize overfitting and facilitates not only good generalization of classification and molecular phenotypes, but also reliable identification of biologically relevant features and elucidation of underlying biological processes.

Keywords: Clustering; Machine learning; Molecular phenotype; Semi-supervised learning.


Conflict of interest statement

JR and HR are inventors on patents describing the DRC classifier development approach and the simultaneous iterative refinement of classifier and class phenotypes assigned to Biodesix, Inc. All authors are current or former employees of and have or had stock options in Biodesix, Inc.

Figures

Fig. 1
Fig. 1
Performance of the iterative refinement approach on synthetic data with α = 1 for NA = NB = 60. For each development set realization the IRA was applied. At each refinement iteration, the classifiers were applied to their development set realization and the independent validation set. Concordance of classifier-derived phenotype with true phenotype is shown for (a) the ten development set realizations, and (b) the validation set, for all ten development set realizations as a function of refinement iteration. The difference between the hazard ratio for classifier-derived phenotypes and the hazard ratio for phenotype A vs phenotype B in the development sets, ∆HR, is shown in (c) as a function of refinement iteration. The hazard ratios for classifier-derived phenotypes in the validation set as a function of refinement iteration are shown in (d). The value of the hazard ratio in the validation set for phenotype A vs B (HR = 1.63) is indicated by the dashed line. The crossed open circle indicates lack of convergence after ten refinement iterations
Fig. 2
Fig. 2
Performance of the iterative refinement approach on synthetic data with α = 0.8 for NA = NB = 60
Fig. 3
Fig. 3
t-SNE plots for iterative refinement until convergence (α = 1, NA = NB = 60, development set realization 1)
Fig. 4
Fig. 4
Performance of the iterative refinement approach with feature selection
Fig. 5
Fig. 5
RFS HR between classifier-defined phenotypes as a function of refinement iteration
Fig. 6
Fig. 6
Bivariate histogram of the t-test statistics obtained for the mRNA expression attributes
Fig. 7
Fig. 7
Average hazard ratio for each set of realizations of initial training class labels at each refinement iteration
Fig. 8
Fig. 8
Schema showing the process of simultaneous refinement of training class labels and classifier
Fig. 9
Fig. 9
a:  Architecture of dropout-regularized combination classifier, b: Architecture of bagged logistic regression classifier
Fig. 10
Fig. 10
Development sets results for synthetic datasets with ratio of phenotype A:B of 30:90 and α = 1. For each development set realization the IRA was applied. At each refinement iteration, the classifiers were applied to their development set realization and the independent validation set. Concordance of classifier-derived phenotype with true phenotype is shown for (a) the ten development set realizations, and (b) the validation set, for all ten development set realizations as a function of refinement iteration. The difference between the hazard ratio for classifier-derived phenotypes and the hazard ratio for phenotype A vs phenotype B in the development sets, ∆HR, is shown in (c) as a function of refinement iteration. The hazard ratios for classifier-derived phenotypes in the validation set as a function of refinement iteration are shown in (d). The value of the hazard ratio in the validation set for phenotype A vs B (HR = 1.68) is indicated by the dashed line
Fig. 11
Fig. 11
Development sets results for synthetic datasets with ratio of phenotype A:B of 90:30 and α = 1. For each development set realization the IRA was applied. At each refinement iteration, the classifiers were applied to their development set realization and the independent validation set. Concordance of classifier-derived phenotype with true phenotype is shown for (a) the ten development set realizations, and (b) the validation set, for all ten development set realizations as a function of refinement iteration. The difference between the hazard ratio for classifier-derived phenotypes and the hazard ratio for phenotype A vs phenotype B in the development sets, ∆HR, is shown in (c) as a function of refinement iteration. The hazard ratios for classifier-derived phenotypes in the validation set as a function of refinement iteration are shown in (d). The value of the hazard ratio in the validation set for phenotype A vs B (HR = 1.74) is indicated by the dashed line
Fig. 12
Fig. 12
t-SNE plots for the initial training class labels and the classifications at each refinement iteration. Results are shown for the 1000 instance validation set (α = 1, NA = NB = 60) for the IRA using development set realization 1 for a) initial training class labels, b) classifier-derived phenotypes using initial training class labels (refinement iteration 1), c) classifier-derived phenotypes using training class labels from refinement iteration 1 (“refinement iteration 2”), d) classifier-derived phenotypes at convergence at refinement iteration 3. x and y axes show arbitrary scales of the two t-SNE components
Fig. 13
Fig. 13
t-SNE plots for the initial training class labels and the classifications at refinement iteration 7 for the development set, the internal validation set, and the independent validation set
Fig. 14
Fig. 14
Hazard ratio as a function of refinement iteration for the three filtering settings for the individual initial condition realizations (grey) and their average (red) for: a – random initial conditions, b – TTE median-based initial conditions, c – 10% noise initial conditions, d – 20% noise initial conditions. Error bars show standard error

References

    1. Eisen MB, Spellman PT, Brown PO, Botstein D. Cluster analysis and display of genome-wide expression patterns. Proc Natl Acad Sci U S A. 1998;95(25):14863–14868. doi: 10.1073/pnas.95.25.14863. - DOI - PMC - PubMed
    1. Sotiriou C, Neo S, McShane LM, Korn EL, Long PM, Jazaeri A, Martiat P, Fox SB, Harris AL, Liu ET. Breast cancer classification and prognosis based on gene expression profiles from a population-based study. Proc Natl Acad Sci U S A. 2003;100(18):10393–10398. doi: 10.1073/pnas.1732912100. - DOI - PMC - PubMed
    1. TIBSHIRANI ROBERT. THE LASSO METHOD FOR VARIABLE SELECTION IN THE COX MODEL. Statistics in Medicine. 1997;16(4):385–395. doi: 10.1002/(SICI)1097-0258(19970228)16:4<385::AID-SIM380>3.0.CO;2-3. - DOI - PubMed
    1. Gui J., Li H. Penalized Cox regression analysis in the high-dimensional and low-sample size settings, with applications to microarray gene expression data. Bioinformatics. 2005;21(13):3001–3008. doi: 10.1093/bioinformatics/bti422. - DOI - PubMed
    1. Simon N, Freidman JH, Hastie T, Tibshirani R. Regularization paths for Cox’s proportional hazards model via coordinate descent. J Stat Softw. 2011;39:1–13. doi: 10.18637/jss.v039.i05. - DOI - PMC - PubMed

LinkOut - more resources