

A subnational profiling analysis reveals regional differences as the main predictor of ITN ownership and use in Nigeria
- PMID: 31138216
- PMCID: PMC6540480
- DOI: 10.1186/s12936-019-2816-9
A subnational profiling analysis reveals regional differences as the main predictor of ITN ownership and use in Nigeria
Abstract
Background: To reduce the malaria burden in Nigeria, the country is scaling up prevention and treatment interventions, especially household ownership and use of insecticide-treated nets (ITNs). Nevertheless, large gaps remain to achieve the goals of the National Malaria Strategic Plan 2014-2020 of universal access to ITNs and their increased use. To inform the targeting of intervention strategies and to maximize impact, the authors conducted a sub-national profiling of household ITN ownership and use in the general population to identify key predictors of ITN ownership and use, and the sub-groups that are at higher risk of low ITN coverage and use.
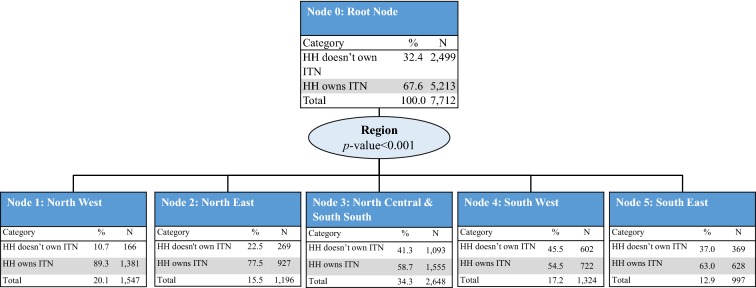
Methods: The authors conducted a secondary analysis of data from the 2015 Nigeria Malaria Indicator Survey. Using the Chi square automatic interaction detector (CHAID) and multiple logistic regression analysis, the authors examined the key predictors of ITN ownership and use in the general population throughout Nigeria.
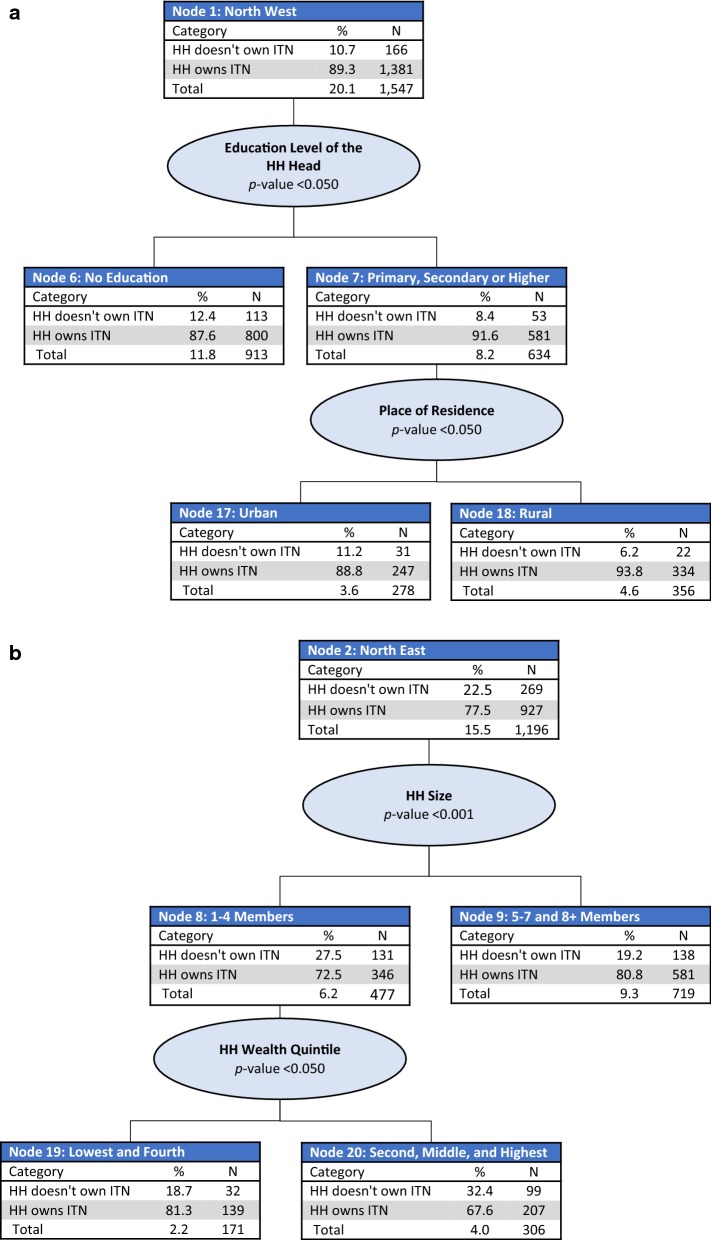
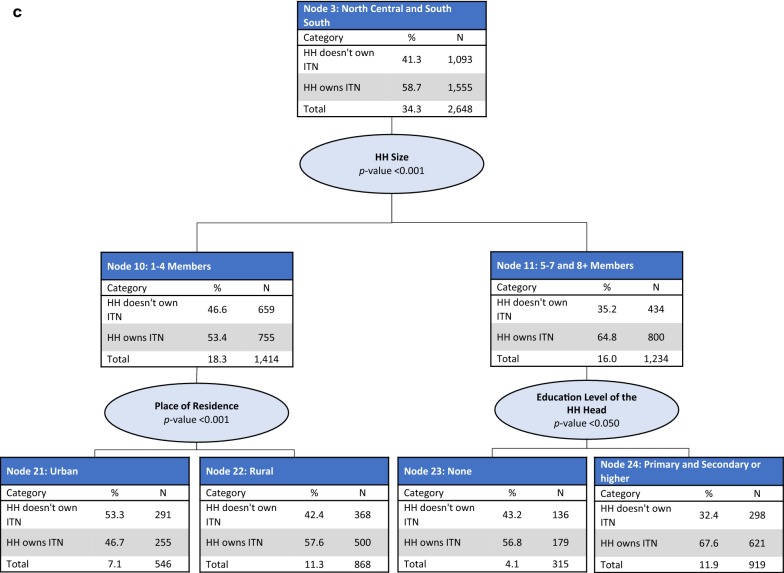
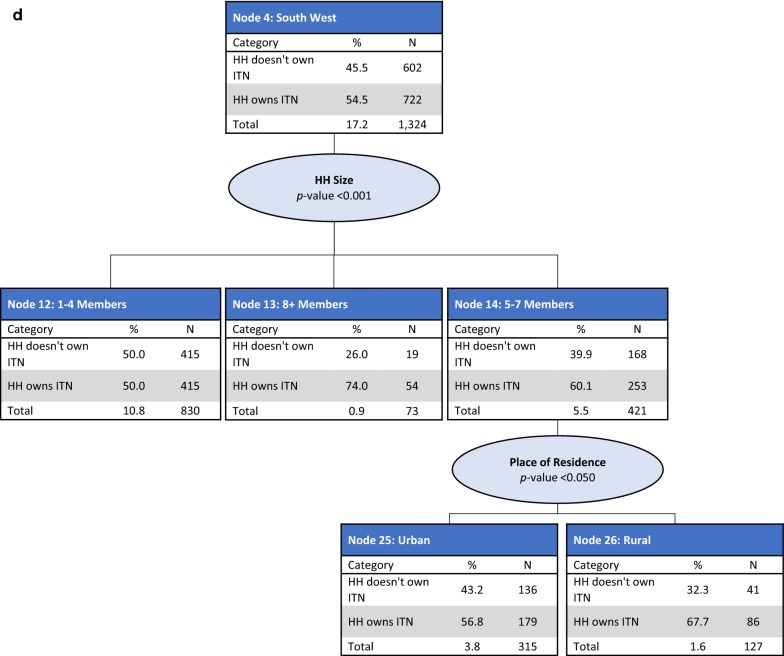
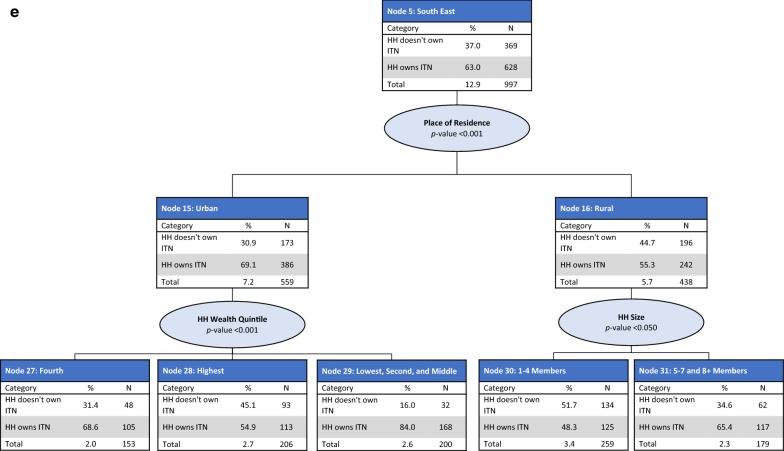
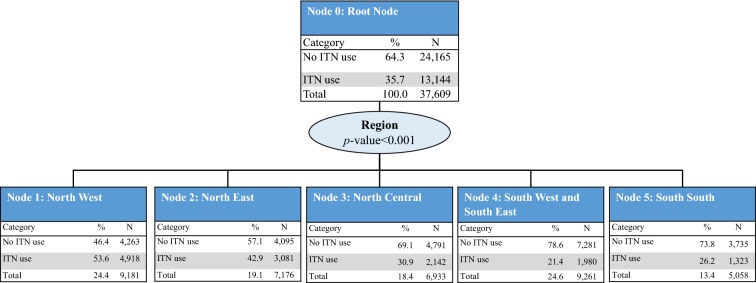
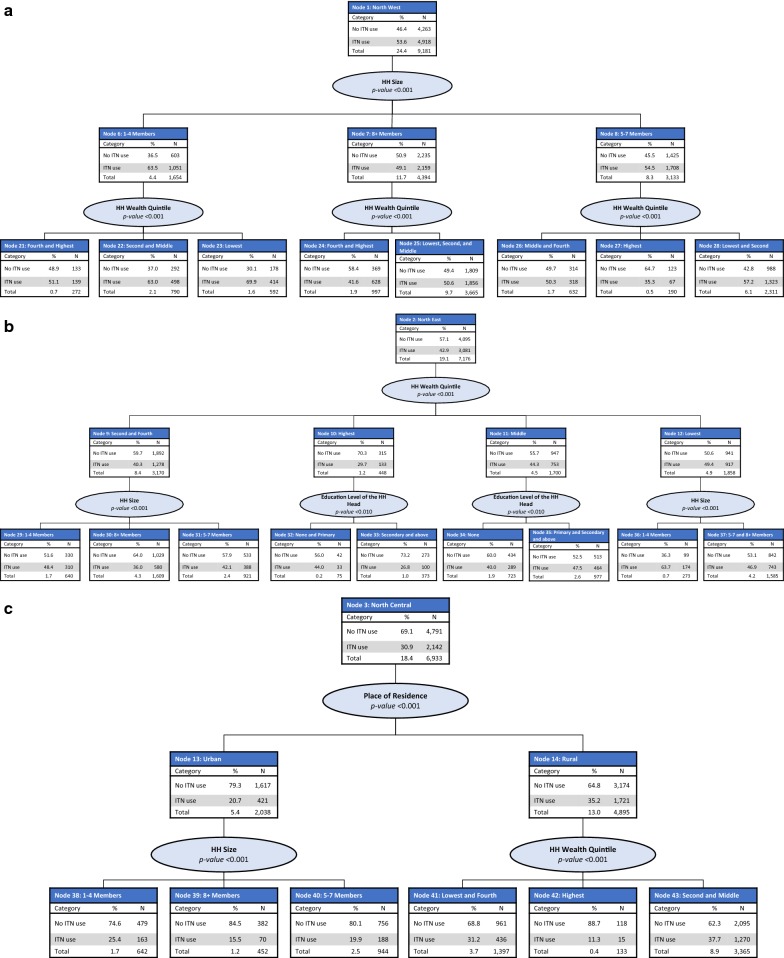
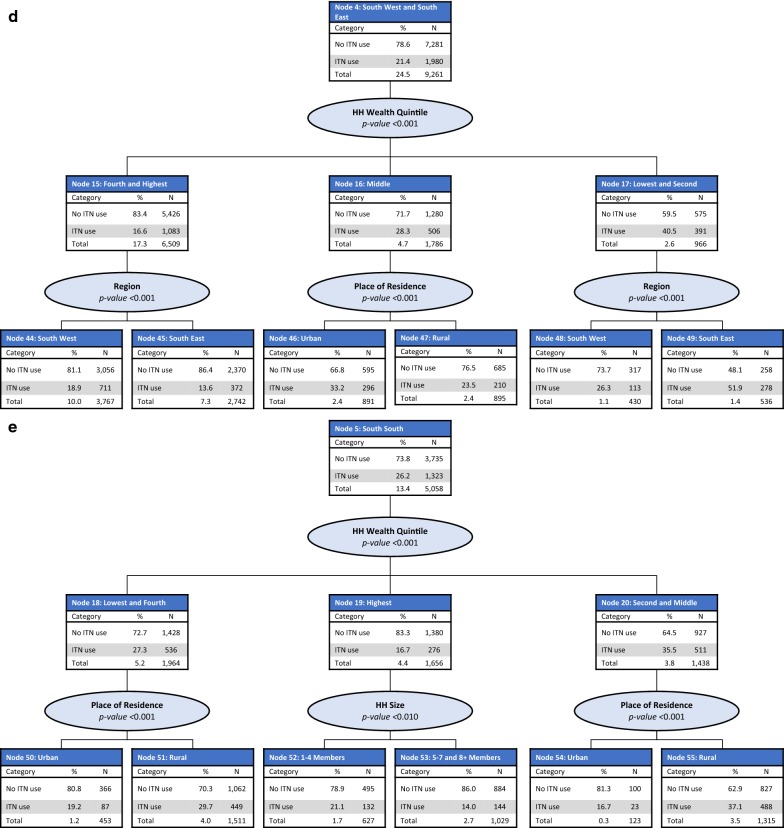
Results: The CHAID models identified region of the country as the best predictor of household ownership of at least one ITN and its use in the general population, with higher ownership and use observed in the northern regions. The odds of a household owning an ITN were five times greater in the North West region compared with the North Central region (odds ratio [OR] = 5.47, 95% confidence interval [CI] 4.46-6.72, p < 0.001). The odds of ITN use were two times greater for those living in the North West region compared with the North Central region (OR = 2.04, 95% CI 1.73-2.41, p < 0.001). Other significant predictors were household size, head of household education level, household wealth quintile, and place of residence. The CHAID gain index results identified households in the South West, North Central and South Central regions with low ITN ownership, and the general population in the South South, South East and North Central regions with low ITN use.
Conclusions: This study reveals regional differences in ITN ownership and use in Nigeria. Therefore, the findings from this analysis provide evidence that could inform the NMEP to better target future campaign and routine distribution of ITNs, to achieve universal access and increased use by 2020 in Nigeria.
Keywords: Chi square automatic interaction detection; Insecticide-treated nets; Malaria prevention and treatment; Net use; Nigeria; Sub-Saharan Africa.
Conflict of interest statement
The authors declare that they have no competing interests.
Figures
References
-
- WHO . World malaria report 2015. Geneva: World Health Organization; 2015.
-
- WHO . World malaria report 2017. Geneva: World Health Organization; 2017.
-
- National Malaria Elimination Programme, National Population Commission, National Bureau of Statistics, ICF. Nigeria Malaria Indicator Survey 2015. Abuja, Nigeria, 2016.
-
- Lengeler C. Insecticide-treated bed nets and curtains for preventing malaria. Cochrane Database Syst Rev. 2004;2:CD000363. - PubMed
-
- National Population Commission Nigeria, Macro I. Nigeria Demographic and Health Survey 2008. Abuja, Nigeria, 2009.
MeSH terms
Grants and funding
LinkOut - more resources
Full Text Sources
Medical
