. 2019 May:841:49-56.
doi: 10.1016/j.mrgentox.2019.05.006. Epub 2019 May 15.

Concentration-response studies of the chromosome-damaging effects of topoisomerase II inhibitors determined in vitro using human TK6 cells

Affiliations

Concentration-response studies of the chromosome-damaging effects of topoisomerase II inhibitors determined in vitro using human TK6 cells

P Gollapudi et al. Mutat Res Genet Toxicol Environ Mutagen. 2019 May.

Abstract

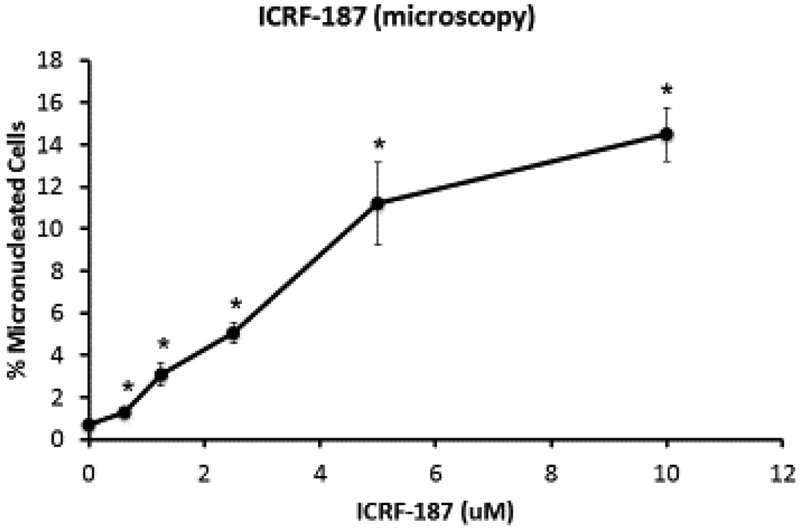
Topoisomerase II (topo II) inhibitors are commonly used as chemotherapy to treat multiple types of cancer, though their use is also associated with the development of therapy related acute leukemias. While the chromosome-damaging effects of etoposide, a topo II poison, have been proposed to act through a threshold mechanism, little is known about the chromosome damaging effects and dose responses for the catalytic inhibitors of the enzyme. The current study was designed to further investigate the potencies and concentration-response relationships of several topoisomerase II inhibitors, including the topoisomerase II poison etoposide, as well as catalytic inhibitors aclarubicin, merbarone, ICRF-154 and ICRF-187 using both a traditional in vitro micronucleus assay as well as a flow-cytometry based version of the assay. Benchmark dose (BMD) analysis was used to identify models that best fit the data and estimate a BMD, in this case the concentration at which a one standard deviation increase above the control frequency would be expected. All of the agents tested were potent in inducing micronuclei in human lymphoblastoid TK6 cells, with significant increases seen at low micromolar, and in the cases of aclarubicin and etoposide, at low nanomolar concentrations. Use of the anti-kinetochore CREST antibody with the microscopy-based assay demonstrated that the vast majority of the micronuclei originated from chromosome breakage. In comparing the two versions of the micronucleus assay, significant increases in micronucleated cells were observed at similar or lower concentrations using the traditional microscopy-based assay. BMD modeling of the data exhibited several advantages and proved to be a valuable alternative for concentration-response analysis, producing points of departure comparable to those derived using traditional no-observed or lowest-observed genotoxic effect level (NOGEL or LOGEL) approaches.

Keywords: Benchmark dose; Dose-response; Flow cytometry; Human cells; Micronucleus; Topoisomerase II inhibitors.


Conflict of interest statement

Declaration of interest: None

Figures

Figure 1.
Figure 1.
Topo II catalytic cycle. The sites of action of the topo II inhibitors used in current study are shown. Adapted from Mondrala and Eastmond (5).
Figure 2
Figure 2
A. Percent micronuclei in TK6 cells treated with aclarubicin measured using an in vitro flow cytometry-based micronucleus assay. B. Frequency of total micronucleated cells using a microscopy-based assay. *Statistically significant vs. the DMSO controls (P ≤ 0.05; Dunnett’s T-test for the flow results; and Fisher’s exact test for the manual scoring).
Figure 2
Figure 2
A. Percent micronuclei in TK6 cells treated with aclarubicin measured using an in vitro flow cytometry-based micronucleus assay. B. Frequency of total micronucleated cells using a microscopy-based assay. *Statistically significant vs. the DMSO controls (P ≤ 0.05; Dunnett’s T-test for the flow results; and Fisher’s exact test for the manual scoring).
Figure 3
Figure 3
A. Percentages of micronuclei in TK6 cells treated with merbarone measured using a flow cytometry-based micronucleus assay. B. Frequency of total micronucleated cells using a microscopy-based assay. *Statistically significant vs. the DMSO controls (P ≤ 0.05; Dunnett’s T-test for the flow results; and Fisher’s exact test for the manual scoring).
Figure 3
Figure 3
A. Percentages of micronuclei in TK6 cells treated with merbarone measured using a flow cytometry-based micronucleus assay. B. Frequency of total micronucleated cells using a microscopy-based assay. *Statistically significant vs. the DMSO controls (P ≤ 0.05; Dunnett’s T-test for the flow results; and Fisher’s exact test for the manual scoring).
Figure 4
Figure 4
A. Percentages of micronuclei in TK6 cells treated with etoposide measured using a flow cytometry-based micronucleus assay. B. Frequency of total micronucleated cells using a microscopy-based assay. *Statistically significant vs. the DMSO controls (P ≤ 0.05; Dunnett’s T-test for the flow results; and Fisher’s exact test for the manual scoring).
Figure 4
Figure 4
A. Percentages of micronuclei in TK6 cells treated with etoposide measured using a flow cytometry-based micronucleus assay. B. Frequency of total micronucleated cells using a microscopy-based assay. *Statistically significant vs. the DMSO controls (P ≤ 0.05; Dunnett’s T-test for the flow results; and Fisher’s exact test for the manual scoring).
Figure 5
Figure 5
A. Percentages of micronuclei in TK6 cells treated with ICRF 154 measured using a flow cytometry-based micronucleus assay. B. Frequency of total micronucleated cells using a microscopy-based assay. *Statistically significant vs. the DMSO controls (P ≤ 0.05; Dunnett’s T-test for the flow results; and Fisher’s exact test for the manual scoring).
Figure 5
Figure 5
A. Percentages of micronuclei in TK6 cells treated with ICRF 154 measured using a flow cytometry-based micronucleus assay. B. Frequency of total micronucleated cells using a microscopy-based assay. *Statistically significant vs. the DMSO controls (P ≤ 0.05; Dunnett’s T-test for the flow results; and Fisher’s exact test for the manual scoring).
Figure 6
Figure 6
A. Percentages of micronuclei in TK6 cells treated with ICRF 154 measured using a flow cytometry-based micronucleus assay. B. Frequency of total micronucleated cells using a microscopy-based assay. *Statistically significant vs. the DMSO controls (P ≤ 0.05; Dunnett’s T-test for the flow results; and Fisher’s exact test for the manual scoring).
Figure 7
Figure 7
A-E. Frequency of micronucleated cells in TK6 cells treated with the tested topo II inhibitors measured using a in vitro microscopy-based micronucleus assay are represented in the bar graph as percent micronucleated cells (# per hundred). The percentages of micronucleated cells originating from chromosome loss (kinetochore-positive (K+)) and chromosome breakage (kinetochore-negative (K-)) are also shown. The means and standard deviations are shown. *Statistically significant vs. the DMSO controls (Fisher’s exact test; P ≤ 0.05).
Figure 7
Figure 7
A-E. Frequency of micronucleated cells in TK6 cells treated with the tested topo II inhibitors measured using a in vitro microscopy-based micronucleus assay are represented in the bar graph as percent micronucleated cells (# per hundred). The percentages of micronucleated cells originating from chromosome loss (kinetochore-positive (K+)) and chromosome breakage (kinetochore-negative (K-)) are also shown. The means and standard deviations are shown. *Statistically significant vs. the DMSO controls (Fisher’s exact test; P ≤ 0.05).

Similar articles

References

    1. Pendleton M, Lindsey RH Jr, Felix CA, Grimwade D, Osheroff N. Topoisomerase II and leukemia. Ann N Y Acad Sci 2014;1310: 98–110 - PMC - PubMed
    1. McClendon AK, Osheroff N. DNA topoisomerase II, genotoxicity, and cancer. Mutat Res. 2007;623: 83–97. - PMC - PubMed
    1. Deweese JE, Osheroff N. The DNA cleavage reaction of topoisomerase II: wolf in sheep’s clothing. Nucleic Acids Res. 2009;37: 738–748. - PMC - PubMed
    1. Vos SM, Tretter EM, Schmidt BH, Berger JM. All tangled up: how cells direct, manage and exploit topoisomerase function. Nat Rev Mol Cell Biol. 2011;12: 827–841. - PMC - PubMed
    1. Mondrala S, Eastmond DA. Topoisomerase II inhibition by the bioactivated benzene metabolite hydroquinone involves multiple mechanisms. Chem Biol Interact. 2010;184: 259–268. - PubMed

Publication types

MeSH terms