. 2019 May 28;10(1):2340.
doi: 10.1038/s41467-019-10275-0.

SORLA regulates endosomal trafficking and oncogenic fitness of HER2

Affiliations

SORLA regulates endosomal trafficking and oncogenic fitness of HER2

Mika Pietilä et al. Nat Commun. .

Abstract

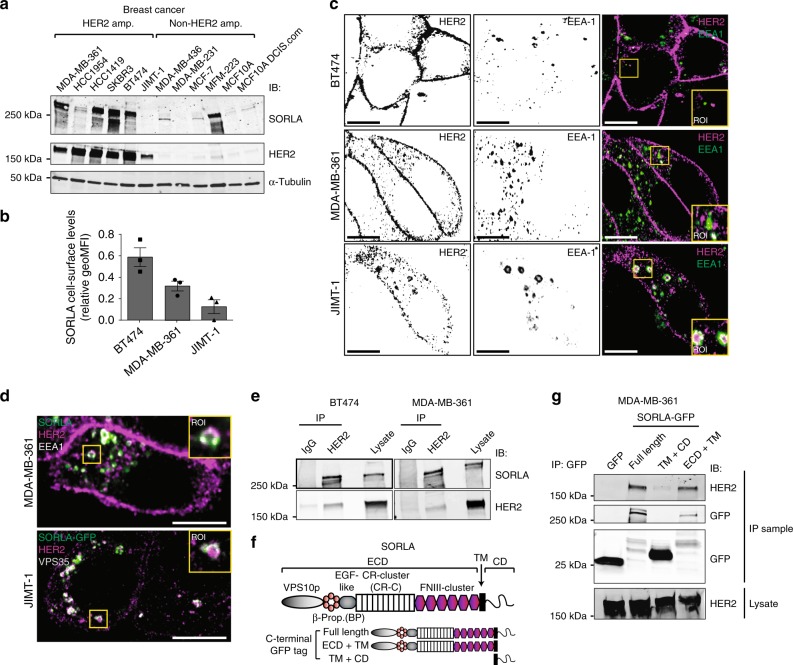
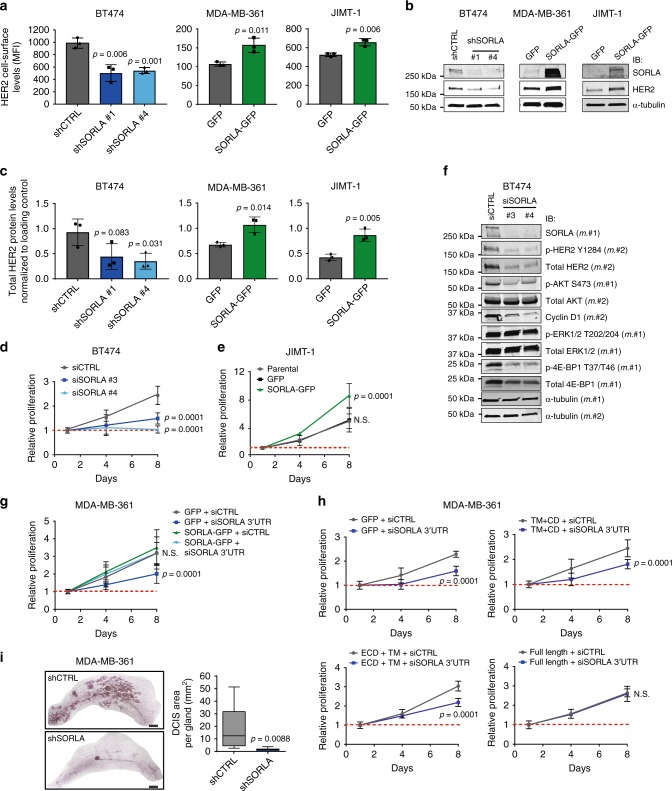
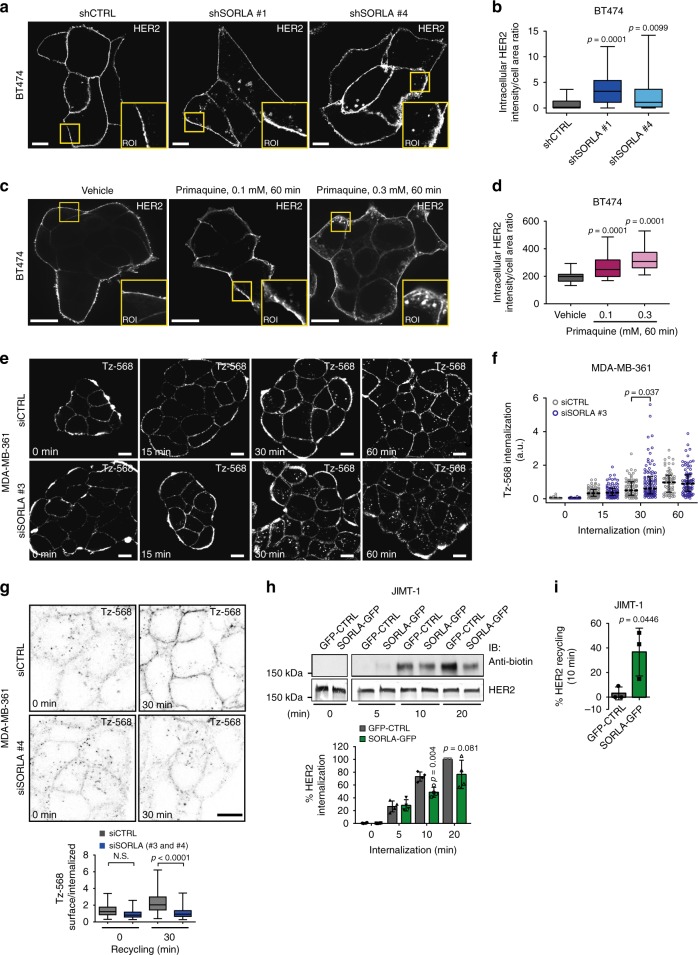
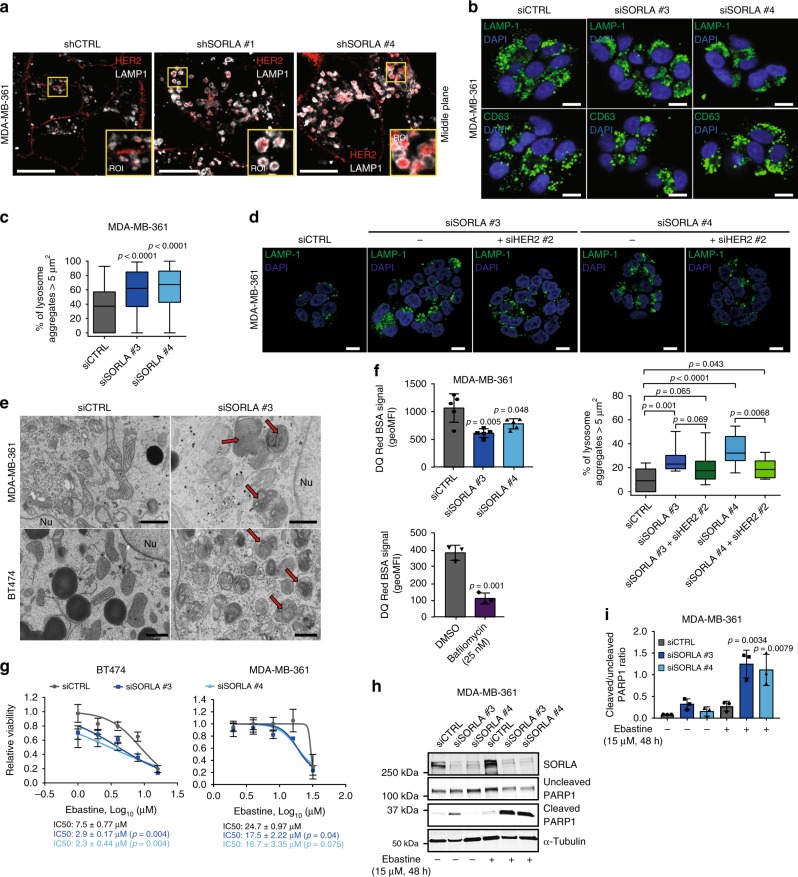
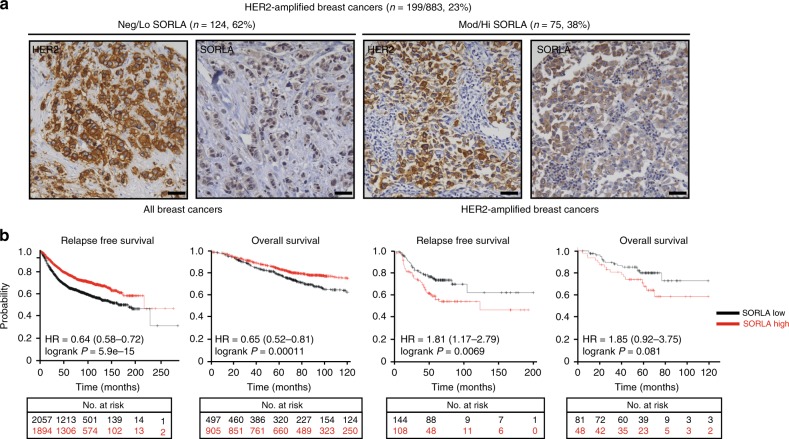
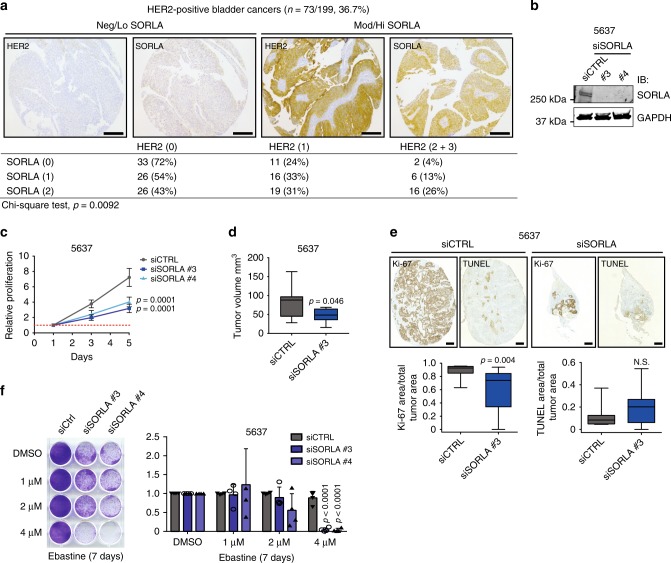
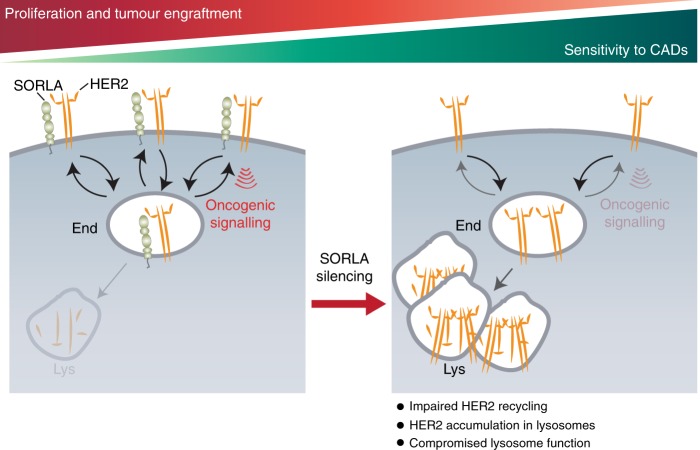
The human epidermal growth factor receptor 2 (HER2) is an oncogene targeted by several kinase inhibitors and therapeutic antibodies. While the endosomal trafficking of many other receptor tyrosine kinases is known to regulate their oncogenic signalling, the prevailing view on HER2 is that this receptor is predominantly retained on the cell surface. Here, we find that sortilin-related receptor 1 (SORLA; SORL1) co-precipitates with HER2 in cancer cells and regulates HER2 subcellular distribution by promoting recycling of the endosomal receptor back to the plasma membrane. SORLA protein levels in cancer cell lines and bladder cancers correlates with HER2 levels. Depletion of SORLA triggers HER2 targeting to late endosomal/lysosomal compartments and impairs HER2-driven signalling and in vivo tumour growth. SORLA silencing also disrupts normal lysosome function and sensitizes anti-HER2 therapy sensitive and resistant cancer cells to lysosome-targeting cationic amphiphilic drugs. These findings reveal potentially important SORLA-dependent endosomal trafficking-linked vulnerabilities in HER2-driven cancers.


Conflict of interest statement

H.S. and H.J. own stocks of Sartar Therapeutics and are board members. H.J. has a co-appointment at Orion Pharma, and has received fees from Orion Pharma and Neutron Therapeutics Ltd. J.I., M.P., and P.S. have filed a patent application related to these findings. The remaining authors declare no competing interests.

Figures

Fig. 1
Fig. 1
SORLA is highly expressed in HER2-amplified breast cancer cells and co-traffics with HER2. a Western blot analysis of SORLA and HER2 protein levels in breast cancer cell lines. α-tubulin is a loading control. b Quantification of SORLA cell-surface levels by FACS in MDA-MB-361, BT474 and JIMT-1 cells (n = 3 independent experiments; data are geo mean fluorescence intensity (MFI) ± standard error of mean (s.e.m.). c Confocal microscopy imaging of HER2 (magenta) and EEA-1 (green) in BT474, MDA-MB-361 and JIMT-1 cells. Co-localisation of the HER2 and EEA1 signals is indicated in white in the merged panels. d Endogenous SORLA (green), HER2 (magenta) and EEA-1 (white) staining in MDA-MB-361 cells (top panel). Endogenous HER2 (magenta) and VPS35 (white) staining in JIMT-1 cells expressing SORLA-GFP (green) (bottom panel). e Co-immunoprecipitation of endogenous SORLA with endogenous HER2 in MDA-MB-361 and BT474 cells. f Schematic of the SORLA protein domains and summary of the constructs used. g Co-immunoprecipitation of endogenous HER2 with different SORLA-GFP fragments in MDA-MB-361 cells. Scale bars: 10 µm. Where immunoblots and micrographs are shown, these are representative of n = 3 independent experiments; IB immunoblotting, IP immunoprecipitation. ECD extracellular domain, TM transmembrane domain, CD cytosolic domain
Fig. 2
Fig. 2
SORLA regulates HER2 cell-surface levels and oncogenic signalling in breast cancer cells. ac SORLA-high BT474 cells were subjected to shRNA-mediated control (shCTRL) or SORLA (shSORLA #1 and #4) silencing. SORLA-intermediate/low MDA-MB-361/JIMT-1 cells were transfected with SORLA-GFP or GFP alone. Flow cytometry analysis of cell-surface HER2 levels (a, MFI ± standard deviation (s.d.); n = 3 independent experiments), immunoblotting of total HER2 and SORLA, where α-tubulin is a loading control (b) and quantification of total HER2 protein levels relative to loading control (c) are shown (mean ± s.d.; n = 3 independent experiments; statistical analysis: unpaired Student’s t test). d Proliferation of BT474 cells after SORLA silencing with siRNAs (mean ± s.d. of n = 12, four technical replicates, three independent experiments; statistical analysis: two-way ANOVA). e Proliferation of parental, GFP control and SORLA-GFP overexpressing JIMT-1 cells (mean ± s.d. of n = 12, four technical replicates, three independent experiments; statistical analysis: two-way ANOVA). f Western blot analysis of the indicated signalling proteins (phosphorylated and total) in BT474 cells after scramble (siCTRL) and SORLA silencing (siSORLA #3 and siSORLA #4). α-tubulin is a loading control. m.#1 indicates membrane number 1 and m.#2 indicates membrane number 2 (n = 2 independent experiments). g Proliferation of MDA-MB-361 cells expressing SORLA-GFP or GFP-control after silencing with control siRNA (siCTRL) or siRNA against the 3′UTR of SORLA (siSORLA 3′UTR) (mean ± s.d. of n = 14 from four independent experiments, two-way ANOVA). h Proliferation of MDA-MB-361 cells expressing SORLA-GFP constructs (full-length, ECD-TM or TM-CD) after silencing with siCTRL or siSORLA 3′UTR (mean ± s.d. of n = 8 from two independent experiments; statistical analysis: two-way ANOVA). i Quantification of mammary DCIS tumours (Carnoy staining) 10 weeks after injection of shSORLA- and shCTRL-silenced MDA-MB-361 cells into the mammary ducts of NOD.SCID mice (box plot represents median and 25th and 75th percentiles—interquartile range; IQR—and whiskers extend to maximum and minimum values; n = 9 mice per group; statistical analysis: unpaired Student’s t test). Scale bars: 2 mm
Fig. 3
Fig. 3
SORLA promotes HER2 recycling. a, b Confocal microscopy images (a) and quantification (b) of HER2 staining after SORLA silencing (shSORLA #1 and shSORLA #4) in BT474 cells (n = 31 shCTRL, 25 shSORLA #1 and 20 shSORLA #4 cells from two experiments; analysis performed on 8-bit images; statistical analysis: Mann−Whitney test). c, d Confocal microscopy images (c) and quantification (d) of HER2 in vehicle- and primaquine-treated (60 min) BT474 cells (n = 34 (vehicle), 28 (0.1 mM primaquine) and 34 (0.3 mM primaquine) cells; analysis performed on 16-bit images; statistical analysis: Mann−Whitney test). e, f Microscopy analysis (e) and quantification (f) of AlexaFluor 568-labelled trastuzumab (Tz-568) internalization in MDA-MB-361 cells silenced with SORLA (siSORLA #3) or scramble (siCTRL) siRNA at the indicated time points (mean ± s.e.m; n = 64, 77, 86 and 64 siCTRL cells and 111, 83, 103 and 87 siSORLA #3 cells at the 0, 15, 30 and 60 min time points, respectively, from two independent experiments; statistical analysis: Mann−Whitney test; a.u. arbitrary units). g Microscopy-based HER2 recycling assay in control or SORLA siRNA-treated MDA-MB-361 cells. Labelled HER2 recycling back to the plasma membrane was monitored over 30 min after an internalization step (45 min) and imaged with a confocal microscope. Ratio of surface/internalized Tz-568 signal is displayed as box plots (n = 34 and 57 siCTRL cells and 45 and 47 siSORLA cells for 0 and 45 min time points, respectively, from two independent experiments; statistical analysis: Nonparametric Kruskal−Wallis). h Immunoblotting analysis of biotin-labelled cell-surface HER2 internalization in JIMT-1 cells overexpressing SORLA-GFP (or control GFP; GFP-CTRL), and quantification of internalized HER2 relative to total HER2 (data are mean ± s.d.; n = 4 independent experiments; statistical analysis: unpaired Student’s t test). i Quantification of HER2 recycling rate (% return of internalized biotinylated cell-surface HER2 back to the plasma membrane after 10 min) in JIMT-1 cells transfected with GFP-CTRL or SORLA-GFP following 30 min of endocytosis (data are mean ± s.d.; n = 3 independent experiments; statistical analysis: unpaired Student’s t test). Scale bars: 10 µm. Box plots represent median and IQR and whiskers extend to maximum and minimum values. Where micrographs are shown, these are representative of n = 3 independent experiments; ROI magnified region of interest
Fig. 4
Fig. 4
Silencing SORLA induces HER2 accumulation in dysfunctional lysosomes. a Immunofluorescence imaging of LAMP1 (white) and HER2 (red) in shCTRL and shSORLA MDA-MB-361 cells (n = 3 independent experiments). b Immunofluorescence imaging of LAMP1 (green) and CD63 (LAMP3; green) in MDA-MB-361 cells (blue is DAPI) after scramble (siCTRL) or SORLA (siSORLA #3 and siSORLA #4) siRNA silencing (n = 3 independent experiments). c Quantification of late endosomes/lysosome aggregation after SORLA silencing in MDA-MB-361 cells. LAMP1-positive structures ≥ 5 µm2 were considered as lysosome aggregates (n = 73 siCTRL, 79 siSORLA #3 and 67 siSORLA #4 cells from three independent experiments; statistical analysis: Mann−Whitney test). d Immunofluorescence imaging and quantification of lysosomal aggregation in MDA-MB-361 cells treated with the indicated siRNA (n fields of view analysed, total cells = 11, 131 (siCTRL); 12, 182 (siSORLA #3); 11, 169 (siSORLA #3 + siHER2 #2); 10, 133 (siSORLA #4); 10, 121 (siSORLA#4 + siHER2 #2) from two independent experiments; statistical analysis: Mann−Whitney test). e Transmission electron microscopy imaging of lysosomes in siCTRL or siSORLA MDA-MB-361 and BT474 cells. Red arrows indicate the maturation defect in late endosome/lysosome structures (n = 3 technical replicates). f Flow cytometry analysis of the fluorescence signal in DQ Red BSA-loaded (24 h) MDA-MB-361 cells after scramble (siCTRL) or SORLA (siSORLA #3 and siSORLA #4) silencing. Cells loaded with DQ Red BSA (4 h) and treated with bafilomycin (or vehicle) are included as controls (bafilomycin blocks lysosome function) (mean ± s.d.; n = 5 independent experiments; statistical analysis: unpaired Student’s t test). g Cell viability assay to determine ebastine (48 h treatment) IC50 values in SORLA- or control-silenced BT474 and MDA-MB-361 cells (mean ± s.d.; n = 12, four technical replicates, three independent experiments; statistical analysis: unpaired Student’s t test). h, i Immunoblotting (h) and quantification (i) of cleaved PARP1 in ebastine-treated (15 µM, 48 h) siCTRL and siSORLA #3 or siSORLA #4 MDA-MB-361 cells. α-tubulin is a loading control (mean ± s.d.; n = 3 independent experiments; statistical analysis: unpaired Student’s t test). Scale bars: 10 µm (a, b, d) and 1 µm (e). Box plots represent median and IQR and whiskers extend to maximum and minimum values. Nu nucleus
Fig. 5
Fig. 5
SORLA has a prognostic value in HER2-amplified breast cancer. a Immunohistochemical staining of SORLA and HER2 from a breast cancer tissue microarray (TMA; 883 patients in total). HER2-amplified tumours (199 patients) were categorized into negative/low (Neg/Lo) (staining intensity 0–1) and moderate/high (Mod/Hi) (staining intensity 2–3) groups. Numbers indicate staining intensity, 0 = negative, 1 = weak, 2 = moderate, 3 = high. b In silico biomarker assessment tool ((http://kmplot.com); including all datasets from 2010, 2012, 2014, 2017) analysis showing Kaplan−Meier plots of overall survival (OS; 10 years) and relapse-free survival (RFS; 20 years) of SORLA-high and SORLA-low patients (split by the best median cutoff) within all breast cancers (RFS n = 3955; OS n = 1402) and within HER2-amplified breast cancers (RFS n = 252; OS n = 129). Scale bars: 50 µm
Fig. 6
Fig. 6
SORLA expression correlates with HER2 and promotes tumorigenesis in bladder carcinoma. a Immunohistochemical staining of a bladder cancer TMA and correlation analyses of SORLA and HER2 levels. Numbers indicate staining intensity, 0 = negative, 1 = weak, 2 = moderate, 3 = high. b Western blot analysis of SORLA levels in siCTRL and siSORLA (siSORLA#3, siSORLA#4) 5637 bladder cancer cells. GAPDH is a loading control. c Analysis of siCTRL and siSORLA (siSORLA#3, siSORLA#4) 5637 cell proliferation (mean ± s.d; n = 4 independent experiments; statistical analysis: two-way ANOVA). d Analysis of tumour growth of subcutaneously injected 5637 cells, with transient SORLA (siSORLA #3) or scramble (siCTRL) silencing, at day 29 in nude mice (n = 9 siCTRL and 10 siSORLA mice; statistical analysis: unpaired Student’s t test). e Ki-67 and TUNEL staining of tumour samples prepared as described in d and quantifications displayed as box plots (n = 9 siCTRL and 10 siSORLA mice; statistical analysis: Mann−Whitney test). f Colony formation assay with SORLA-silenced and control-silenced 5637 cells treated with different concentrations of ebastine for 7 days. Quantification of confluency was performed using ImageJ Colony Area Plug-in. Results are shown as mean ± s.d. (n = 4 independent experiments; statistical analysis: unpaired Students t test). Scale bars: 200 µm (a), 500 µm (e). Box plots represent median and IQR and whiskers extend to maximum and minimum values
Fig. 7
Fig. 7
Schematic illustrating the role of SORLA in the oncogenic fitness of HER2 in cancer cells. SORLA, through interactions at its extracellular domain, is in a complex with HER2 and co-traffics with HER2, facilitating HER2 recycling to the plasma membrane to support HER2 downstream signalling. In the absence of SORLA, HER2 becomes localized to enlarged, partially dysfunctional lysosomes resulting in defective HER2 signalling and increased sensitivity to cationic amphiphilic drugs (CADs) like ebastine. End endosome, Lys lysosome

Comment in

References

    1. Joensuu H, et al. Adjuvant docetaxel or vinorelbine with or without trastuzumab for breast cancer. N. Engl. J. Med. 2006;354:809–820. doi: 10.1056/NEJMoa053028. - DOI - PubMed
    1. Slamon DJ, et al. Human breast cancer: correlation of relapse and survival with amplification of the HER-2/neu oncogene. Science. 1987;235:177–182. doi: 10.1126/science.3798106. - DOI - PubMed
    1. Bose R, et al. Activating HER2 mutations in HER2 gene amplification negative breast cancer. Cancer Discov. 2013;3:224–237. doi: 10.1158/2159-8290.CD-12-0349. - DOI - PMC - PubMed
    1. Lee JW, et al. Somatic mutations of ERBB2 kinase domain in gastric, colorectal, and breast carcinomas. Clin. Cancer Res. 2006;12:57–61. doi: 10.1158/1078-0432.CCR-05-0976. - DOI - PubMed
    1. Shigematsu H, et al. Somatic mutations of the HER2 kinase domain in lung adenocarcinomas. Cancer Res. 2005;65:1642–1646. doi: 10.1158/0008-5472.CAN-04-4235. - DOI - PubMed

Publication types

MeSH terms