. 2019 May 28;10(1):2252.
doi: 10.1038/s41467-019-10180-6.

The FANCM-BLM-TOP3A-RMI complex suppresses alternative lengthening of telomeres (ALT)

Affiliations

The FANCM-BLM-TOP3A-RMI complex suppresses alternative lengthening of telomeres (ALT)

Robert Lu et al. Nat Commun. .

Erratum in

Abstract

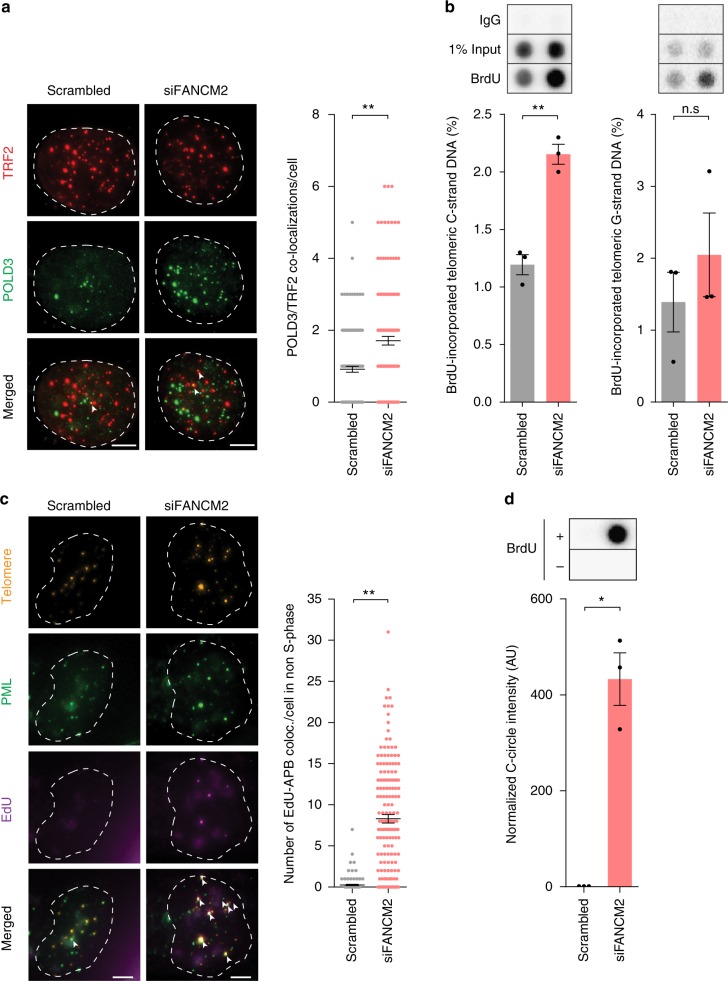
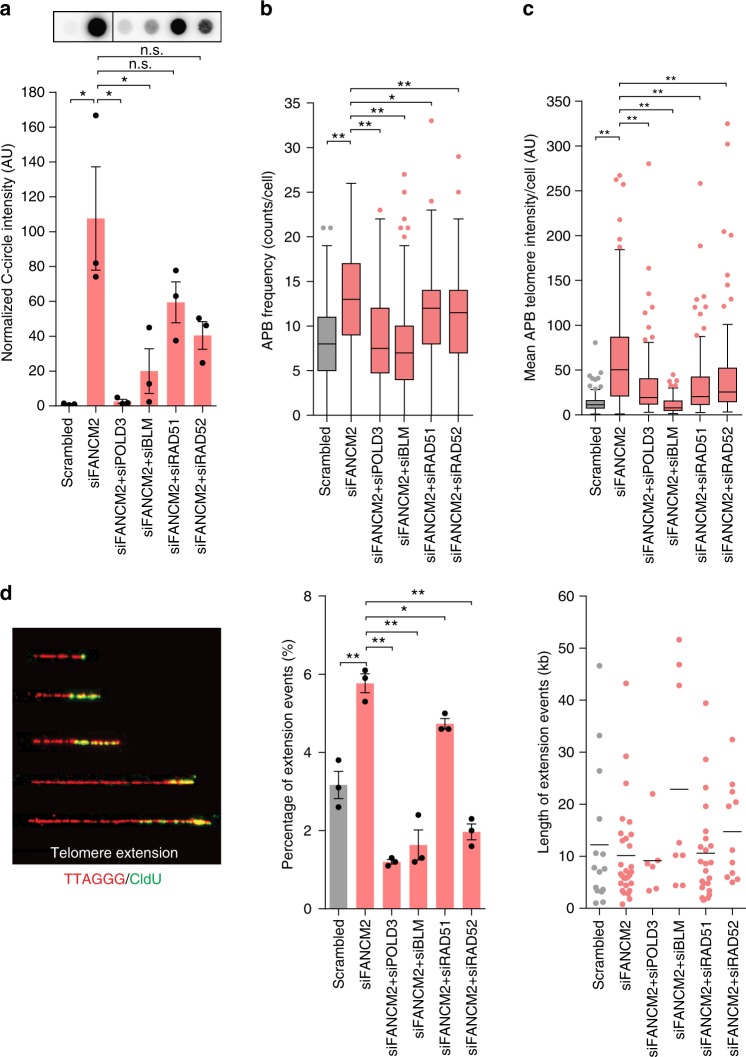
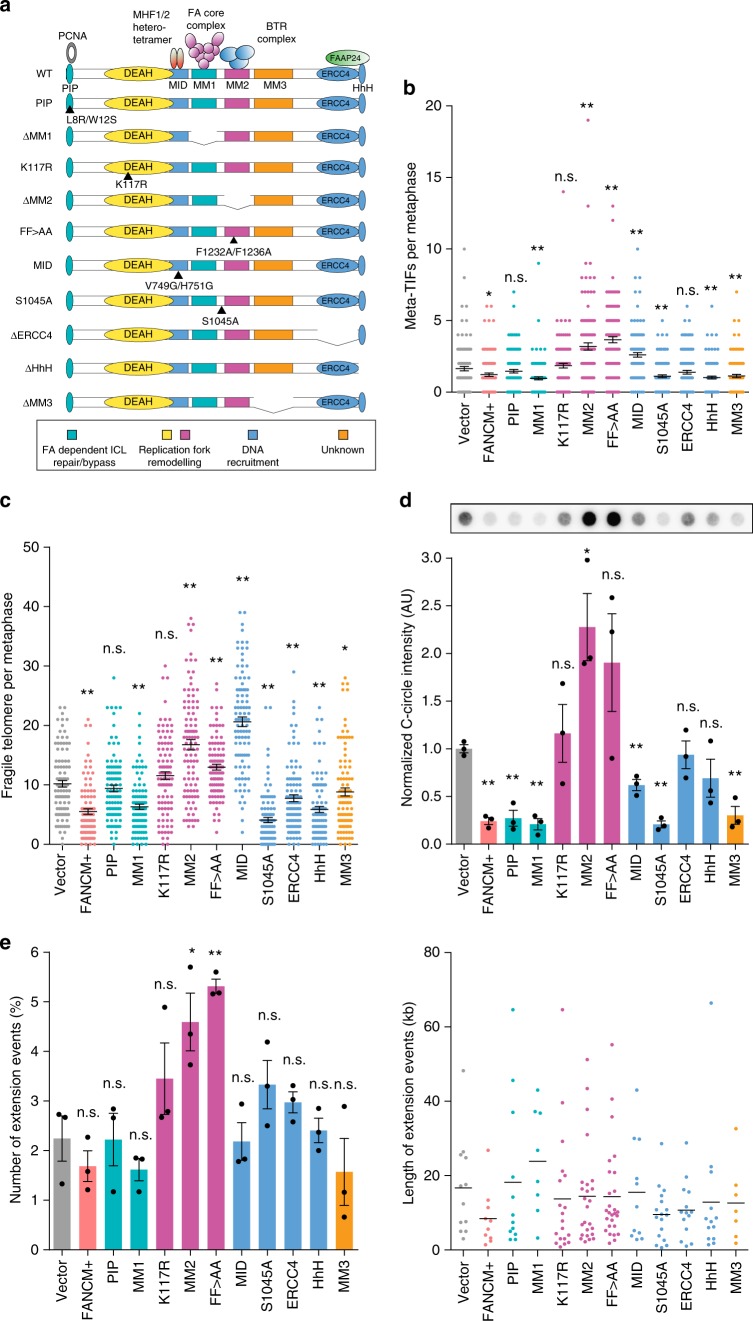
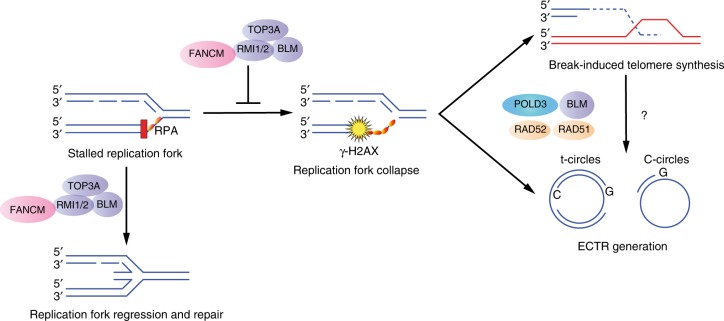
The collapse of stalled replication forks is a major driver of genomic instability. Several committed mechanisms exist to resolve replication stress. These pathways are particularly pertinent at telomeres. Cancer cells that use Alternative Lengthening of Telomeres (ALT) display heightened levels of telomere-specific replication stress, and co-opt stalled replication forks as substrates for break-induced telomere synthesis. FANCM is a DNA translocase that can form independent functional interactions with the BLM-TOP3A-RMI (BTR) complex and the Fanconi anemia (FA) core complex. Here, we demonstrate that FANCM depletion provokes ALT activity, evident by increased break-induced telomere synthesis, and the induction of ALT biomarkers. FANCM-mediated attenuation of ALT requires its inherent DNA translocase activity and interaction with the BTR complex, but does not require the FA core complex, indicative of FANCM functioning to restrain excessive ALT activity by ameliorating replication stress at telomeres. Synthetic inhibition of FANCM-BTR complex formation is selectively toxic to ALT cancer cells.


Conflict of interest statement

The authors declare no competing interests.

Figures

Fig. 1
Fig. 1
FANCM depletion results in telomere dysfunction and increased ALT activity. a Representative images of telomere (green) and γ-H2AX (red) colocalizations on metaphase spreads (meta-TIFs) in U-2 OS cells with or without FANCM depletion (left panel). Meta-TIFs are indicated by white arrows. Scale bars are 5 μm. Quantitation of TIFs (right panel). Scatterplot bars represent the mean ± SEM. Out of three experiments, n ≥ 81 metaphases scored per treatment, **p < 0.005, Mann–Whitney test. b Native and denatured TRF analysis of U-2 OS cells with or without FANCM depletion. Colored arrows correspond to telomeric DNA species depicted in c. c Schematic of migration patterns for indicated telomeric species separated by two-dimensional gel electrophoresis (left panel). Two-dimensional TRF analysis of U-2 OS cells with or without FANCM depletion, hybridized under native and denatured conditions to detect the telomeric C-strand and G-strand (center and right panels). Colored arrows correspond to telomeric DNA species depicted in schematic. d Representative dot blot and quantitation of C-circle assays in U-2 OS cells with or without FANCM depletion. C-circle levels were normalized to the mean of scrambled control. Error bars represent the mean ± SEM from n = 3 experiments, *p < 0.05, **p < 0.005, Student’s t-test. e Representative images of telomere (green) and PML (red) colocalizations (APBs) in FANCM-depleted U-2 OS cells. APBs are indicated by white arrows. Scale bars are 5 μm. Tukey box plots of f APB frequency and g mean APB telomere foci intensity per cell. Out of three experiments, n ≥ 150 cells scored per treatment, *p < 0.05, **p < 0.005, Mann–Whitney test
Fig. 2
Fig. 2
FANCM depletion results in the generation of nascent telomeric DNA. a Representative images of TRF2 (red) and POLD3 (green) colocalizations in U-2 OS cells with or without FANCM depletion (left panel). Colocalizations are indicated by white arrows. Scale bars are 5 μm. Quantitation of colocalizations (right panel). Scatterplot bars represent the mean ± SEM. Out of three experiments, n = 150 cells scored per treatment, *p < 0.05, **p < 0.005, Mann–Whitney test. b Representative dot blot and quantitation of nascent telomeric C-strand (left panel) and G-strand (right panel) DNA following BrdU incorporation and immunoprecipitation in U-2 OS cells with or without FANCM depletion. Nascent telomeric content was normalized to serial dilution of input DNA. Error bars represent mean ± SEM from n = 3 experiments, **p < 0.005, n.s. = non-significant, Student’s t-test. c Representative images of telomere (orange), PML (green) and EdU (violet) colocalizations (EdU-APB) in U-2 OS cells with or without FANCM depletion (left panel). Scale bars are 5 μm. Quantitation of colocalizations (right panel). Scatterplot bars represent the mean ± SEM. Out of three experiments, n ≥ 122 non-S-phase cells scored per treatment, **p < 0.005, Mann–Whitney test. d Representative dot blot and quantitation of C-circle assays following BrdU incorporation and immunoprecipitation in U-2 OS cells with or without FANCM depletion. C-circles were normalized to the mean of scrambled control. Error bars represent mean ± SEM out of n = 3 experiments, **p < 0.005, Student’s t-test
Fig. 3
Fig. 3
FANCM depletion results in increased break-induced telomere synthesis. a Representative dot blots and quantitation of C-circles in U-2 OS cells co-depleted of FANCM and either POLD3, BLM, RAD51, or RAD52. C-circles were normalized to the mean of scrambled control. Error bars represent mean ± SEM from n = 3 experiments, *p < 0.05, n.s. = non-significant, Student’s t-test. Quantitations of b APB frequency and c mean APB telomere foci intensity in U-2 OS cells co-depleted of FANCM and either POLD3, BLM, RAD51, or RAD52. Scatterplot bars represent the mean ± SEM. Out of three experiments, n = 150 cells scored per treatment, *p < 0.05, **p < 0.005, Mann–Whitney test. d Examples of telomere extension fibers (red) scored after CldU incorporation (green) (left panel). Quantitation of the number and length of telomere extension events in U-2 OS cells co-depleted of FANCM and either POLD3, BLM, RAD51 or RAD52 (center and right panels). Error bars represent mean ± SEM of n ≥ 350 fibers out of three experiments, *p < 0.05, **p < 0.005, Student’s t-test
Fig. 4
Fig. 4
ALT activity is attenuated by the replication fork remodeling capabilities of FANCM. a Schematic of FANCM domain interactions, mutations or deletions. For clarity, domains have been color-coded by functional role (bottom panel). b Quantitation of metaphase-TIFs in U-2 OS cells stably overexpressing wild-type (FANCM+) or FANCM mutants. Scatterplot bars represent the mean ± SEM. Out of three experiments, n ≥ 110 metaphases scored for each mutant, *p < 0.05, **p < 0.005, Mann–Whitney test. c Quantitation of fragile telomeres in U-2 OS cells stably overexpressing wild-type (FANCM+) or FANCM mutants. Scatterplot bars represent the mean ± SEM. Out of three experiments, n > 100 metaphases scored for each mutant, *p < 0.05, **p < 0.005, Mann–Whitney test. d Representative dot blots and quantitation of C-circle assays in U-2 OS cells stably overexpressing wild-type (FANCM+) or FANCM domain mutants. C-circles were normalized to the mean of vector control. Error bars represent mean ± SEM from n = 3 experiments, *p < 0.05, **p < 0.005, Student’s t-test. e Single molecule analysis of telomeric extension events (left panel) and length of extension events (right panel) in U-2 OS cells stably overexpressing wild-type (FANCM+) or FANCM domain mutants. Error bars represent mean ± SEM of n ≥ 350 fibers out of three experiments, *p < 0.05, **p < 0.005, Student’s t-test
Fig. 5
Fig. 5
Inhibition of the FANCM-BTR complex results in loss of ALT cell viability. a Schematic of MM2- tamoxifen (4OHT)-inducible ER fusion protein-mediated inhibition of the FANCM-BTR complex interaction. b Immunoprecipitation confirming the transfer of TOP3A and RMI1 from FANCM to the decoy MM2-ER fusion protein following 4OHT activation in U-2 OS cells. Transfer of complex components is not seen with the FF>AA mutant MM2-ER protein (FF>AA-ER). c Tukey boxplots of TIFs in U-2 OS cells expressing MM2-ER or FF>AA-ER fusion proteins in the presence or absence of 4OHT. Out of three experiments, n = 150 cells scored per treatment, **p < 0.005, Mann–Whitney test. d Representative dot blots and quantitation of C-circle assays in U-2 OS cells expressing MM2-ER or FF>AA-ER fusion proteins in the presence or absence of 4OHT. C-circles were normalized to non-induced control. Error bars represent mean ± SEM from n = 3 experiments, *p < 0.05, one-sample t-test. e Representative colony formation assays of GM847 and HCT116 cells expressing the MM2-ER fusion protein in the presence or absence of 4OHT (top panel). Quantitation of the surviving fraction of colonies for ALT (U-2 OS, GM847, and Saos-2) and telomerase-positive (HeLa and HCT116) cell lines expressing MM2-ER or FF>AA-ER fusion proteins (bottom panel). Colony counts were normalized to non-induced controls. Error bars represent mean ± SEM from n = 3 experiments, **p < 0.005, n.s. = non-significant, Student’s t-test. f Representative dot blots and quantitation of C-circle assays from U-2 OS, GM847, Saos-2, HeLa, and HCT116 cells treated with 0.5 µM PIP-199 or vehicle control (DMSO) for 72 h. C-circles were normalized to a reference sample control. Error bars represent mean ± SEM from n = 3 experiments, *p < 0.05, n.s. = non-significant, Student’s t-test. g Quantitation of the surviving fraction of colonies from U-2 OS, GM847, Saos-2, HeLa, and HCT116 cells treated with PIP-199. Colony counts were normalized to DMSO controls. Denotes a datapoint (1.42) exceeding the visible axis. Error bars represent mean ± SEM from n = 3 experiments, *p < 0.05, n.s. = non-significant, Student’s t-test
Fig. 6
Fig. 6
Schematic of proposed model of FANCM-mediated ALT suppression. FANCM functions to reverse and remodel stalled replication forks that predominate in ALT telomeres. In the absence of FANCM, or through disruption of the FANCM-BTR complex, stalled forks deteriorate into double strand breaks, which provide the substrate for break-induced telomere synthesis events and the concomitant production of nascent ECTRs

References

    1. Denchi EL, de Lange T. Protection of telomeres through independent control of ATM and ATR by TRF2 and POT1. Nature. 2007;448:1068–1071. - PubMed
    1. Sfeir A, et al. Mammalian telomeres resemble fragile sites and require TRF1 for efficient replication. Cell. 2009;138:90–103. - PMC - PubMed
    1. Schmutz I, Timashev L, Xie W, Patel DJ, de Lange T. TRF2 binds branched DNA to safeguard telomere integrity. Nat. Struct. Mol. Biol. 2017;24:734–742. - PubMed
    1. Drosopoulos WC, Kosiyatrakul ST, Schildkraut CL. BLM helicase facilitates telomere replication during leading strand synthesis of telomeres. J. Cell. Biol. 2015;210:191–208. - PMC - PubMed
    1. Vannier JB, Pavicic-Kaltenbrunner V, Petalcorin MI, Ding H, Boulton SJ. RTEL1 dismantles T loops and counteracts telomeric G4-DNA to maintain telomere integrity. Cell. 2012;149:795–806. - PubMed

Publication types