Clinical Trial
. 2019 May 28;9(1):7934.
doi: 10.1038/s41598-019-44379-w.

Neutrophil Extracellular Traps protein composition is specific for patients with Lupus nephritis and includes methyl-oxidized αenolase (methionine sulfoxide 93)

Affiliations
Clinical Trial

Neutrophil Extracellular Traps protein composition is specific for patients with Lupus nephritis and includes methyl-oxidized αenolase (methionine sulfoxide 93)

Maurizio Bruschi et al. Sci Rep. .

Abstract

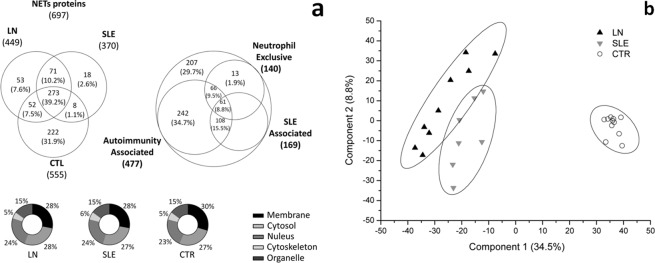
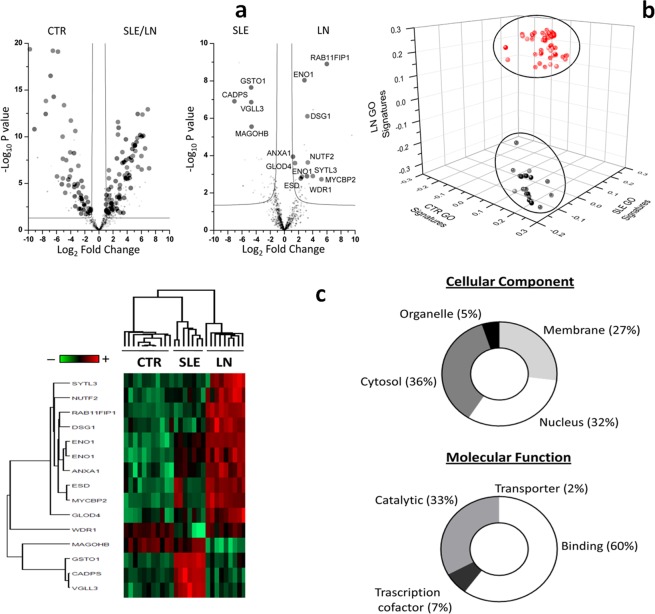
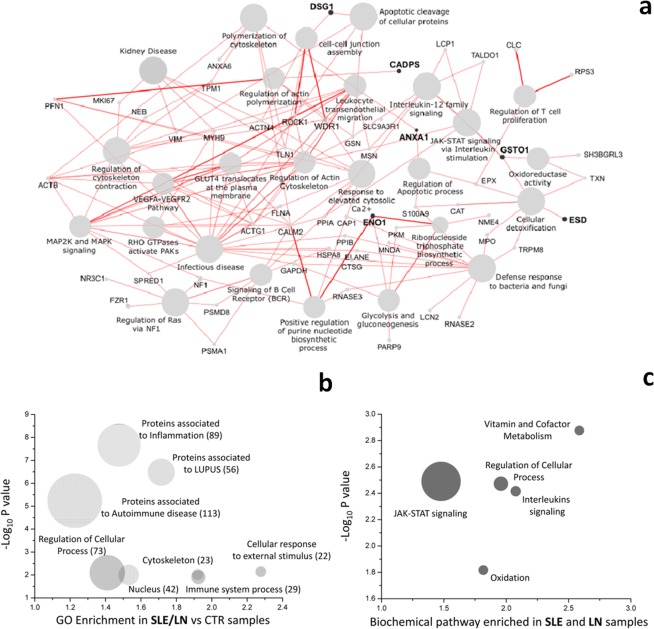
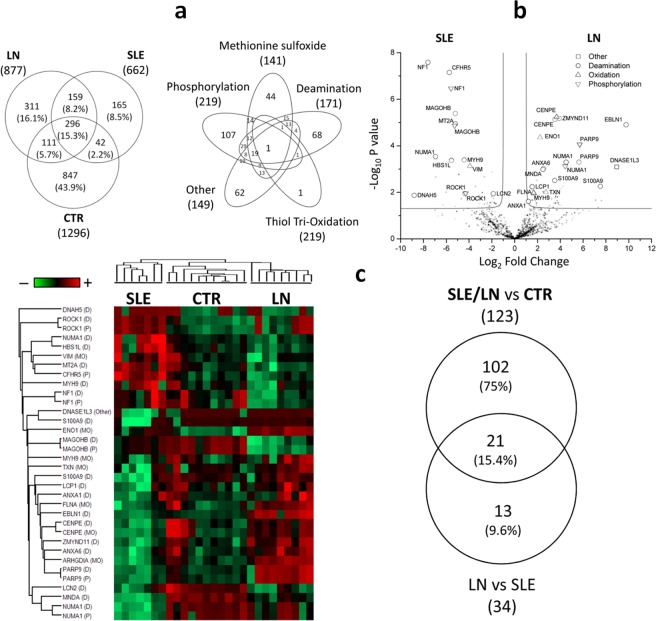
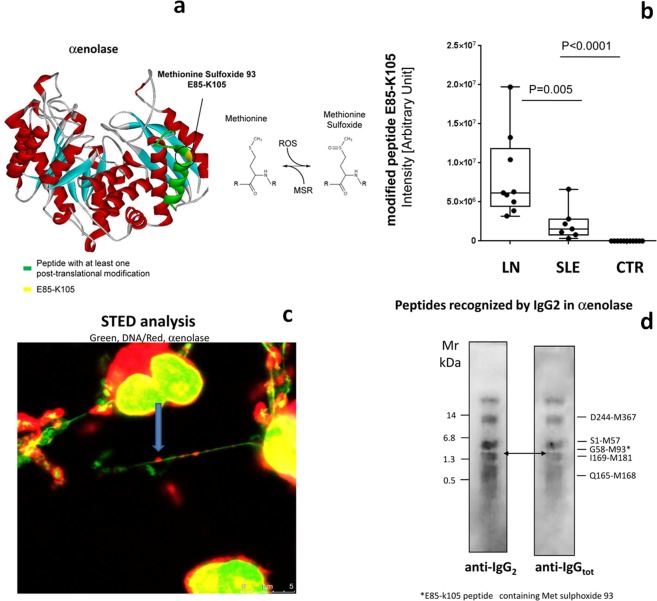
NETs constitute a network of DNA and proteins released by neutrophils in response to infectious and immunologic triggers. NET proteins are recognized as autoantigens in ANCA vasculitis; limited knowledge is available in other autoimmune pathologies. The composition of NETs produced ex vivo by resting and Phorbol-myristate acetate (PMA) stimulated neutrophils was analyzed by high-throughput Fusion Orbitrap technology in 16 patients with Systemic Lupus Erythematosus/Lupus nephritis (9 SLE/7 LN) and in 11 controls. Seven-hundred proteins were characterized and specific fingerprints discriminated LN from SLE. We focused on methyl-oxidized αenolase (methionine sulfoxide 93) that was markedly increased in NETs from LN and was localized in NET filaments in tight connection and outlying DNA. The isotype of anti-αenolase antibodies was IgG2 in LN and IgG4 in other autoimmune glomerulonephritis (Membranous Nephropathy, MN); serum anti-αenolase IgG2 were higher in LN than in SLE and absent in MN. The same IgG2 antibodies recognized 5 epitopes of the protein one containing methionine sulphoxide 93. In conclusion, specific NET protein fingerprints characterize different subsets of SLE; methyl-oxidized αenolase is over-expressed in LN. Circulating anti-αenolase IgG2 recognize the oxidized epitope and are high in serum of LN patients. Post-translational modified NET proteins contribute to autoimmunity in patients with LN.


Conflict of interest statement

The authors declare no competing interests.

Figures

Figure 1
Figure 1
(a) Venn diagram and Pie-chart of Gene Ontology classificationfor cellular components of NETs isolated from ‘ex vivo’ PMA stimulated neutrophils: Venn diagram of identified NET proteins; the whole protein NET complexes had overlap between proteins recognized as specific components of normal neutrophil and/or with proteins already associated with autoimmunity and specifically with SLE. Of note, 66 of autoimmunity associated and 108 of autoimmunity/SLE associated proteins were exclusively expressed in neutrophils. Numbers, represent the distinct proteins in the respective overlapping and not-overlapping areas. Pie-chart of sub-cellular localization showing high identity in cellular component classification among different groups. (b) Multidimensional scaling (MDS) analysis of NETs. Two-dimensional scatter plot of MDS analysis of Control (circle), LN (Up-triangle) and SLE (Down-triangle) NET proteins.Ellipses (corresponding to cluster area at 95% of CI) show three clusters corresponding to control, LN and SLE samples, with partial overlapping between SLE and LN.
Figure 2
Figure 2
(a) Volcano plot based on fold change (Log2) and P value (−Log10) of all NET proteins identified by the comparison of control and SLE (with/without nephritis) supernatants and b) between SLE and LN neutrophils. Darkgrey circles represent the proteins highlighted by the combine use of univariate statistical analysis, PLS-DA and SVM: on the right, proteins more expressed in NETs from LN (n11), on the left proteins more expressed in NETs from SLE (n4). (b) Three-dimensional scatter plot of gene ontology signatures. The three-dimensional scatter plot of gene ontology (GO) analysis shows two distinct cluster of GO signature. Ellipses show the area at 95% of CI. In Red the GO signatures of SLE and LN and in black those of CTR. (c) Heat map and GO annotation Pie-chart of highlight proteins. Heat map of proteome profile of NETs proteins highlighted by the comparison of LN and SLE NETs. In heat map each row represents a protein and each column corresponds to one sample. Normalized Z-score of proteins abundance are depicted by a pseudocolor scale with red indicating positive expression, white equal expression, and blue negative expression compared to each proteins values whereas the tree dendrogram displays the results of a unsupervised hierarchical clustering analysis placing similar proteome profile values near each other. Visual inspection of the dendrogram and heat map shows a clear difference in protein expression of NETs deriving from different patients groups (control, SLE and LN). Pie-chart of Gene Ontology classification for cellular components and molecular function. The plot shows that most of proteins are associated to cytosol or nucleus of neutrophils; for molecular function, most proteins are involved in the binding or catalytic activity.
Figure 3
Figure 3
(a) Interaction networks of proteins/peptides of SLE and LN NETs. The diagram of proteins interaction networks (PPI) shows the interaction of the SLE and LN proteins/peptides highlighted by the combine use of uni-multivariate statistical analysis and learning machine and the relative biochemical pathways. The circle size of biochemical pathway is proportional to the number of proteins associated and the thickness of edge is proportional to the strength of interaction. Proteins PPI is analysed by Cytoscape software with ClueGo app. (b) GO Enrichment of NETs proteins of SLE and LN. Two-dimensional scatter plot analysis of mean enrichment factor and P value (−Log10) (Fisher exact test) of the proteins associated to SLE and LN compared to CTR samples. The size of circle are proportional of the number of associated proteins to each GO signature. (c) GO Enrichment of biologically relevant pathways in NETs from SLE and LN. GO analysis highlights biochemical pathways in which proteins expressed in SLE and LN participate. Graph show the mean of Log2 fold change of protein associated to each pathway (x-axis) and their P value (−Log10) by the comparison with CTR. The size of circles is proportional of the number of associated proteins. These pathway are also highlighted by the comparison of SLE and LN (Reactome database).
Figure 4
Figure 4
(a) Venn diagram of modified peptides and proteins that characterized different NETs. Venn diagram of NETs peptides with at least one post translational modification and type of modification identified by means of mass spectrometry in NETs deriving from LN, SLE and control cells. Numbers, represent the distinct peptide/protein in the respective overlapping and not-overlapping areas. The overlaps among different modifications indicate that each protein is modified following more than one mechanism. (b) Volcano plot of of NET peptides. Volcano plot based on fold change (Log2) and P value (−Log10) of peptides with at least one post-translational modification identified in NETs produced by SLE and LN neutrophils. Peptides above the line and identified as open triangle, circles and square represent those discriminant with statistically significant changes: on the right, peptides more expressed in NETs from LN, on the left peptides more expressed in NETs from SLE. (c) Heat map of NET peptides. Heat map of the peptide profile that characterized NETs produced by SLE, LN and control cells. Heat map utilizes univariate analysis, support vector machine, and partial least square discriminant analysis. Each row represents a peptide and each column corresponds to one sample. Normalized Z-score of peptides abundance are depicted by a pseudocolor scale with red indicating positive expression, white equal expression, and blue negative expression compared to each peptides values, whereas the tree dendrogram displays the results of a unsupervised hierarchical clustering analysis placing similar peptide profile values near each other. Venn diagram of significant NET peptides with at least one post trasductional modification identified by the comparison of CTR vs SLE with/without nephrites (one circle) and SLE vs LN (second circle). Venn diagram shows common and exclusive peptides. Numbers represent the distinct peptides in the respective overlapping and not-overlapping areas. 21 peptides allow to distinguish simultaneously Control, SLE and LN NETs.
Figure 5
Figure 5
Oxidised αenolase: characterization, expression and localization. (a) Post-translational modifications of αenolase in NETs were characterized by Fusion Orbitrap; the E85-K105 peptide containing methy-sulfoxide methionine 93 was found in NETs limited to LN patients; three-dimensional structure of αenolase where the epitopes for IgG2 interaction (see below) are reported in green and the merge between G58-M93 and E85-K105 is shown in yellow-red. (b) Intensity of the E85-K105 peptide containing methy-sulfoxide methionine 93 in NETs from LN and SLE. (c) Stimulated emission depletion microscopy (STED) analysis of filaments. (d) The epitopes of αenolase that are recognized by anti-αenolase IgG2 purified from serum of LN patients. The protein was digested by CNbr and peptides deriving from digestion were separated by western-blot.
Figure 6
Figure 6
Isotype-specificity of anti-αenolase antibodies and circulating levels in different autoimmune-conditions. (a) Isotype specificity of anti-αenolase antibodies was evaluated in 20 patients with Lupus Nephritis (LN) and in 20 with idiopathic Membranous Nephropathy by western-blot. (b) Circulating levels of anti-αenolase IgG2 were determined in serum of patients with SLE (n113), in LN (n103) and in 20 with MN. The former groups had been recruited in the frame of the Zeus study https://clinicaltrials.gov (study number: NCT02403115). A home-made ELISA was utilized for these determinations. (c) Sensitivity and specificity of anti-αenolase IgG2 in LN and in SLE patients were very high.

References

    1. Brinkmann V, et al. Neutrophil extracellular traps kill bacteria. Science. 2004;303:1532–1535. doi: 10.1126/science.1092385. - DOI - PubMed
    1. Nathan C. Neutrophils and immunity: challenges and opportunities. Nat Rev Immunol. 2006;6:173–182. doi: 10.1038/nri1785. - DOI - PubMed
    1. Papayannopoulos V, Zychlinsky A. NETs: a new strategy for using old weapons. Trends Immunol. 2009;30:513–521. doi: 10.1016/j.it.2009.07.011. - DOI - PubMed
    1. Fuchs TA, et al. Novel cell death program leads to neutrophil extracellular traps. J Cell Biol. 2007;176:231–241. doi: 10.1083/jcb.200606027. - DOI - PMC - PubMed
    1. Urban C, Zychlinsky A. Netting bacteria in sepsis. Nat Med. 2007;13:403–404. doi: 10.1038/nm0407-403. - DOI - PubMed

Publication types

MeSH terms