. 2020 May;25(5):1080-1093.
doi: 10.1038/s41380-019-0430-4. Epub 2019 May 28.

Acute exposure to low-level light at night is sufficient to induce neurological changes and depressive-like behavior

Affiliations

Acute exposure to low-level light at night is sufficient to induce neurological changes and depressive-like behavior

William H Walker 2nd et al. Mol Psychiatry. 2020 May.

Abstract

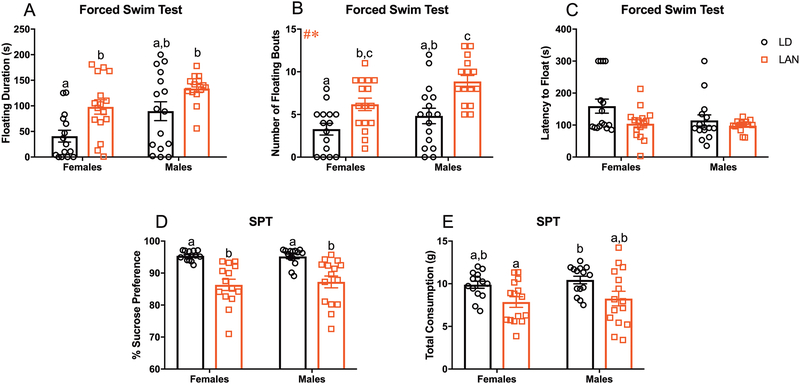
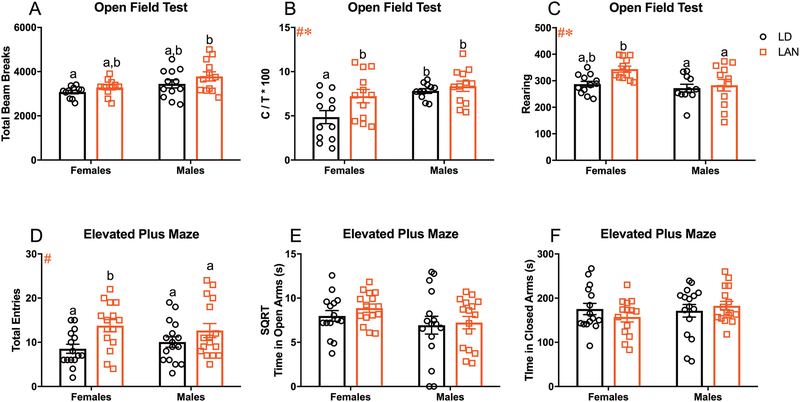
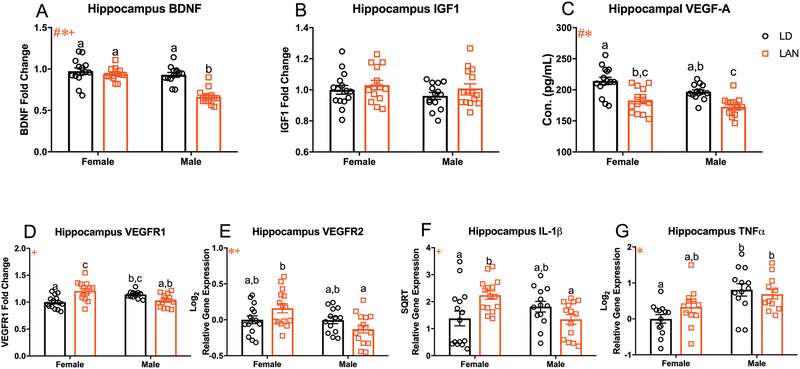
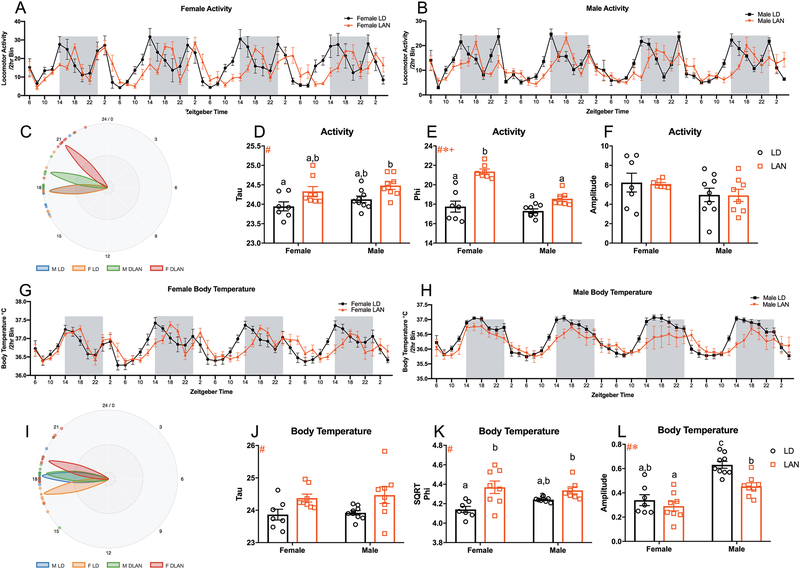
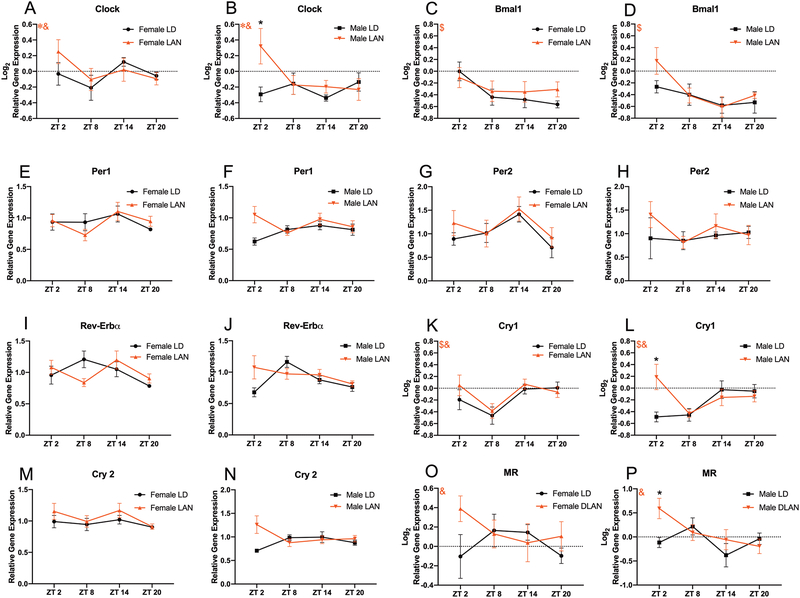
The advent and wide-spread adoption of electric lighting over the past century has profoundly affected the circadian organization of physiology and behavior for many individuals in industrialized nations; electric lighting in homes, work environments, and public areas have extended daytime activities into the evening, thus, increasing night-time exposure to light. Although initially assumed to be innocuous, chronic exposure to light at night (LAN) is now associated with increased incidence of cancer, metabolic disorders, and affective problems in humans. However, little is known about potential acute effects of LAN. To determine whether acute exposure to low-level LAN alters brain function, adult male, and female mice were housed in either light days and dark nights (LD; 14 h of 150 lux:10 h of 0 lux) or light days and low level light at night (LAN; 14 h of 150 lux:10 h of 5 lux). Mice exposed to LAN on three consecutive nights increased depressive-like responses compared to mice housed in dark nights. In addition, female mice exposed to LAN increased central tendency in the open field. LAN was associated with reduced hippocampal vascular endothelial growth factor-A (VEGF-A) in both male and female mice, as well as increased VEGFR1 and interleukin-1β mRNA expression in females, and reduced brain derived neurotrophic factor mRNA in males. Further, LAN significantly altered circadian rhythms (activity and temperature) and circadian gene expression in female and male mice, respectively. Altogether, this study demonstrates that acute exposure to LAN alters brain physiology and can be detrimental to well-being in otherwise healthy individuals.


Conflict of interest statement

CONFLICTS OF INTEREST

The authors do not have any conflicts of interest to report.

Figures

Figure 1:
Figure 1:
Acute LAN Increases Depressive-like Behavior (A-C) Average time spent floating, number of floating bouts, and latency to float during forced swim test. (A) LAN significantly increased floating duration in females relative to LD (t= 3.133; p<0.008; Bonferroni correction)(F LD n=15; M LD n= 16; F LAN n=16; M LAN n=14). (B) Main effect of lighting and sex on the number of floating bouts (F1,58=20.63, p<0.001; F1,58=7.568, p<0.01); increased number of floating bouts in males and females housed in LAN relative to sex matched controls. (F LD n=15; M LD n= 16; F LAN n=16; M LAN n=15) (C) No group differences in latency to float (p>0.008 for all t-tests; Bonferroni correction) (F LD n=15; M LD n= 15; F LAN n=16; M LAN n=14). (D-E) Percent sucrose preference and total liquid consumption during sucrose preference testing. (D) LAN significantly decreased sucrose preference in males and female mice relative to their sex matched controls (males, t=3.893; p<0.001; females, t=5.043; p<0.0001; Bonferroni correction)) (F LD n=14; M LD n= 14; F LAN n=14; M LAN n=15) (E) LAN reduced total liquid consumption in females relative to males house in normal lighting condition (t=3.320; p<0.008; Bonferroni correction). No differences in total liquid consumption were detected within sexes (p>0.008 for all t-tests; Bonferroni correction) (F LD n=14; M LD n= 14; F LAN n=15; M LAN n=15) Error bars represent SEM; # main effect of lighting, * main effect of sex, + sex by lighting interaction; (B) two-way ANOVA; Tukey’s multiple comparisons test (A and C-E) multiple t-tests between each group with Bonferroni correction. Bars that do not share a letter represent Tukey’s multiple comparisons at p<0.05 or Bonferroni correction at p<0.008.
Figure 2:
Figure 2:
Anxiolytic Effect of LAN in Female Mice (A-C) Total beam break, central tendency, and rearing during open field testing. (A) Male mice exposed to LAN demonstrated a significant increase in total beam breaks compared to females housed in LD (t=3.051; p<0.01; Bonferroni correction. No differences in total beam breaks were detected within sexes (p>0.008 for all t-tests; Bonferroni correction) (F LD n=11; M LD n= 12; F LAN n=11; M LAN n=12) (B) Main effect of lighting (F=1,43=5.338, p<0.05) and sex (F1,43=10.42, p<0.01) on central tendency; females housed in LAN increased the time spent in the center relative to females housed in LD. (F LD n=12; M LD n= 11; F LAN n=12; M LAN n=12) (C) Main effect of lighting (F=1,43=4.783, p<0.05) and sex (F1,43= 6.062, p<0.05) on number of rears. (F LD n=12; M LD n= 11; F LAN n=12; M LAN n=12) (D-F) Total entries, time spent in the open arm, and time spent in the closed arm during elevated plus maze. (D) Main effect of lighting on total arm entries (F1,58=8.709, p<0.01); increased number of total arm entries in females relative to LD. (F LD n=15; M LD n= 16; F LAN n=15; M LAN n=16) (E and F) No group differences on time spent in the open or closed arms. (E) (F LD n=15; M LD n= 16; F LAN n=15; M LAN n=16) (F) (F LD n=15; M LD n= 16; F LAN n=14; M LAN n=16) Error bars represent SEM; # main effect of lighting, * main effect of sex, + sex by lighting interaction; (B-F) two-way ANOVA; Tukey’s multiple comparisons test (A) multiple t-tests between each group with Bonferroni correction. Bars that do not share a letter represent Tukey’s multiple comparisons at p<0.05 or Bonferroni correction at p<0.008.
Figure 3:
Figure 3:
Acute LAN Reduces Neurotrophic Signaling and Increases Neuroinflammation (A-C) Measure of neurotrophins in the hippocampus. (A) Main effect of lighting (F1,51=26.66, p<0.001), sex (F1,51=29.52, p<0.001), and sex by lighting interaction (F1,51=15.57, p<0.001) on bdnf expression in the hippocampus; LAN reduced bdnf expression in males relative to same sex controls. (F LD n=14; M LD n= 13; F LAN n=14; M LAN n=14) (B) No group differences in igf1 expression in the hippocampus. (F LD n=15; M LD n= 14; F LAN n=14; M LAN n=15) (C) Main effect of lighting (F1,53=34.32, p<0.001) and sex (F1,53=8.392, p<0.01) on concentration of VEGF-A in the hippocampus; decreased VEGF-A in males and females housed in LAN relative to sex matched controls. (F LD n=15; M LD n= 14; F LAN n=14; M LAN n=14) (D) Sex by lighting interaction in vegfr1 expression (F1,49=21.03, p<0.001); LAN increased the expression of vegfr1 in females relative to LD. (F LD n=14; M LD n= 13; F LAN n=13; M LAN n=13) (E) Main effect of sex (F1,54=7.078, p<0.05) and a sex by lighting interaction (F1,54=6.528, p<0.05) on vegfr2 expression in the hippocampus. (F LD n=15; M LD n= 13; F LAN n=15; M LAN n=15) (F) Sex by lighting interaction in il-1β expression in the hippocampus (F1,53=10.31, p<0.01); increased il-1β in females housed in LAN relative to LD. (F LD n=15; M LD n= 13; F LAN n=15; M LAN n=14) (G) Main effect of sex (F1,46=15.87, p<0.001) in the expression of tnf-α in the hippocampus. (F LD n=13; M LD n= 13; F LAN n=12; M LAN n=12) Error bars represent SEM; # main effect of lighting, * main effect of sex, + sex by lighting interaction; bars that do not share a letter represent multiple comparisons at p<0.05, two-way ANOVA; Tukey’s multiple comparisons test.
Figure 4:
Figure 4:
Acute LAN Alters Activity and Body Temperature Rhythms (A-B) Activity rhythms in female and male mice exposed to LAN; 2 hr bins beginning at ZT6 on Day 1 and ending at ZT4 on Day 4. (C) Graphic illustrating the phi (phase) of activity rhythms for each group from CT0 (D) Main effect of lighting (F1,28=12.41, p<0.01) on tau (period) of activity rhythms. (F LD n=7; M LD n= 9; F LAN n=8; M LAN n=8) (E) Main effect of lighting (F1,25=48.16, p<0.0001), sex (F1,25=21.51, p<0.0001), and sex by lighting interaction (F1,25=11.24, p<0.01) on phi of activity rhythms; LAN increased phi in females relative to same sex controls. (F LD n=7; M LD n= 8; F LAN n=7; M LAN n=7) (F) No group differences in the amplitude of activity rhythms (F LD n=7; M LD n= 9; F LAN n=7; M LAN n=8) (G-H) Body temperature rhythms in female and male mice exposed to LAN; 2 hr bins beginning at ZT6 on Day 1 and ending at ZT4 on Day 4. (I) Graphic illustrating the phi (phase) of body temperature rhythms for each group from CT0 (J) Main effect of lighting (F1,28=12.41, p<0.01) on tau (period) of body temperature rhythms. (F LD n=7; M LD n= 9; F LAN n=8; M LAN n=8) (K) Main effect of lighting (F1,26=15.59, p<0.001) on phi (phase) of body temperature rhythms; female mice exposed to LAN demonstrate increased phi compared to female mice housed in LD. (F LD n=7; M LD n= 8; F LAN n=8; M LAN n=7) (L) Main effect of lighting (F1,28=10.23, p<0.01) and sex (F1,28=41.16, p<0.0001) on the amplitude of body temperature rhythms; LAN reduced the amplitude of body temperature rhythms in male mice relative to sex matched controls. (F LD n=7; M LD n= 9; F LAN n=8; M LAN n=8) Error bars represent SEM; # main effect of lighting, * main effect of sex, + sex by lighting interaction; bars that do not share a letter represent multiple comparisons at p<0.05, two-way ANOVA; Tukey’s multiple comparisons test.
Figure 5:
Figure 5:
Acute LAN Alters Hippocampal Circadian Gene Expression in Male Mice (A-N) Expression of circadian genes with the hippocampus throughout the day. (A-B) Main effect of sex (F1,105=4.486, p<0.05) and time by lighting interaction (F3,105=3.018, p<0.05) on the expression of clock within the hippocampus; male mice exposed to LAN demonstrated increased clock expression at ZT 2 relative to their sex matched controls. (F LD n=7–8; M LD n= 7–8; F LAN n=7–8; M LAN n=7–8 per time point) (C-D) Main effect of time (F3,108=15.07, p<0.001) on the expression of bmal1 within the hippocampus. (F LD n=7–8; M LD n= 7–8; F LAN n=7–8; M LAN n=7–8 per time point). (E-J) No groups differences in the expression of per1, per2, or rev-erbα (p>0.008 for all t-tests; Bonferroni correction) (F LD n=7–8; M LD n= 7–8; F LAN n=7–8; M LAN n=7–8 per time point). (K-L) Main effect of time (F3,106=8.378, p<0.0001) and time by lighting interaction (F3,106=3.480, p<0.05) on the expression of cry1 within the hippocampus; male mice exposed to LAN demonstrated increased cry1 expression at ZT 2 relative to their sex matched controls. (F LD n=7–8; M LD n= 7–8; F LAN n=7–8; M LAN n=7–8 per time point) (M-N) No groups differences in the expression of cry2 (p>0.008 for all t-tests; Bonferroni correction) (F LD n=7–8; M LD n= 7–8; F LAN n=6–8; M LAN n=7–8 per time point) (O-P) Time by lighting interaction (F3,104=2.983, p<0.05) on the expression of hippocampal nr3c2 (MR); male mice exposed to LAN increased MR expression at ZT2 compared to LD males. Error bars represent SEM; # main effect of lighting, * main effect of sex, + sex by lighting interaction, $ main effect of time, & time by lighting interaction; (A-D, K-L, and O-P) three-way ANOVA; Tukey’s multiple comparisons test (E-J and M-N) multiple t-tests between each group with Bonferroni correction. * represent Tukey’s multiple comparisons at p<0.05

References

    1. Gaston KJ, Bennie J, Davies TW, Hopkins J. The ecological impacts of nighttime light pollution: a mechanistic appraisal. Biol Rev 2013; 88: 912–927. - PubMed
    1. Falchi F, Cinzano P, Duriscoe D, Kyba CCM, Elvidge CD, Baugh K et al. The new world atlas of artificial night sky brightness. Sci Adv 2016; 2: e1600377–e1600377. - PMC - PubMed
    1. Bedrosian TA, Nelson RJ. Timing of light exposure affects mood and brain circuits. Transl Psychiatry 2017; 7: e1017–e1017. - PMC - PubMed
    1. Davis S, Mirick DK, Stevens RG. Night shift work, light at night, and risk of breast cancer. JNCI J Natl Cancer Inst 2001; 93: 1557–1562. - PubMed
    1. Kloog I, Haim A, Stevens RG, Portnov BA. Global co-distribution of light at night (lan) and cancers of prostate, colon, and lung in men. Chronobiol Int 2009; 26: 108–125. - PubMed

Publication types

Substances