. 2019 May 8:13:19.
doi: 10.3389/fnsys.2019.00019. eCollection 2019.

Coherence of Visual-Evoked Gamma Oscillations Is Disrupted by Propofol but Preserved Under Equipotent Doses of Isoflurane

Affiliations

Coherence of Visual-Evoked Gamma Oscillations Is Disrupted by Propofol but Preserved Under Equipotent Doses of Isoflurane

Adeeti Aggarwal et al. Front Syst Neurosci. .

Abstract

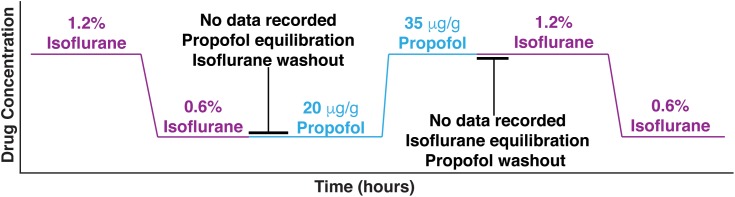
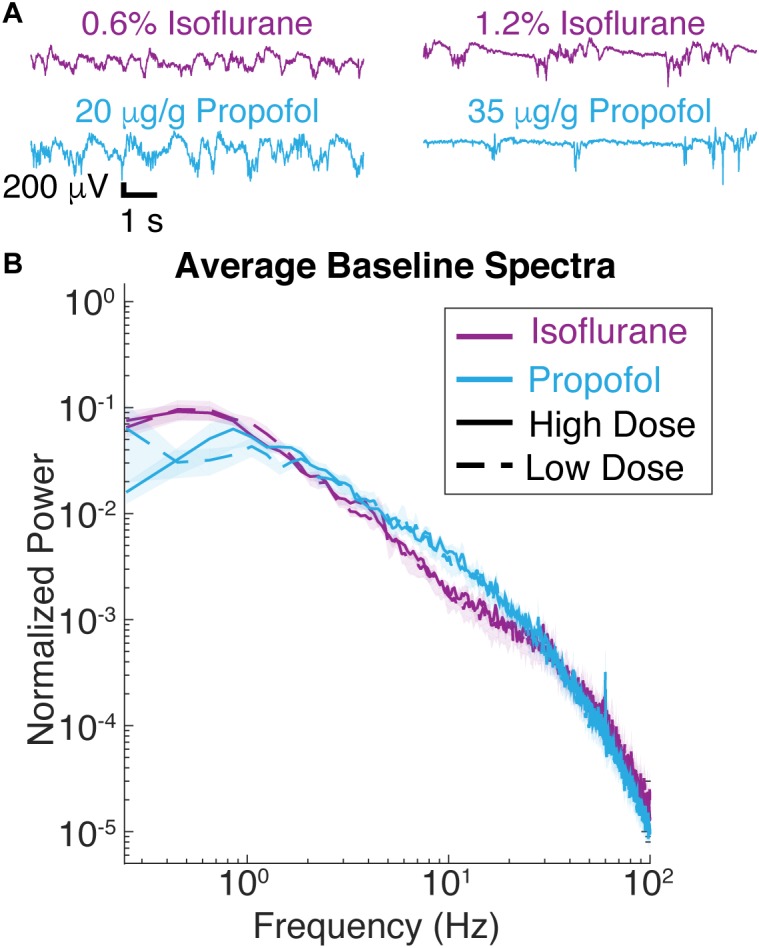
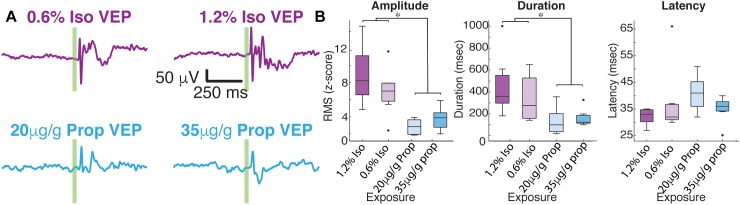
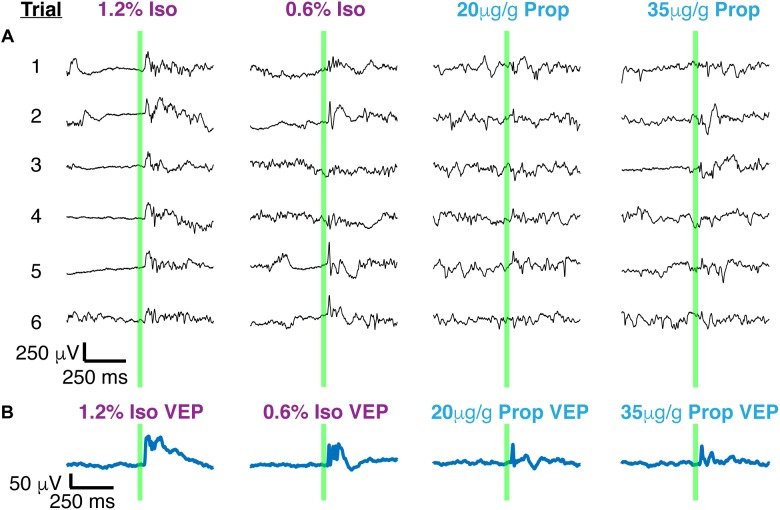
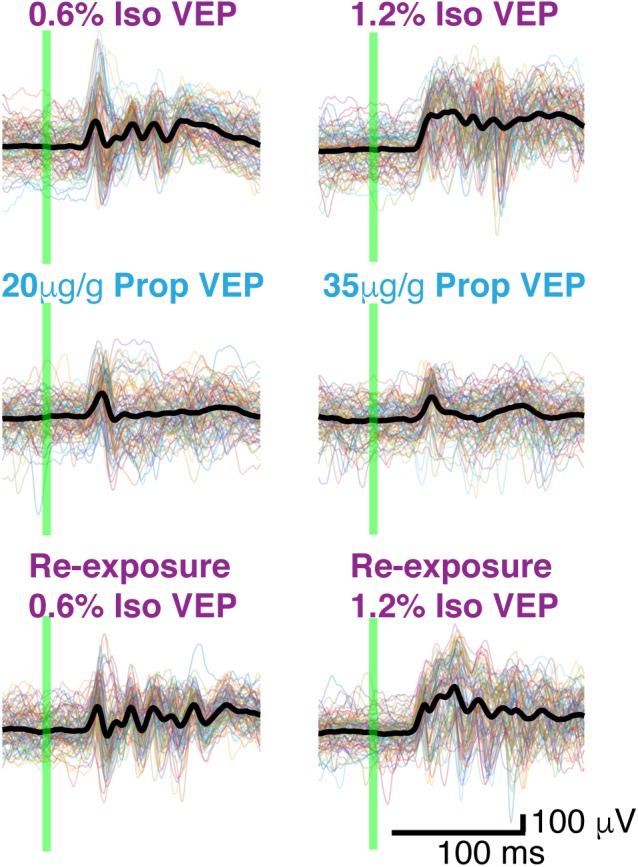
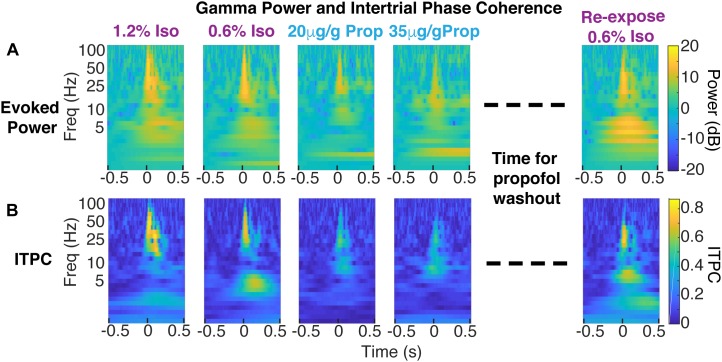
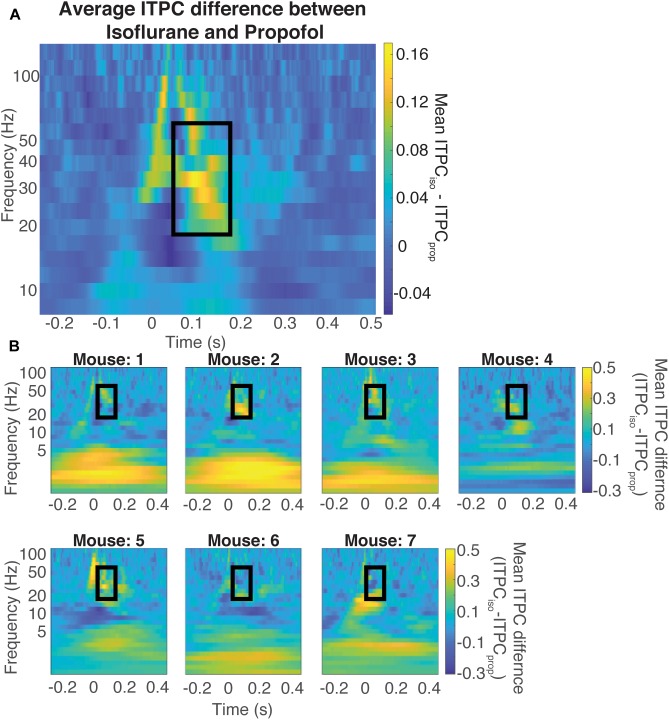
Previous research demonstrates that the underlying state of the brain influences how sensory stimuli are processed. Canonically, the state of the brain has been defined by quantifying the spectral characteristics of spontaneous fluctuations in local field potentials (LFP). Here, we utilized isoflurane and propofol anesthesia to parametrically alter the spectral state of the murine brain. With either drug, we produce slow wave activity, with low anesthetic doses, or burst suppression, with higher doses. We find that while spontaneous LFP oscillations were similar, the average visual-evoked potential (VEP) was always smaller in amplitude and shorter in duration under propofol than under comparable doses of isoflurane. This diminished average VEP results from increased trial-to-trial variability in VEPs under propofol. One feature of single trial VEPs that was consistent in all animals was visual-evoked gamma band oscillation (20-60 Hz). This gamma band oscillation was coherent between trials in the early phase (<250 ms) of the visual evoked potential under isoflurane. Inter trial phase coherence (ITPC) of gamma oscillations was dramatically attenuated in the same propofol anesthetized mice despite similar spontaneous oscillations in the LFP. This suggests that while both anesthetics lead to loss of consciousness (LOC), elicit slow oscillations and burst suppression, only the isoflurane permits phase resetting of gamma oscillations by visual stimuli. These results demonstrate that accurate characterization of a brain state must include both spontaneous as well as stimulus-induced perturbations of brain activity.

Keywords: VEP; anesthesia; brain state; burst suppression; gamma; isoflurane; propofol; visual evoked potential.


Figures

FIGURE 1
FIGURE 1
Experimental design. Mice were first given two doses of isoflurane (high – 1.2%, and low – 0.6%), then given two doses of propofol (low – 20 μg/g brain and high – 35 μg/g brain). Between isoflurane and propofol recordings, the brain was allowed 45 min to wash out isoflurane and establish equilibrium with propofol. Four out of 7 mice were re-exposed to the high and low isoflurane doses after propofol was washed out for 1 h.
FIGURE 2
FIGURE 2
Spontaneous LFP of mice under isoflurane and propofol have similar spectral characteristics. (A) Ten seconds of unstimulated local field potential (LFP) recorded in V1 under high dose isoflurane (1.2%), low dose isoflurane (0.6%), high dose propofol (35 μg/g brain), low dose propofol (20 μg/g brain). (B) Power spectra of 1 min of unstimulated LFP from V1 were computed for all seven animals. Blue curves are from animals under propofol, while purple traces are from animals under isoflurane. Solid lines denote high drug concentrations while dashed denote low drug concentrations. Shading represents the 95% confidence intervals for each condition.
FIGURE 3
FIGURE 3
Average visual evoked responses under isoflurane and propofol are dramatically different within the same animal. (A) Average of 100 flash trials under each does of isoflurane (top) and propofol (bottom). The flash is denoted by the green vertical line. (B) Quantification of average VEP amplitude (n = 7, p-value amplitude < 0.001, Mann–Whitney U-test with post hoc Bonferroni Correction), duration of VEP (n = 7, p-value duration = 0.003, Mann–Whitney U-test with post hoc Bonferroni Correction), and latency of onset (df = 3, n = 7, p-value = 0.044, Kruskal–Wallis). asterisks () denote p < 0.01.
FIGURE 4
FIGURE 4
Single trials of visual evoked potentials under isoflurane and propofol both have high trial by trial variability. (A) Six out of 100 randomly chosen individual flash evoked potentials (thin black traces) under high and low doses of each anesthetic: isoflurane, propofol. (B) The average VEP over 100 trials for each anesthetic concentration. The flash is denoted by the green vertical line in both panels.
FIGURE 5
FIGURE 5
Butterfly plots. Thin colored traces under high and low doses of each anesthetic: isoflurane, propofol, and isoflurane re-exposure in the same animal. Thick black lines represent the average VEP under each dose of each anesthetic. The flash is denoted by the green vertical line.
FIGURE 6
FIGURE 6
Decrease in coherent evoked gamma power in propofol compared to isoflurane within the same animal. (A) Color plot of average evoked power (first isoflurane exposure in the left panels, propofol exposures in the middle panels, and re-exposure to isoflurane acquired 1 h after propofol wash out in the right panels). (B) Color plot of ITPC.
FIGURE 7
FIGURE 7
Difference in coherence is in the evoked gamma band. Average difference between the ITPC under both doses of isoflurane and propofol (A) Yellow colors represent higher ITPC under isoflurane while dark blue colors represent higher ITPC under propofol. The maximum difference in evoked coherence occurs within the black rectangle, at 80 ms after stimulus onset and is centered at 36 Hz. The Quantification of the ITPC in the gamma range (20–60 Hz) within the black rectangle yields a significant difference between the gamma coherence of visual evoked responses (timepoints = 900, p < 0.000001, Mann–Whitney U-test). Individual difference between the ITPC under both doses of isoflurane and propofol (B). Yellow colors represent higher ITPC under isoflurane while dark blue colors represent higher ITPC under propofol. The Quantification of the ITPC in the gamma range (20–60 Hz) within the black rectangle yields a significant difference between the gamma coherence of visual evoked responses.

References

    1. Akeju O., Song A. H., Hamilos A. E., Pavone K. J., Flores F. J., Brown E. N., et al. (2016). Electroencephalogram signatures of ketamine anesthesia-induced unconsciousness. Clin. Neurophysiol. 127 2414–2422. 10.1016/j.clinph.2016.03.005 - DOI - PMC - PubMed
    1. Amzica F. (2009). Basic physiology of burst-suppression. Epilepsia 50(Suppl. 12), 38–39. 10.1111/j.1528-1167.2009.02345.x - DOI - PubMed
    1. Arena A., Lamanna J., Gemma M., Ripamonti M., Ravasio G., Zimarino V., et al. (2017). Linear transformation of the encoding mechanism for light intensity underlies the paradoxical enhancement of cortical visual responses by sevoflurane. J. Physiol. 595 321–339. 10.1113/JP272215 - DOI - PMC - PubMed
    1. Aston-Jones G., Cohen J. D. (2005). An integrative theory of locus coeruleus-norepinephrine function: adaptive gain and optimal performance. Annu. Rev. Neurosci. 28 403–450. 10.1146/annurev.neuro.28.061604.135709 - DOI - PubMed
    1. Bai D., Pennefather P. S., MacDonald J. F., Orser B. A. (1999). The general anesthetic propofol slows deactivation and desensitization of GABA A receptors. J. Neurosci. 19 10635–10646. 10.1523/jneurosci.19-24-10635.1999 - DOI - PMC - PubMed

LinkOut - more resources