. 2019 May 8:10:526.
doi: 10.3389/fphys.2019.00526. eCollection 2019.

Cellular Aspects of Muscle Specialization Demonstrate Genotype - Phenotype Interaction Effects in Athletes

Affiliations

Cellular Aspects of Muscle Specialization Demonstrate Genotype - Phenotype Interaction Effects in Athletes

Martin Flück et al. Front Physiol. .

Abstract

Introduction: Gene polymorphisms are associated with athletic phenotypes relying on maximal or continued power production and affect the specialization of skeletal muscle composition with endurance or strength training of untrained subjects. We tested whether prominent polymorphisms in genes for angiotensin converting enzyme (ACE), tenascin-C (TNC), and actinin-3 (ACTN3) are associated with the differentiation of cellular hallmarks of muscle metabolism and contraction in high level athletes.

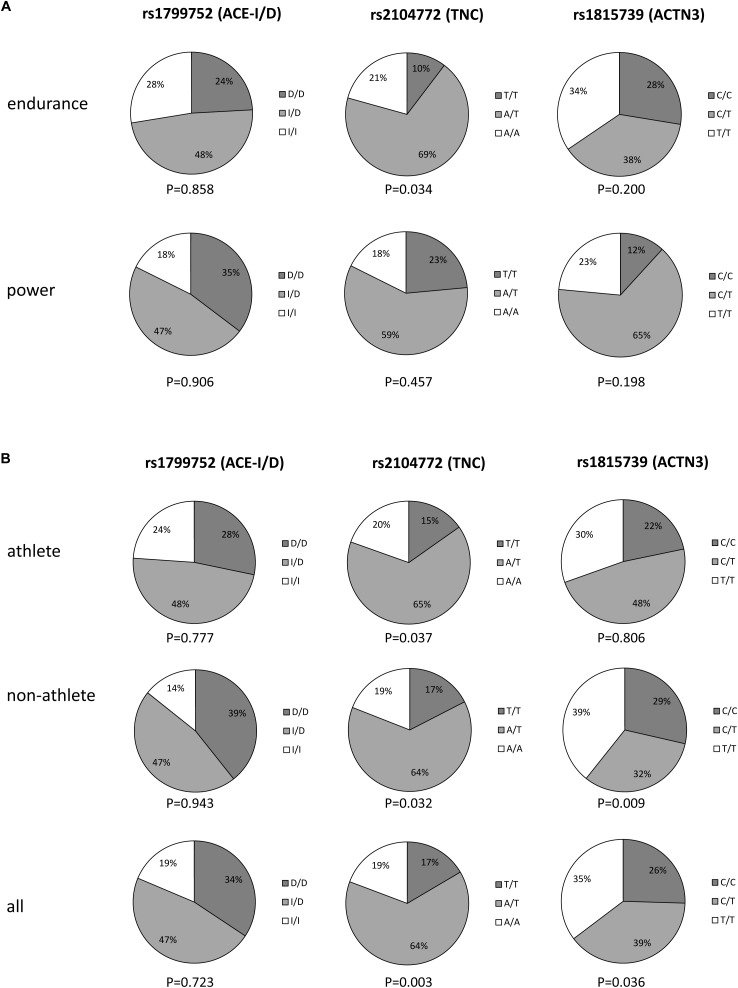
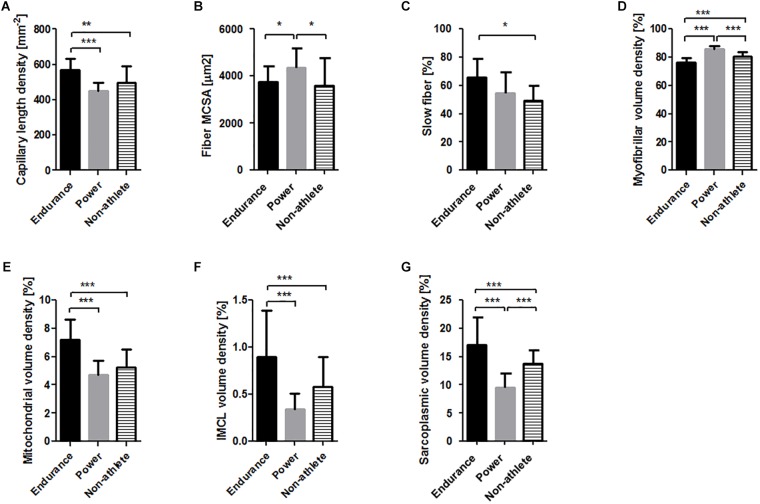
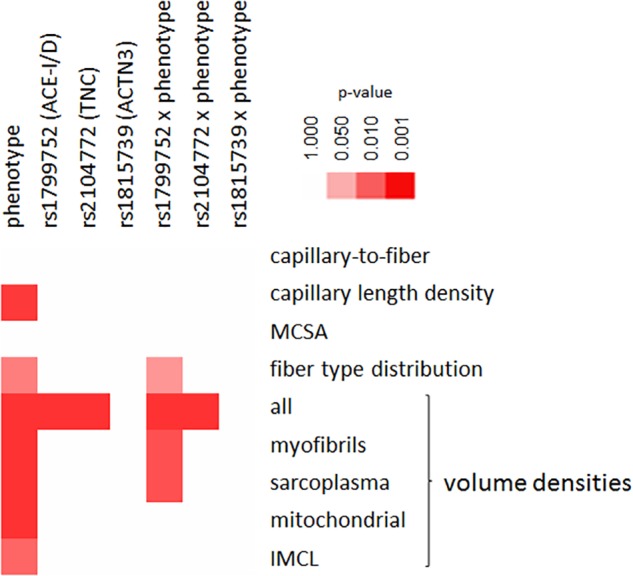
Methods: Muscle biopsies were collected from m. vastus lateralis of three distinct phenotypes; endurance athletes (n = 29), power athletes (n = 17), and untrained non-athletes (n = 63). Metabolism-, and contraction-related cellular parameters (such as capillary-to-fiber ratio, capillary length density, volume densities of mitochondria and intramyocellular lipid, fiber mean cross sectional area (MCSA) and volume densities of myofibrils) and the volume densities of sarcoplasma were analyzed by quantitative electron microscopy of the biopsies. Gene polymorphisms of ACE (I/D (insertion/deletion), rs1799752), TNC (A/T, rs2104772), and ACTN3 (C/T, rs1815739) were determined using high-resolution melting polymerase chain reaction (HRM-PCR). Genotype distribution was assessed using Chi2 tests. Genotype and phenotype effects were analyzed by univariate or multivariate analysis of variance and post hoc test of Fisher. P-values below 0.05 were considered statistically significant.

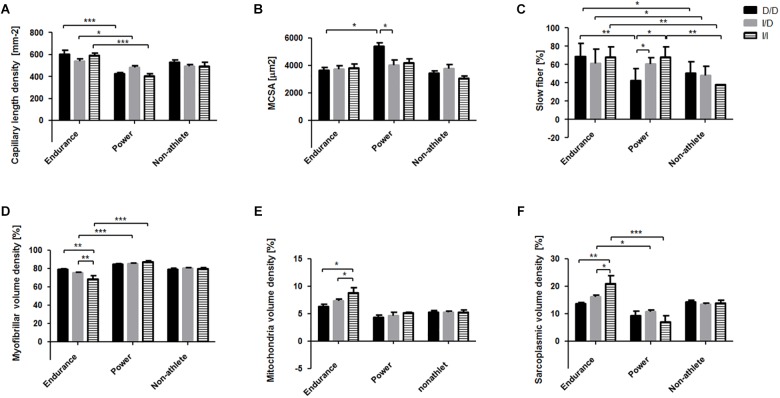
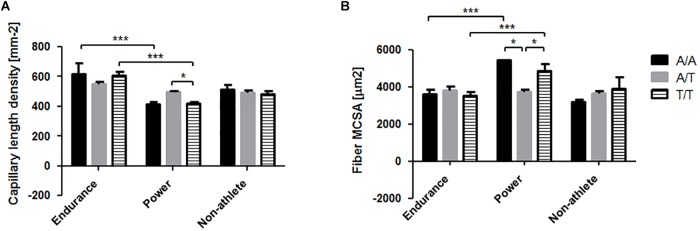
Results: The athletes demonstrated the specialization of metabolism- and contraction-related cellular parameters. Differences in cellular parameters could be identified for genotypes rs1799752 and rs2104772, and localized post hoc when taking the interaction with the phenotype into account. Between endurance and power athletes these concerned effects on capillary length density for rs1799752 and rs2104772, fiber type distribution and volume densities of myofibrils (rs1799752), and MSCA (rs2104772). Endurance athletes carrying the I-allele of rs1799752 demonstrated 50%-higher volume densities of mitochondria and sarcoplasma, when power athletes that carried only the D-allele showed the highest fiber MCSAs and a lower percentage of slow type muscle fibers.

Discussion: ACE and tenascin-C gene polymorphisms are associated with differences in cellular aspects of muscle metabolism and contraction in specifically-trained high level athletes. Quantitative differences in muscle fiber type distribution and composition, and capillarization in knee extensor muscle explain, in part, identified associations of the insertion/deletion genotypes of ACE (rs1799752) with endurance- and power-type Sports.

Keywords: angiotensin; athlete; capillary; gene; mitochondria; muscle; myofibril; tenascin.


Figures

FIGURE 1
FIGURE 1
Fractions of the individual genotypes within the phenotypes. Pie chart displaying the distribution of the three genotypes in the two athlete types (A), and athletes, non-athletes and all subjects combined (B). p-values below each chart refer to the respective significance of the test for Hardy–Weinberg equilibrium.
FIGURE 2
FIGURE 2
M. vastus lateralis composition in the three phenotypes. Bar graphs visualizing the mean and standard deviation of the (A) capillary length density, (B) muscle fiber MCSA, (C) slow type fiber percentage, and volume densities of myofibrils (D), mitochondria (E), intramyofibrillar lipid (F) and sarcoplasma (G). Asterisk indicates significant difference. p < 0.05, ∗∗∗p < 0.001.
FIGURE 3
FIGURE 3
Genotype × phenotype interactions on muscle composition. Color coded heat map visualizing the statistical significance of differences between the three studied genotypes × three phenotypes for parameters of muscle composition. The color scale used to rate the level of significance is indicated to the top right.
FIGURE 4
FIGURE 4
Interaction effects between the phenotype and the rs1799752 (ACE) gene polymorphism on muscle composition. Bar graph of the mean and standard deviation for the investigated muscle characteristics for the rs1799752 genotypes in the two athlete types. For comparison, the values in the non-athletes are shown as well, but without the indication of statistically significant differences. (A) capillary length density, (B) fiber mean cross sectional area (MCSA), (C) slow type fiber percentage, and volume densities of myofibrils (D), mitochondria (E), and sarcoplasmia (F). p < 0.05, ∗∗p < 0.01, ∗∗∗p < 0.005 for the indicated differences.
FIGURE 5
FIGURE 5
Interaction effects between the phenotype and the rs2104772 (TNC) gene polymorphism on muscle composition. Bar graph of the mean and standard deviation for the investigated muscle characteristics for the distinct rs2104772 genotypes in the two athlete types. For comparison, the values in the non-athletes are shown as well, but without the indication of statistically significant differences. (A) capillary length density, (B) fiber MCSA. p < 0.05 and ∗∗∗p < 0.001 for the indicated differences.

References

    1. Aleksandra Z., Zbigniew J., Waldemar M., Agata L. D., Mariusz K., Marek S., et al. (2016). The AGT gene M235T polymorphism and response of power-related variables to aerobic training. J. Sports Sci. Med. 15 616–624. - PMC - PubMed
    1. Ash G. I., Scott R. A., Deason M., Dawson T. A., Wolde B., Bekele Z., et al. (2011). No association between ACE gene variation and endurance athlete status in Ethiopians. Med. Sci. Sports Exerc. 43 590–597. 10.1249/MSS.0b013e3181f70bd6 - DOI - PubMed
    1. Baumann H., Jaggi M., Soland F., Howald H., Schaub M. C. (1987). Exercise training induces transitions of myosin isoform subunits within histochemically typed human muscle fibres. Pflugers Arch. 409 349–360. 10.1007/bf00583788 - DOI - PubMed
    1. Billeter R., Jostarndt-Fogen K., Gunthor W., Hoppeler H. (2003). Fiber type characteristics and myosin light chain expression in a world champion shot putter. Int. J. Sports Med. 24 203–207. 10.1055/s-2003-39092 - DOI - PubMed
    1. Bouchard C., An P., Rice T., Skinner J. S., Wilmore J. H., Gagnon J., et al. (1999). Familial aggregation of VO2max response to exercise training: results from the HERITAGE Family Study. J. Appl. Physiol. 87 1003–1008. 10.1152/jappl.1999.87.3.1003 - DOI - PubMed