. 2019 Apr 11;4(2):e001315.
doi: 10.1136/bmjgh-2018-001315. eCollection 2019.

Tracking global trends in the effectiveness of antibiotic therapy using the Drug Resistance Index

Affiliations

Tracking global trends in the effectiveness of antibiotic therapy using the Drug Resistance Index

Eili Y Klein et al. BMJ Glob Health. .

Abstract

Background: Evaluating trends in antibiotic resistance and communicating the results to a broad audience are important for dealing with this global threat. The Drug Resistance Index (DRI), which combines use and resistance into a single measure, was developed as an easy-to-understand measure of the effectiveness of antibiotic therapy. We demonstrate its utility in communicating differences in the effectiveness of antibiotic therapy across countries.

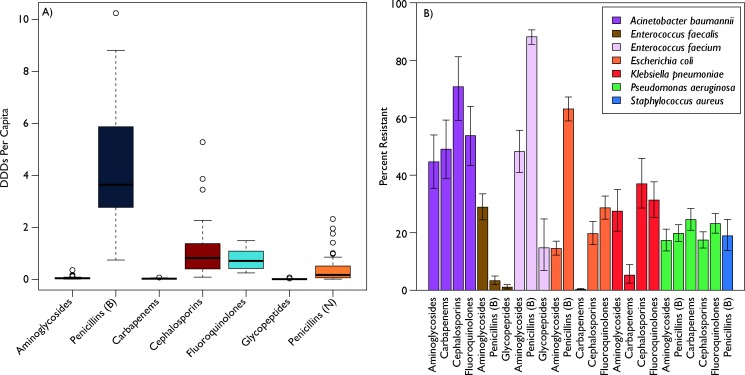
Methods: We calculated the DRI for countries with data on antibiotic use and resistance for the disease-causing organisms considered by the WHO as priority pathogens: Acinetobacter baumannii, Escherichia coli, Klebsiella pneumoniae, Pseudomonas aeruginosa, Staphylococcus aureus, Enterococcus faecium and Enterococcus faecalis. Additionally, we estimated pooled worldwide resistance rates for these pathogens.

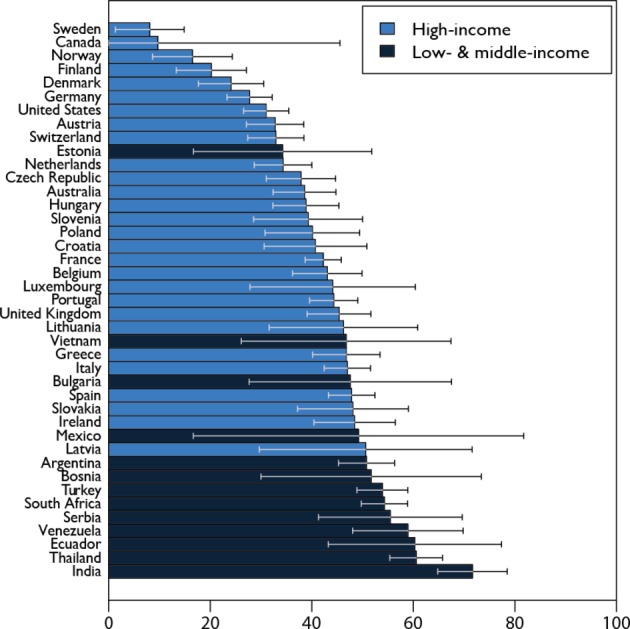
Results: 41 countries had the requisite data and were included in the study. Resistance and use rates were highly variable across countries, but A. baumannii resistance rates were uniformly higher, on average, than other organisms. High-income countries, particularly Sweden, Canada, Norway, Finland and Denmark, had the lowest DRIs; the countries with the highest DRIs, and therefore the lowest effectiveness of antibiotic therapy, were all low-income and middle-income countries.

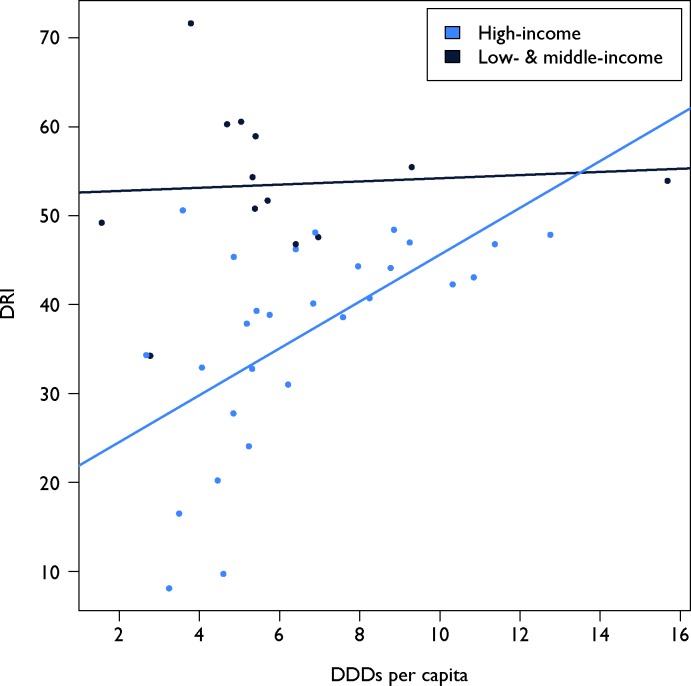
Conclusions: The DRI is a useful indicator of the problem of resistance. By combining data on antibiotic use with resistance, it captures a snapshot of how the antibiotics a country typically uses match their resistance profiles. This single measure of the effectiveness of antibiotic therapy provides a means of benchmarking against other countries and can, over time, indicate changes in drug effectiveness that can be easily communicated.

Keywords: Antibiotic resistance; Onehealth; antibiotic consumption; low- and middle-income countries; public health.


Conflict of interest statement

Competing interests: None declared.

Figures

Figure 1
Figure 1
Global antibiotic use and resistance. (A) Global antibiotic use by antibiotic class. Each bar plots the variability in per capita antibiotic use measured in defined daily doses (DDDs). The black line is the median, the coloured bars are the quartiles, and the whiskers are the extremes. Additional outliers are plotted as circles. Penicillins were split into broad-spectrum, B, and narrow-spectrum, N. (B) Global antibiotic resistance rates for WHO priority pathogens. Each bar is the weighted average global resistance rate for the specified antibiotic–pathogen combination calculated using a meta-analysis framework, and the whiskers are the calculated 95% CIs. Resistance data come from ResistanceMap (resistancemap.cddep.org). Antibiotic use data come from the IQVIA MIDAS database. Source: IQVIA MIDAS, 2000–2015, IQVIA. All rights reserved.
Figure 2
Figure 2
Drug Resistance Index (DRI) across countries. Each bar reports the DRI for countries reporting antibiotic resistance for 5 or more pathogens and for 15 or more pathogen–antibiotic combinations for at least 1 year between 2012 and 2015. Data for the most recent year are shown. All countries included had resistance data for all seven antibiotic classes except Vietnam, which did not have resistance data for glycopeptides. Country income classifications were based on World Bank analytical classifications for fiscal year 2015.
Figure 3
Figure 3
Drug Resistance Index (DRI) for each country compared with its per capita antibiotic use in defined daily doses (DDDs) per 1000 individuals. The light-blue dots are individual high-income countries and the dark-blue dots are individual low-income and middle-income countries. The lines, which are coloured similar to the dots, are the linear trend of the corresponding colour dots. DRI and DDD data are the most recent available for each country between 2012 and 2015. Country income classifications were based on World Bank analytical classifications for fiscal year 2015. Antibiotic use data come from the IQVIA MIDAS database. Source: IQVIA MIDAS, 2000–2015, IQVIA. All rights reserved.
Figure 4
Figure 4
Underlying DRI data for Sweden, USA and India, by antibiotic class, 2015. The top row (A, B) reports the antibiotic use and antibiotic resistance for Sweden in 2015; the middle row (C, D) and the bottom row (E, F) show the corresponding information for USA and India, respectively. Antibiotic use graphs are the proportion of each drug consumed of the total antibiotic use included. Resistance reflects the percentage resistant rates reported from ResistanceMap (resistancemap.cddep.org). Antibiotic use data come from the IQVIA MIDAS database. Source: IQVIA MIDAS, 2000–2015, IQVIA. All rights reserved.

Comment in

References

    1. Klein EY, Van Boeckel TP, Martinez EM, et al. . Global increase and geographic convergence in antibiotic consumption between 2000 and 2015. Proc Natl Acad Sci U S A 2018;115:E3463–E3470. 10.1073/pnas.1717295115 - DOI - PMC - PubMed
    1. Shallcross LJ, Davies DSC. Antibiotic overuse: a key driver of antimicrobial resistance. Br J Gen Pract 2014;64:604–5. 10.3399/bjgp14X682561 - DOI - PMC - PubMed
    1. Hashemi S, Nasrollah A, Rajabi M. Irrational antibiotic prescribing: a local issue or global concern? Excli J 2013;12:384–95. - PMC - PubMed
    1. Garg AK, Agrawal N, Tewari RK, et al. . Antibiotic prescription pattern among Indian oral healthcare providers: a cross-sectional survey. J Antimicrob Chemother 2014;69:526–8. 10.1093/jac/dkt351 - DOI - PubMed
    1. Li Y, Xu J, Wang F, et al. . Overprescribing in China, driven by financial incentives, results in very high use of antibiotics, Injections, and corticosteroids. Health Aff 2012;31:1075–82. 10.1377/hlthaff.2010.0965 - DOI - PubMed

LinkOut - more resources