

A Simple and Improved Predictor of Insulin Resistance Extracted From the Oral Glucose Tolerance Test: The I0*G60
- PMID: 31139762
- PMCID: PMC6532672
- DOI: 10.1210/js.2018-00342
A Simple and Improved Predictor of Insulin Resistance Extracted From the Oral Glucose Tolerance Test: The I0*G60
Abstract
Objective: To evaluate the diagnostic performance of several biochemical predictors of insulin resistance (IR).
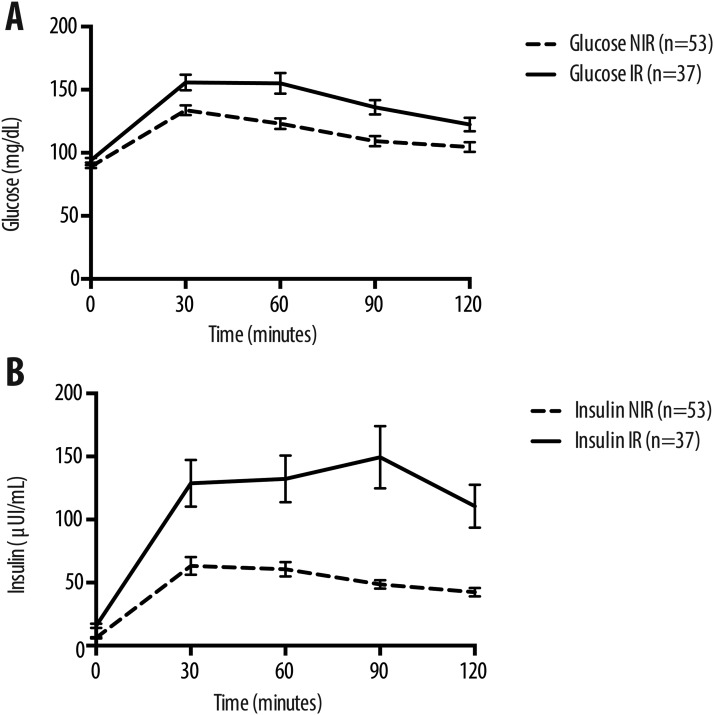
Design: A total of 90 nondiabetic subjects were tested with both the pancreatic suppression test (PST) and the oral glucose tolerance test (OGTT). Of them, 53 were non-insulin-resistant (NIR) subjects and the remaining 37 were insulin resistant subjects.
Results: All glucose and insulin values from the OGTT were positively correlated with the steady-state plasma glucose (SSPG) value of the PST. Among the OGTT values, basal insulin (I0) displayed a stronger correlation with SSPG (r = 0.604). Receiver operating characteristic analysis of the OGTT data demonstrated that I0 exhibited the highest area under the receiver operating characteristic curve (AUROC), compared with the rest of the OGTT data. However, the reduced sensitivity of this predictor precluded its clinical use.We then tested six potential predictors of IR derived from the OGTT values. Of them, the I0*G60 had a correlation coefficient of 0.697 with the SSPG and an AUROC of 0.867, surpassing the respective values of the traditional biochemical predictors of IR. Its cutoff predicting IR was >1110 mg/dL*μΙU/mL (>428 nM*pM), its sensitivity was 0.865, and its global accuracy was 0.822. We then selected the six best biochemical predictors of IR according to their posttest probability ratio. The order was as follows: I0*G60, ISI composite, AUC-Gl*In/', quantitative insulin sensitivity check index, homeostatic model assessment 1 (HOMA1), and HOMA2.
Conclusion: We conclude that the I0*G60 is a promising, inexpensive, and easily calculable predictor of IR that outperforms the predictive power of the traditional predictors of IR, including the insulin sensitivity index composite.
Keywords: biochemical predictors; insulin resistance; oral glucose tolerance test; pancreatic suppression test.
Figures
References
-
- DeFronzo RA, Tobin JD, Andres R. Glucose clamp technique: a method for quantifying insulin secretion and resistance. Am J Physiol. 1979;237(3):E214–E223. - PubMed
-
- Cheal KL, Abbasi F, Lamendola C, McLaughlin T, Reaven GM, Ford ES. Relationship to insulin resistance of the adult treatment panel III diagnostic criteria for identification of the metabolic syndrome. Diabetes. 2004;53(5):1195–1200. - PubMed
-
- McLaughlin T, Abbasi F, Cheal K, Chu J, Lamendola C, Reaven G. Use of metabolic markers to identify overweight individuals who are insulin resistant. Ann Intern Med. 2003;139(10):802–809. - PubMed
-
- Falta W, Boller R. Insularer und insulinresistenter diabetes. Klin Wochenschr. 1931;10(10):438–443.
-
- Himsworth HP. Diabetes mellitus: its differentiation into insulin-sensitive and insulin-insensitive types. Lancet. 1936;227(5864):127–130. - PubMed
LinkOut - more resources
Full Text Sources
Miscellaneous