Review
. 2019 Jul 1;99(3):1527-1573.
doi: 10.1152/physrev.00027.2018.

Diverse Cell Types, Circuits, and Mechanisms for Color Vision in the Vertebrate Retina

Affiliations
Review

Diverse Cell Types, Circuits, and Mechanisms for Color Vision in the Vertebrate Retina

Wallace B Thoreson et al. Physiol Rev. .

Abstract

Synaptic interactions to extract information about wavelength, and thus color, begin in the vertebrate retina with three classes of light-sensitive cells: rod photoreceptors at low light levels, multiple types of cone photoreceptors that vary in spectral sensitivity, and intrinsically photosensitive ganglion cells that contain the photopigment melanopsin. When isolated from its neighbors, a photoreceptor confounds photon flux with wavelength and so by itself provides no information about color. The retina has evolved elaborate color opponent circuitry for extracting wavelength information by comparing the activities of different photoreceptor types broadly tuned to different parts of the visible spectrum. We review studies concerning the circuit mechanisms mediating opponent interactions in a range of species, from tetrachromatic fish with diverse color opponent cell types to common dichromatic mammals where cone opponency is restricted to a subset of specialized circuits. Distinct among mammals, primates have reinvented trichromatic color vision using novel strategies to incorporate evolution of an additional photopigment gene into the foveal structure and circuitry that supports high-resolution vision. Color vision is absent at scotopic light levels when only rods are active, but rods interact with cone signals to influence color perception at mesopic light levels. Recent evidence suggests melanopsin-mediated signals, which have been identified as a substrate for setting circadian rhythms, may also influence color perception. We consider circuits that may mediate these interactions. While cone opponency is a relatively simple neural computation, it has been implemented in vertebrates by diverse neural mechanisms that are not yet fully understood.


Conflict of interest statement

No conflicts of interest, financial or otherwise, are declared by the authors.

Figures

None
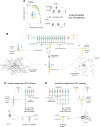
Graphical abstract
FIGURE 1.
FIGURE 1.
Photoreceptor cell spectral sensitivities from turtle (A), mouse (B), and trichromatic primate (C). A: pigment absorbance spectra of turtle rods (Rh1 pigment, 502 nm peak absorbance), long wavelength cones (LWS, 615 nm), middle wavelength cones (Rh2, 514 nm), short wavelength cones (SWS2, 457 nm), and ultraviolet (UV) (SWS1, 371 nm) cones. B: absorbance spectra of mouse rods (Rh1, 502 nm), S cones (360 nm), and M cones (510 nm). C: absorbance spectra of trichromatic primate rods (Rh1, 495 nm), S cones (SWS1, 420 nm), M cones (LWS, 534 nm), and L cones (LWS, 564 nm) as well as melanopsin (482 nm). Absorbance spectra were simulated using A1-based visual pigment nomograms with the peak absorbance values given above (90, 163, 210, 282).
FIGURE 2.
FIGURE 2.
Photoreceptor mosaics. A: photoreceptor mosaic in zebrafish showing the regular array of double cones alternating with SWS1 and SWS2 single cones. The large primary member of the double cones possesses LWS pigment, and the shorter accessory member possesses Rh2 pigment. This orderly array is maintained across the retina (blue = SWS2 opsin; green = Rh2 opsin; violet = SWS1 opsin; red = LWS opsin) (Image courtesy of R. Wong, unpublished data.) B: cones of the mouse in dorsal versus ventral retina. Left panel: immunostaining of M (red) and S (green) opsins in dorsal retina where the great majority of cones express only M opsin. An S cone is circled. Right panel: in ventral retina, many of the M cones also express S opsin. A cone containing both M and S opsin is circled. [Adapted from Haverkamp et al. (182).] C: photoreceptor mosaic in the macaque monkey retina in an unstained preparation from mid-peripheral retina. Plane of focus is on the inner segments; the lower density large cone profiles are irregularly and randomly arranged in a sea of smaller rod profiles. Rods greatly outnumber cones except in the central retina (Dacey, unpublished data). D: human cone types identified in the living eye at ~1 degree (~250 µm) from the foveal center by adaptive optics imaging combined with retinal densitometry from 5 human subjects (each panel is from a different subject) (192, 193). L cone (red) and M cone (green) ratio is variable across subjects with some individuals showing an array dominated by M cones (leftmost panel) and others by L cones (rightmost panel). Note that L and M cones appear to be arranged randomly, while the sparse S cones (blue) form a more regular mosaic. [Adapted from Brainard (26) and Hofer et al. (193), with permission.]
FIGURE 3.
FIGURE 3.
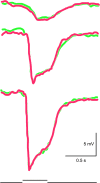
Univariant responses of a red-sensitive turtle cone to red (680 nm) and green (550 nm) lights evoked by 0.4-s flashes of 0.2 mm diameter. The intensity of 680-nm light was adjusted to evoke a hyperpolarizing response that matched the amplitude of the response to 500 nm. The matched responses are superimposed.
FIGURE 4.
FIGURE 4.
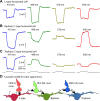
Silent substitution method applied to identify L, M, and S cones in the macaque monkey retina. The traces show light-evoked membrane current responses from single L, M, and S cones in the intact retina in response to sinusoidal modulation of stimuli arising from 3 primary lights (75, 347). The colored traces at the bottom show the calculated quantal catch during 2 stimulus cycles (R*/s) for L (red), M (green), and S (blue) cones with each of the 3 primary lights for L, M, and S cone isolating stimulus configurations. This method was used to distinguish the sparse S cones from the majority L and M cones in the overall cone array.
FIGURE 5.
FIGURE 5.
Inhibitory feedback from horizontal cells to cones. Schematic diagram shows a central cone with recording pipette that receives inhibitory feedback from a horizontal cell driven by annular illumination of the receptive field surround. A: recording from a turtle cone showing that illuminating this cone with a small spot of light evoked a hyperpolarizing response. Subsequent application of an annulus to illuminate the receptive field surround caused the surrounding cones to hyperpolarize, which in turn caused their postsynaptic horizontal cells to hyperpolarize. The resulting change in inhibitory feedback from horizontal cells back to the central cone generated a depolarizing response in that cone [cone response from Burkhardt et al. (42).] B: illustration of horizontal cell feedback effects on the cone calcium current (ICa). The change in inhibitory feedback produced by hyperpolarization of a postsynaptic horizontal cell causes cone ICa to activate at more negative potentials and increases its peak amplitude, thereby increasing the amplitude of ICa within the normal physiological range of cone membrane potentials between −40 and −60 mV.
FIGURE 6.
FIGURE 6.
Color opponency in horizontal cells. A: illustration of the response of an L-type horizontal cell shows that it hyperpolarizes to a wide range of visible wavelengths. B: biphasic C-type horizontal cell showing a hyperpolarizing response to 410 and 490 nm light but depolarizing responses to 570 and 650 nm light. C: triphasic C-type horizontal cell showing a hyperpolarizing response to 410 nm light, depolarizing response to 490 nm light, and hyperpolarizing responses to 570 and 650 nm light. Examples are from zebrafish retina (66). D: schematic illustration of the cascade model for color opponency. In this hypothesis, the responses of LWS (L) cones are predominantly responsible for driving hyperpolarizing responses in L-type horizontal cells. The hyperpolarizing responses of L-type horizontal cells are inverted by inhibitory feedback to Rh2 (M) cones, and the responses of Rh2 cones are then fed forward to biphasic C-cells. This yields hyperpolarizing responses to green light driven by the Rh2 cone light response and depolarizing responses to red light driven by inhibitory feedback from L-type horizontal cells. Inhibitory feedback to SWS2 (S) cones inverts the responses of biphasic horizontal cells to generate depolarizing responses to middle wavelengths and hyperpolarizing responses to longer wavelength light in triphasic C-cells, along with hyperpolarizing responses to blue light generated by the SWS2 cone light response.
FIGURE 7.
FIGURE 7.
Morphology and cone connectivity of horizontal cell types in the primate retina. A: somato-dendritic morphology of H1 and H2 horizontal cell types revealed in Golgi-stained retina from macaque monkey. H1 cells make dense contacts with L and M cones (red and green circle insets) but avoid contact with S cones; conversely, H2 cells make dense contacts with S cones (blue circle inset) but only sparse contacts with L and M cones. B: camera lucida tracing of the network of cone connections in H2 cells filled with Neurobiotin, which passes through H2-H2 cell gap junctions. Note the sparse contact with the majority (M/L) cones and dense contacts with three presumed S cones in this field. C: H2 cells hyperpolarize in response to stimuli across the visible spectrum and lack cone opponency. Top trace shows an H2 cell voltage response evoked by combined stimulation of L, M, and S cones; bottom trace shows the response to an S cone isolating stimulus. [Adapted from Dacey et al. (91).]
FIGURE 8.
FIGURE 8.
An early conception of color opponent circuitry suggested by Wiesel and Hubel (498) based on extracellular recordings made in the primate lateral geniculate nucleus. Left: type 1 cells with clear antagonistic center-surround receptive field organization were envisioned to draw inputs from distinct cone types (in this diagram, L cones to the excitatory center and M cones to the antagonistic surround). Depending on stimulus configuration, these cells could transmit both achromatic spatial or chromatic signals. This type of pathway was subsequently linked to the midget ganglion cells, and our current understanding of the circuitry of this pathway is discussed further in this review. Right: type 2 cells lacked clear center-surround organization and instead showed antagonistic cone inputs to the receptive field (in this schema L+M cones vs. S cones) that are spatially coextensive. Type 2 cells were envisioned to play a specialized role in pure color-coding. This type of pathway has subsequently been associated with S cone signaling in the primate small bistratified ganglion cell type. Current understanding of the diversity of S cone circuitry in mammalian retina is discussed further in the text.
FIGURE 9.
FIGURE 9.
S cone circuitry in dichromatic, nonprimate mammals utilizes inner retinal inhibitory pathways to achieve spectral opponency in the OFF pathway. A: in the retina of a cone dominant ground squirrel, an S cone (blue) contacts an S cone ON bipolar cell (magenta) whose dendrites terminate in the inner, more vitreal half of the inner plexiform layer (IPL). The S cone signal is transmitted from S cone bipolar cells via glycinergic synapses to S cone amacrine cells (green; B and C). D: superimposed time courses of S (blue lines) and M (green lines) cone inputs to S OFF/M ON ganglion cells recorded simultaneously using a multielectrode recording array in the retina of a ground squirrel. When cone inputs into ON bipolar cells were attenuated with a combination of 50 μM l-AP4 and 75 μM LY341495 (LY/AP4), both S OFF and M ON responses were abolished. When glycinergic inputs from amacrine cells to ganglion cells were attenuated by application of 100 μM strychnine, the S OFF signals but not M ON signals were abolished, confirming the requirement for an inhibitory sign-reversing amacrine cell as the basis for S OFF opponency in this species. [Adapted from Chen and Li (63) and Sher and DeVries (407), with permission.]
FIGURE 10.
FIGURE 10.
Asymmetry in the circuitry for ON versus OFF S cone-based opponency in the primate retina. A: left panel plots spatial tuning (response amplitude as a function of spatial frequency) of S ON and L+M OFF responses from a macaque blue ON small bistratified ganglion cell. Overlap of the spatial tuning plots shows the spatially coextensive S ON and L+M OFF fields. Gaussian fits to the data are illustrated by the inset profiles with Gaussian radii indicated. Right panel: top, spike discharge to sine-modulated S versus L+M stimuli. Bottom, L+M response is preserved after attenuation of the ON pathway and inhibitory transmission. B: circuitry for the small bistratified cell. S ON and L+M OFF responses arise from parallel ON and OFF pathway excitatory inputs to the bistratified ganglion cell dendritic tree. ON and OFF L+M surrounds arising from H1 and H2 cell feedback to cones appear to largely cancel at the ganglion cell level. C: in contrast to the small bistratified cell, the S OFF pathway originates in the midget circuit with a private-line OFF midget bipolar cell connected to each S cone in central retina and an L+M ON surround provided by H2 horizontal cell feedback to S cones. D: in the retinal periphery, OFF ganglion midget cells receive convergent input from S, L, and M cones, eliciting a weaker S cone contribution to the receptive field and more complex chromatic tuning (see text for discussion and references).
FIGURE 11.
FIGURE 11.
Serial block-face scanning electron microscopy confirms an S OFF midget pathway in the macaque monkey retina. A: image of a single vertical section at the level of the cone pedicles obtained 400 µm from the foveal center illustrates the reconstruction process. An S cone pedicle (light blue fill) is flanked by neighboring L and M cone pedicles (light green and red fill). The smaller painted profiles extending toward the S cone pedicle base are S ON bipolar (dark blue) and flat-OFF midget bipolar cell (yellow) dendritic branches (synaptic ribbons, red). B: reconstruction of 4 cone pedicles (3 L/M cones, yellow; and 1 S cone, blue) rotated to view their synaptic faces. S cone pedicles were identified by their smaller size and the absence of the telodendria (arrows) that interconnect L and M cones. S cone identity was further confirmed by their unique and exclusive synaptic connection to the morphologically distinct S cone bipolar cell (as shown in C, D, and F). C: reconstructed S cone pedicle showing its synaptic ribbons (red) and postsynaptic dendritic contacts with an OFF midget bipolar (yellow) and two S ON bipolar cells (dark blue). Note that the S ON bipolar cell dendrites form multiple branches which extend for some distance laterally to converge on the S cone pedicle; in contrast, the OFF midget bipolar extends a single thick dendrite to the pedicle surface where it divides profusely into many small flat contacts with the pedicle base. D: vertical view of two S cone ribbon clusters (red ribbons; pedicle transparent) synapsing with 3 S cone ON bipolar and two OFF midget bipolar cells illustrates the morphology and relative depth of stratification of the axon terminals in the inner plexiform layer (IPL). S ON bipolar cells terminate close to the inner border, and OFF midget bipolar cells terminate near the outer border of the IPL. E: outlines of 185 cone pedicles reconstructed in a patch of the cone mosaic in which 17 regularly spaced pedicles (~9%; blue) were found to be S cones; the majority L/M cones are shown in yellow. F: each of the S cones made synaptic contact with invaginating central elements that arose exclusively from a homogeneous population of 26 S cone bipolar cells (~1.5 S ON bipolar cells/S cone). G: each of the 17 S cones also received dense flat contacts from an OFF midget bipolar cell; as expected, there was a single OFF-midget bipolar dedicated to each S cone. Nine of these OFF-midget bipolar cells were completely contained within the volume and reconstructed to their axon terminals. H: each of these 9 OFF midget bipolar cells synapsed exclusively with a single OFF-midget ganglion cell confirming a “private line” synaptic pathway from S cone to ganglion cell. [All data shown in the figure from Dacey et al. (93).]
FIGURE 12.
FIGURE 12.
In the primate retina, red-green color opponency piggybacks on the achromatic midget pathway. A: midget ganglion cells in the central retina draw input from individual L or M cones. The dendritic trees of midget ganglion cells enlarge with increasing distance from the fovea to draw combined inputs from an increasing number of L and M cones. B: physiologically, midget ganglion cells show both red-green opponent (L vs. M) chromatic and achromatic (L+M) light responses, depending on stimulus spatial frequency and the relative weighting of L and M cone inputs to the receptive field center versus the antagonistic surround. This example from an L ON cell shows bandpass characteristics to L cone stimuli but a notch and accompanying phase reversal in the frequency response when using M cone stimuli. At low spatial frequencies, M cone inputs are dominated by inhibitory feedback from horizontal cells that receive input from both M and L cones. At high spatial frequencies, M cone inputs are dominated by excitatory inputs from single cones that are in phase with the excitatory inputs from L cones. C: in instances where L and M cone weighting is similar in the center and surround, midget cells show purely achromatic responses with similar bandpass frequency characteristics using both M and L cone-isolating stimuli. D: center versus surround L and M cone weights sampled randomly from the cone mosaic in a model of the midget receptive field (2,154 model receptive fields at a range of retinal locations) can explain variation in L versus M opponency in the midget cell population (see Ref. for details).

References

    1. Ahnelt P, Kolb H. Horizontal cells and cone photoreceptors in human retina: a Golgi-electron microscopic study of spectral connectivity. J Comp Neurol 343: 406–427, 1994. doi:10.1002/cne.903430306. - DOI - PubMed
    1. Ahnelt PK. The photoreceptor mosaic. Eye (Lond) 12, Pt 3b: 531–540, 1998. doi:10.1038/eye.1998.142. - DOI - PubMed
    1. Allen AE, Hazelhoff EM, Martial FP, Cajochen C, Lucas RJ. Exploiting metamerism to regulate the impact of a visual display on alertness and melatonin suppression independent of visual appearance. Sleep (Basel) 41: zsy100, 2018. doi:10.1093/sleep/zsy100. - DOI - PMC - PubMed
    1. Allen AE, Storchi R, Martial FP, Bedford RA, Lucas RJ. Melanopsin Contributions to the Representation of Images in the Early Visual System. Curr Biol 27: 1623–1632.e4, 2017. doi:10.1016/j.cub.2017.04.046. - DOI - PMC - PubMed
    1. Allison WT, Barthel LK, Skebo KM, Takechi M, Kawamura S, Raymond PA. Ontogeny of cone photoreceptor mosaics in zebrafish. J Comp Neurol 518: 4182–4195, 2010. doi:10.1002/cne.22447. - DOI - PMC - PubMed

Publication types