. 2019 May 29:8:e45571.
doi: 10.7554/eLife.45571.

Club cells form lung adenocarcinomas and maintain the alveoli of adult mice

Affiliations

Club cells form lung adenocarcinomas and maintain the alveoli of adult mice

Magda Spella et al. Elife. .

Abstract

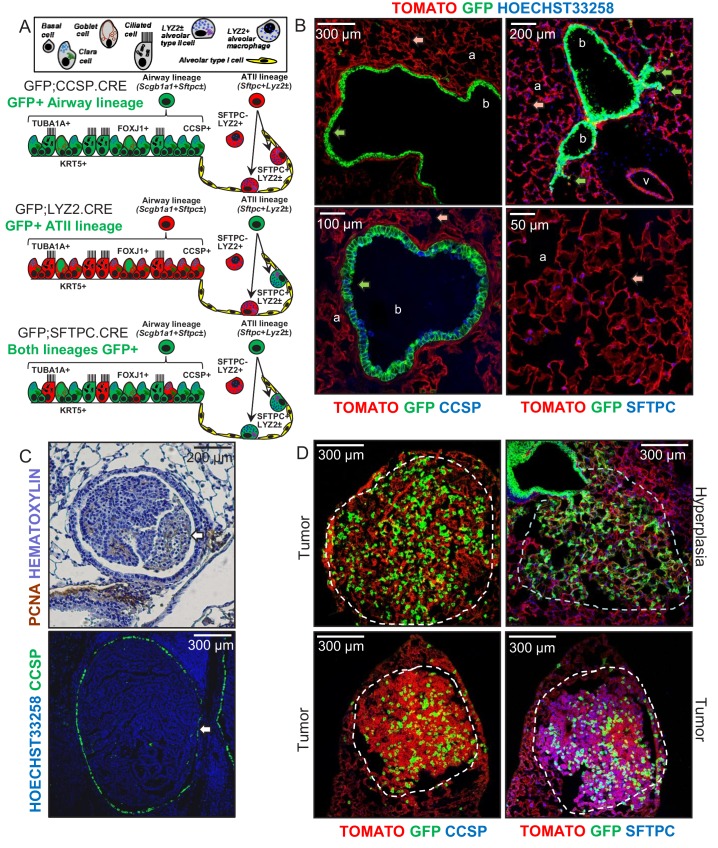
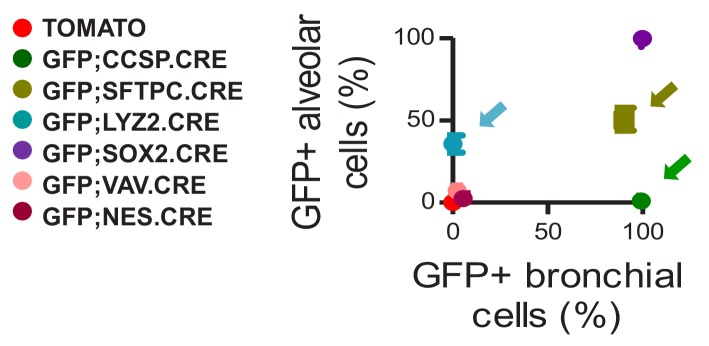
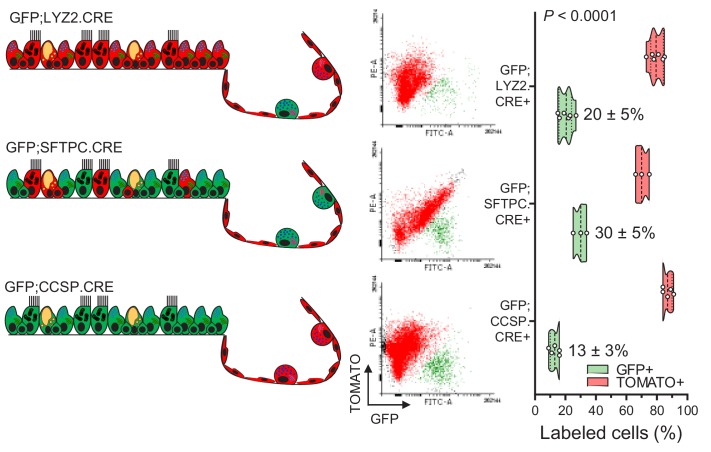
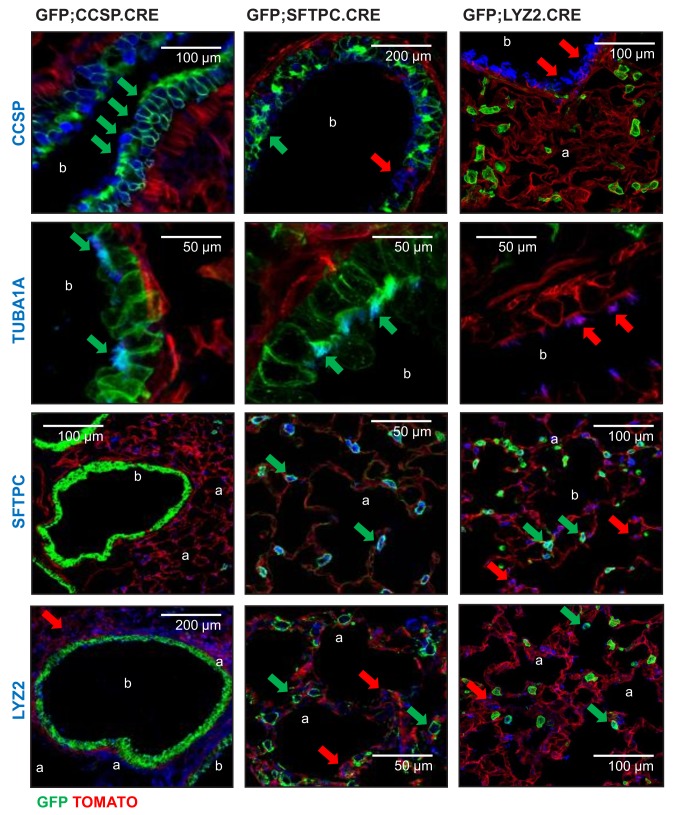
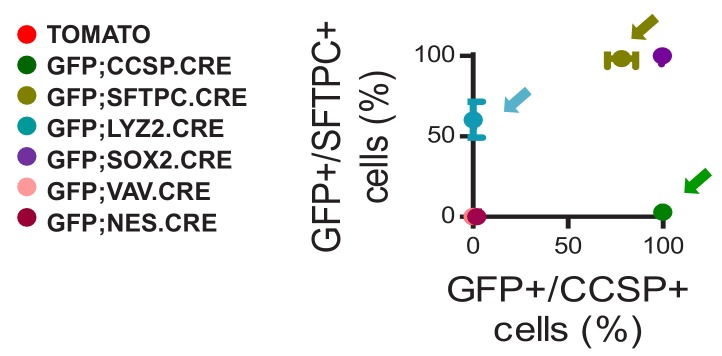
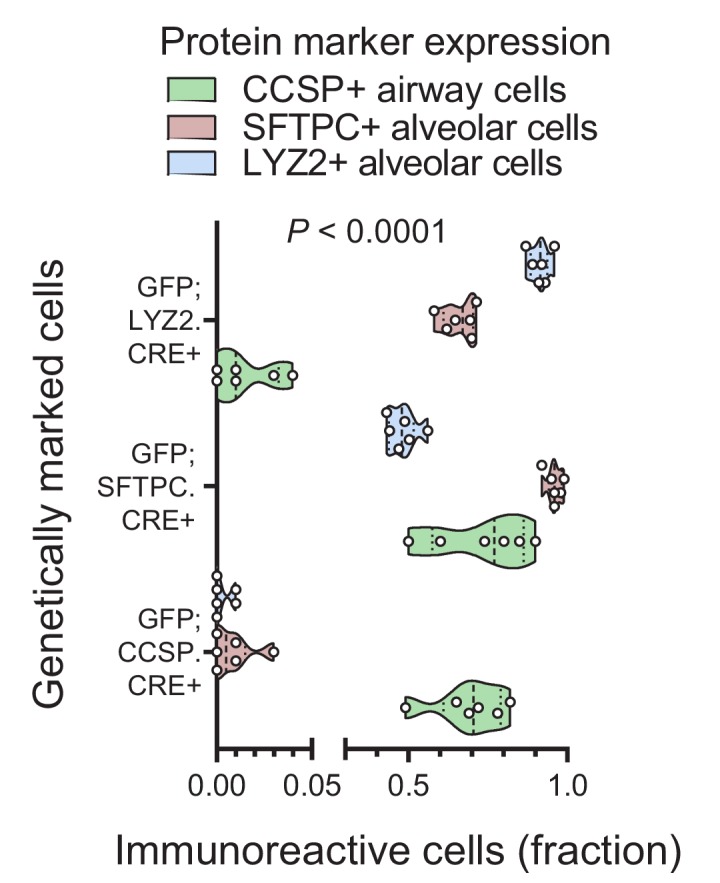
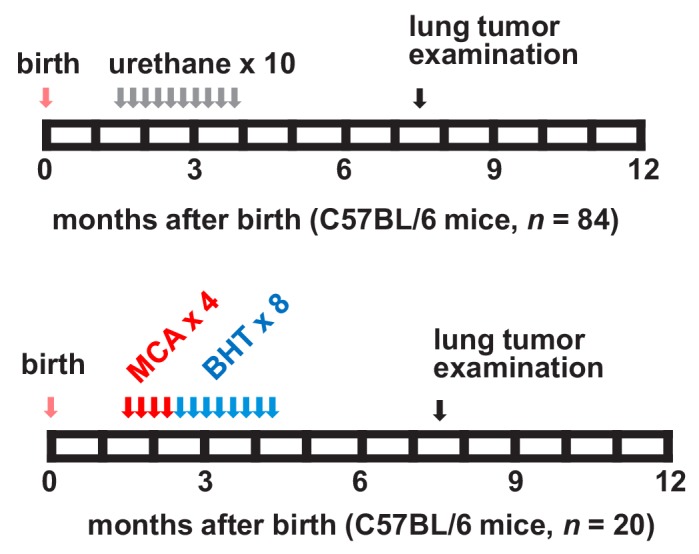
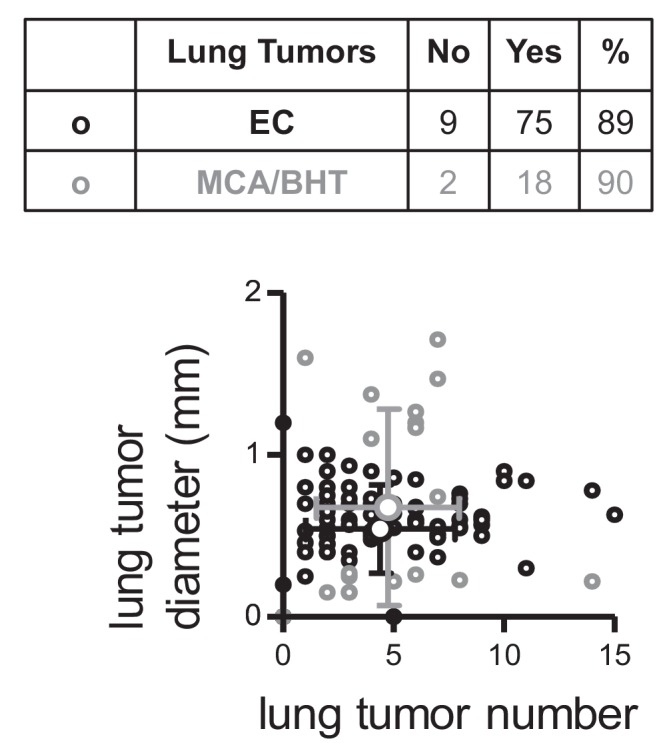
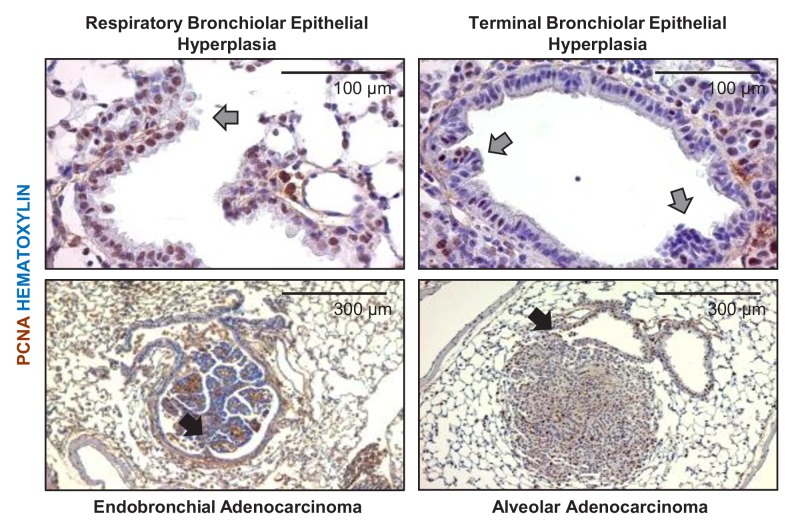
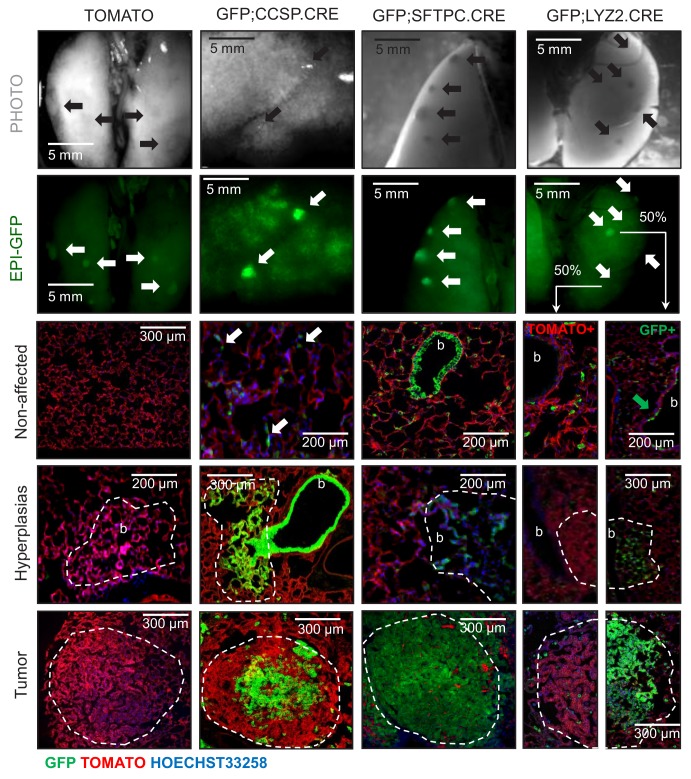
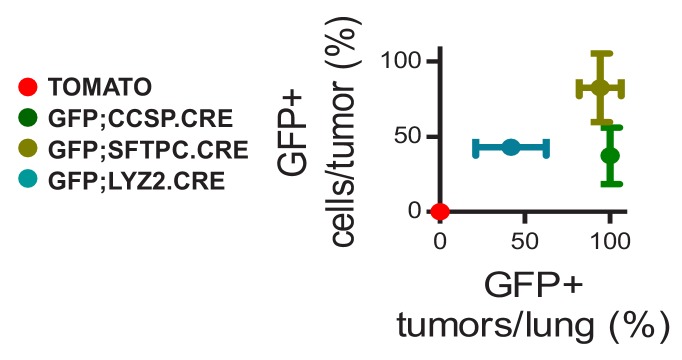
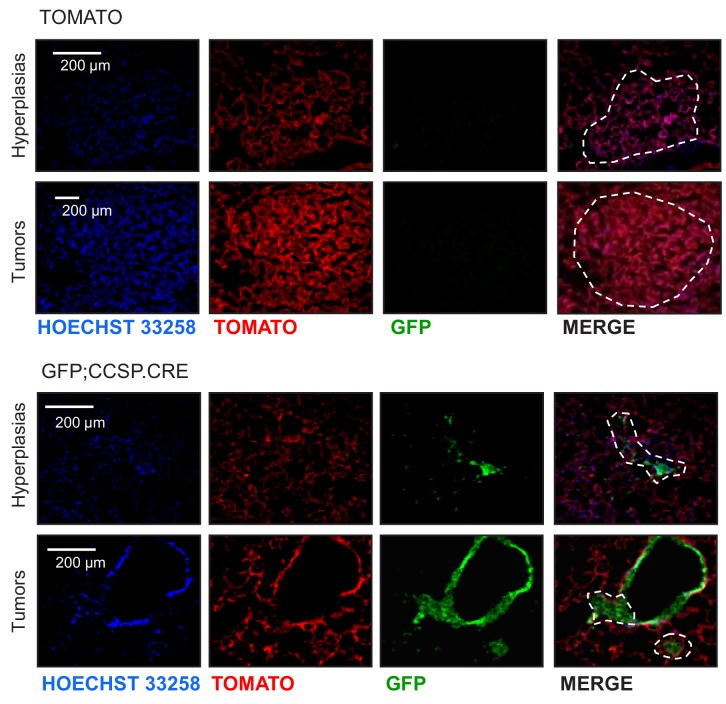
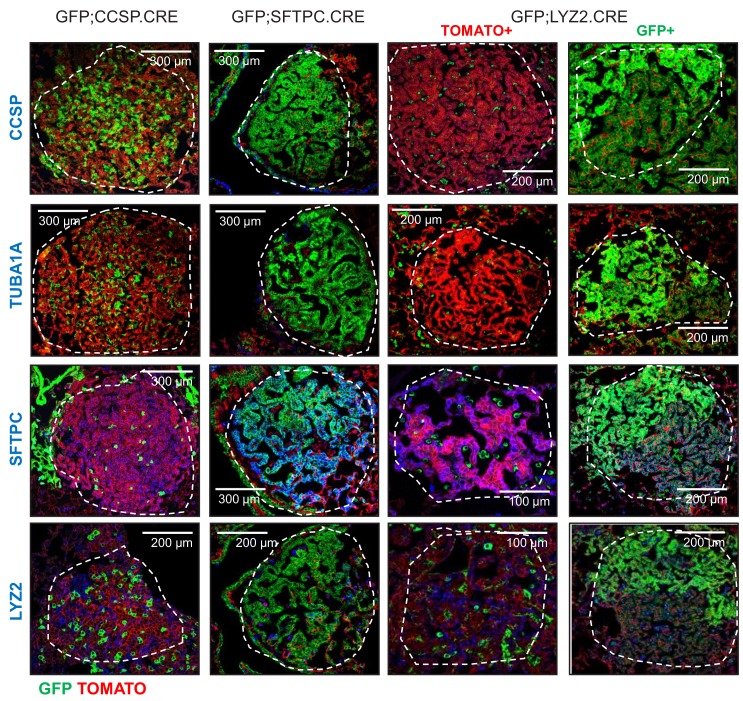
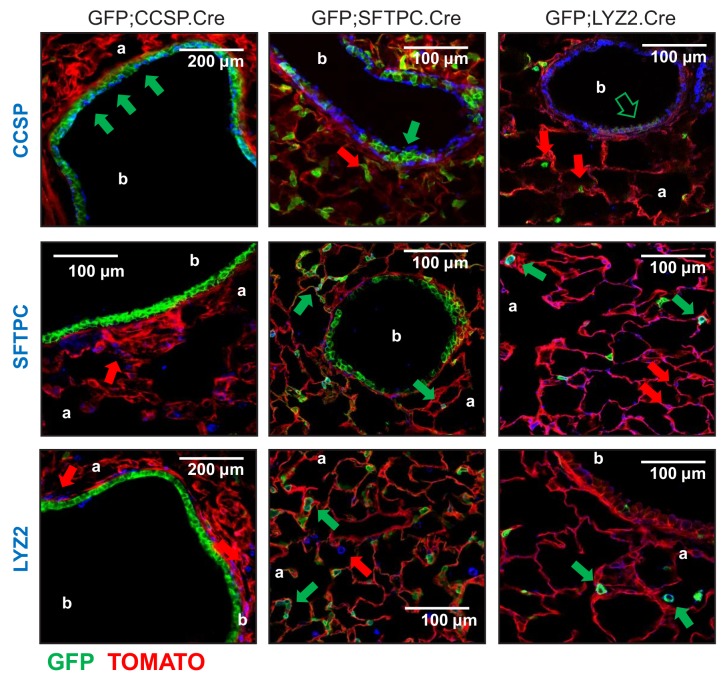
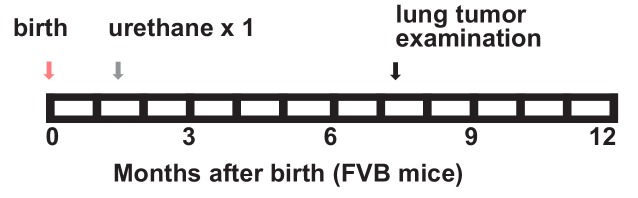
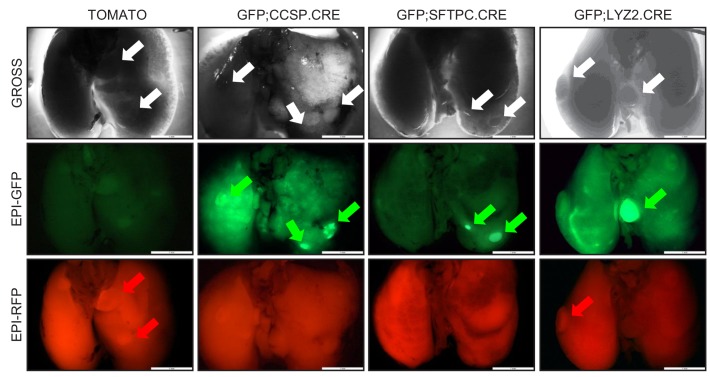
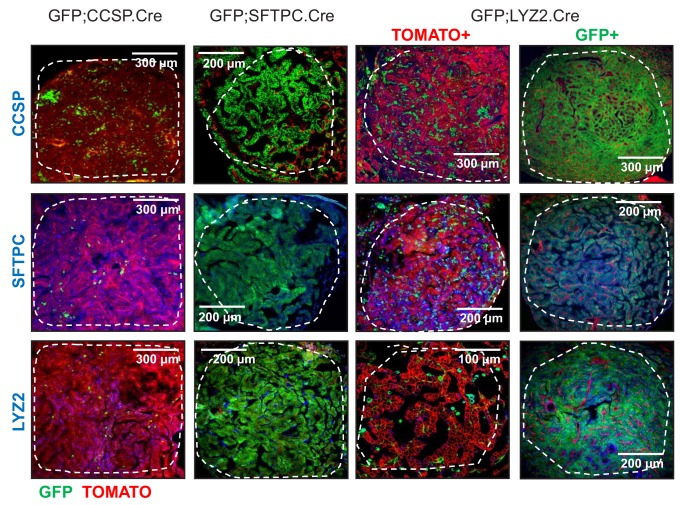
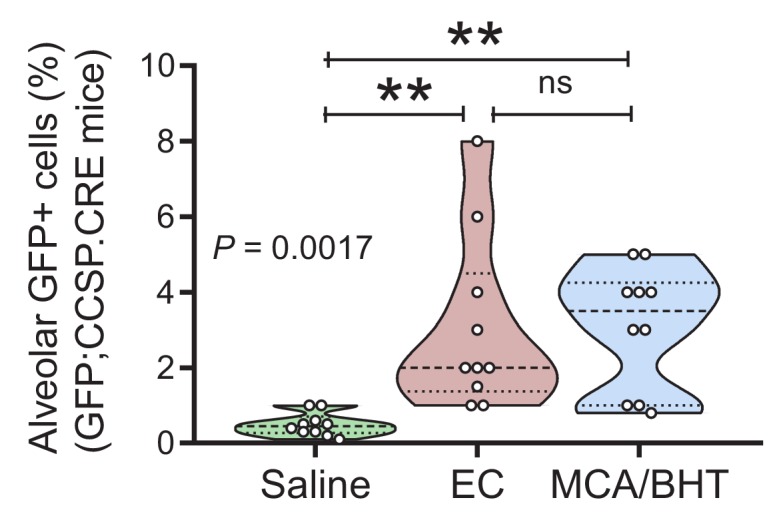
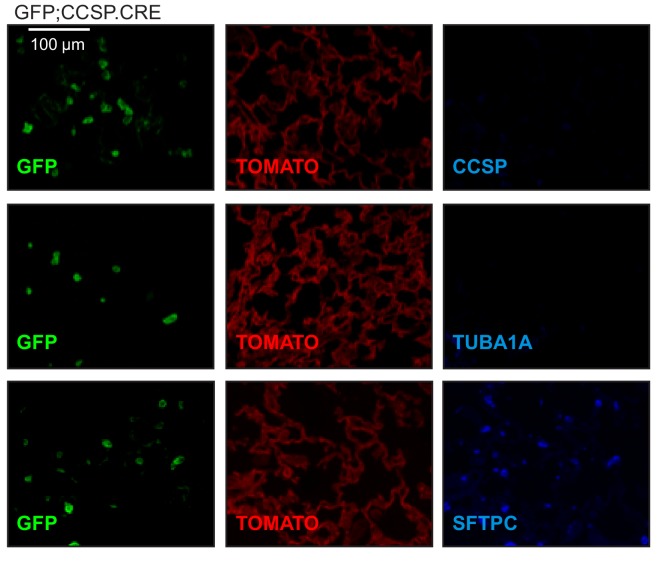
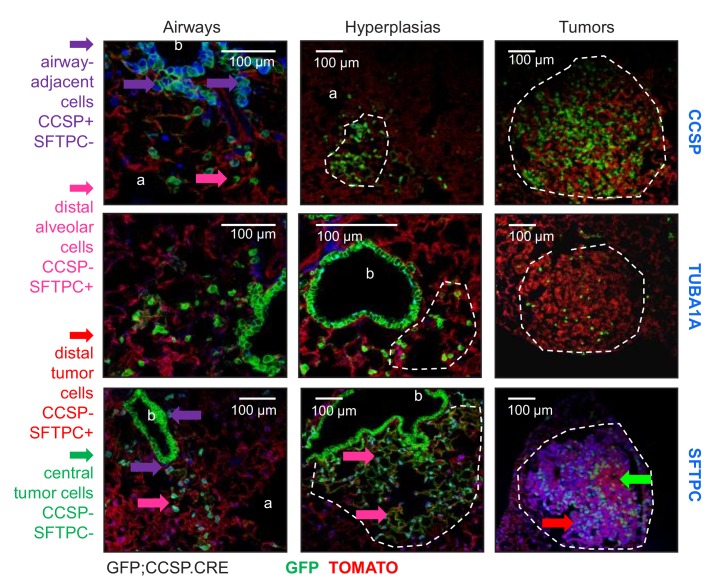
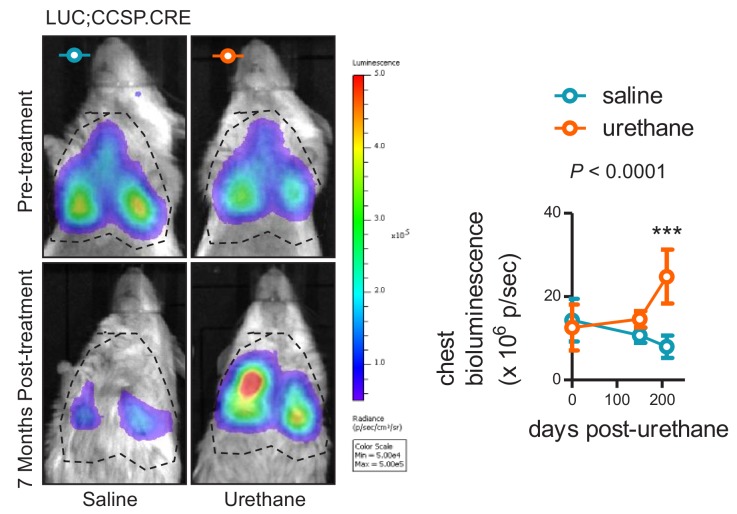
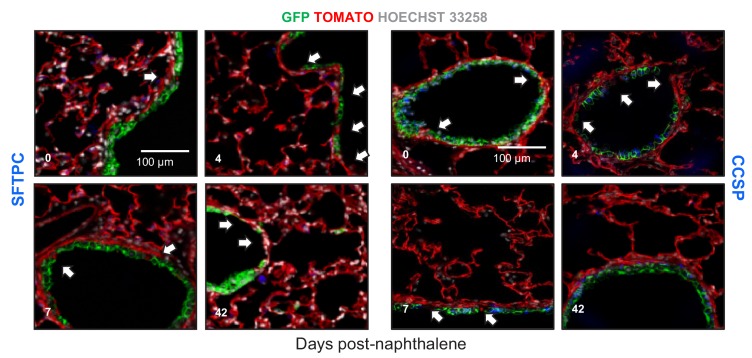
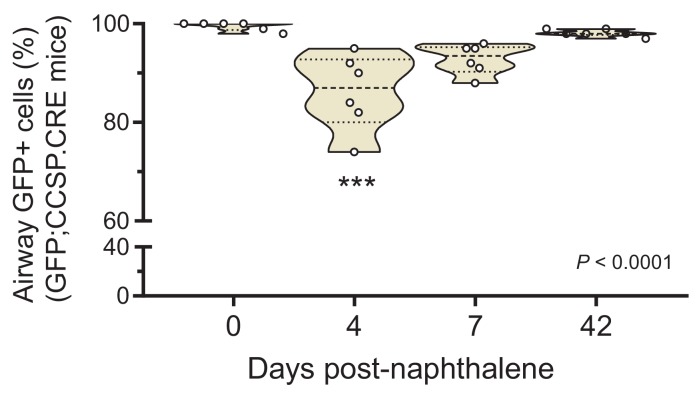
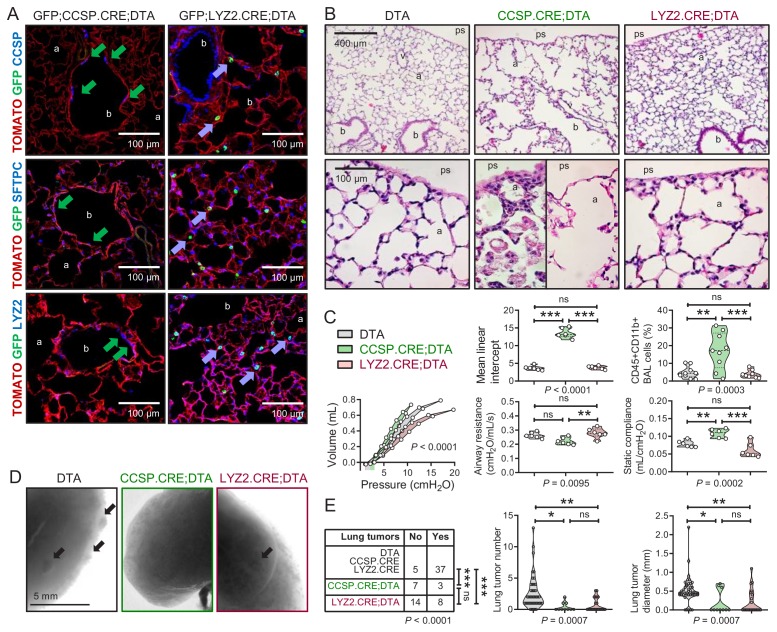
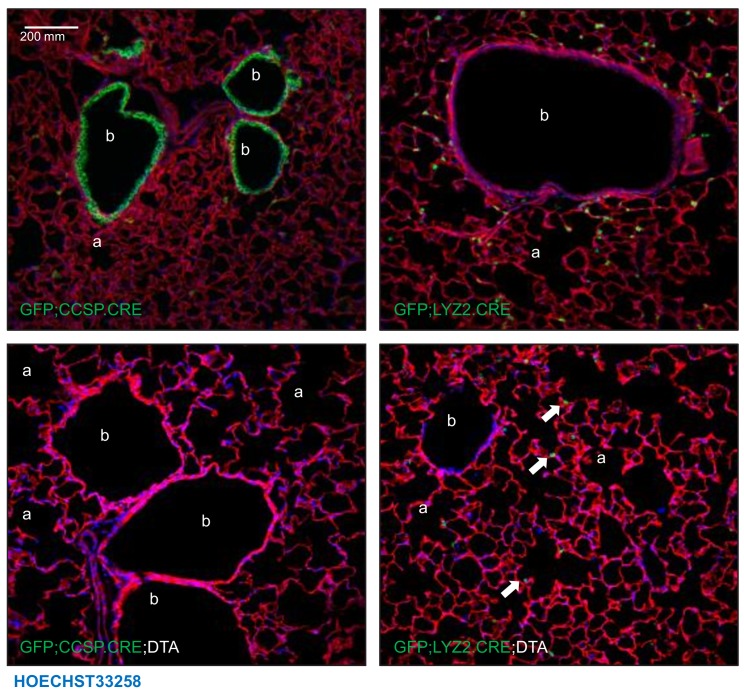
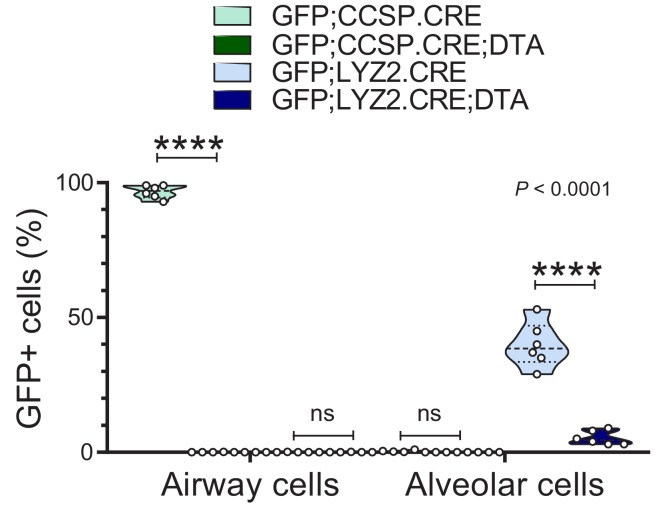
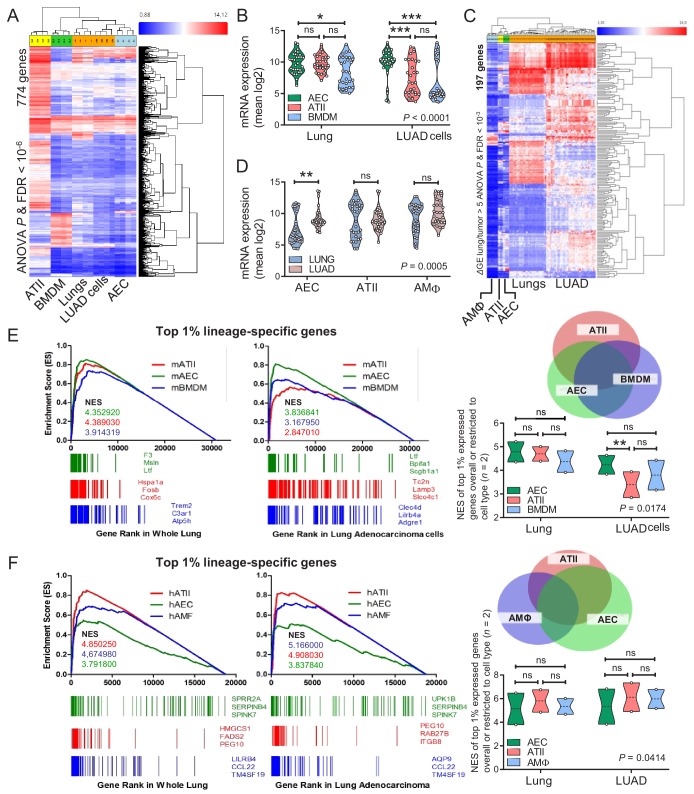
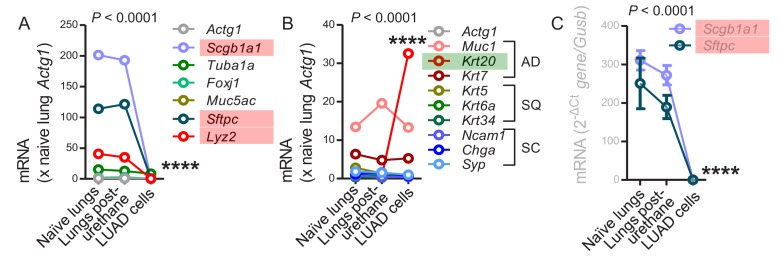
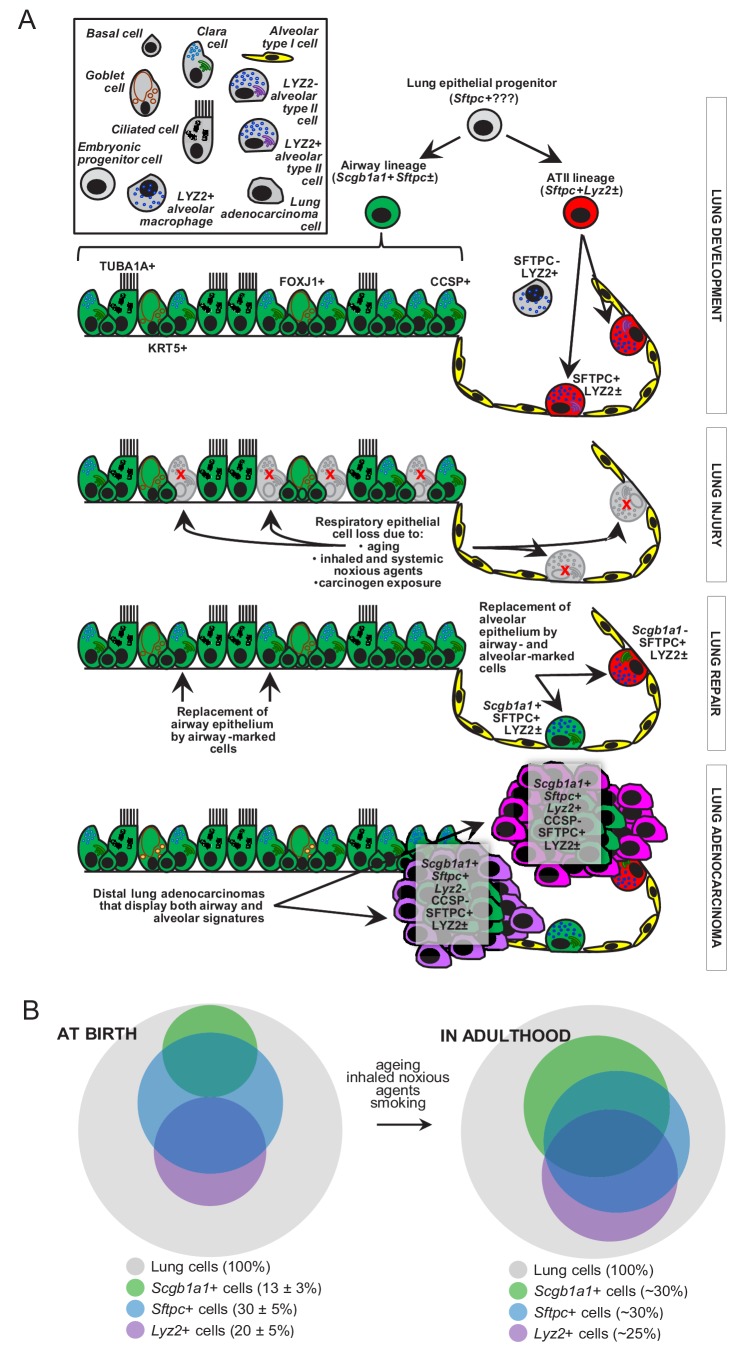
Lung cancer and chronic lung diseases impose major disease burdens worldwide and are caused by inhaled noxious agents including tobacco smoke. The cellular origins of environmental-induced lung tumors and of the dysfunctional airway and alveolar epithelial turnover observed with chronic lung diseases are unknown. To address this, we combined mouse models of genetic labeling and ablation of airway (club) and alveolar cells with exposure to environmental noxious and carcinogenic agents. Club cells are shown to survive KRAS mutations and to form lung tumors after tobacco carcinogen exposure. Increasing numbers of club cells are found in the alveoli with aging and after lung injury, but go undetected since they express alveolar proteins. Ablation of club cells prevents chemical lung tumors and causes alveolar destruction in adult mice. Hence club cells are important in alveolar maintenance and carcinogenesis and may be a therapeutic target against premalignancy and chronic lung disease.

Keywords: airway transcriptome; cancer biology; cell biology; chemical carcinogenesis; human; lung adenocarcinoma; mouse; urethane.


Conflict of interest statement

MS, IL, MP, YC, MA, AL, DZ, FR, MV, NK, DW, AG, VA, KA, LK, DT, VK, SZ, IG, AM, VA, RS, GS No competing interests declared

Figures

Figure 1.
Figure 1.. Airway cells in urethane-induced lung tumors.
(A) Cartoon of the different lung epithelial lineages, their distribution in the airways (club, goblet, ciliated, and basal cells) and the alveoli (alveolar type I and II cells), their permanent fluorescent genetic labeling in the reporter mice used in this study (green color), and the protein markers used for their identification. See also Figure 1—figure supplements 1–5. (B) Lung sections from naïve 6-week-old GFP;CCSP.CRE mice (n = 22), in which all airway cells bear permanent genetic GFP+ (green arrows) and all other cells TOMATO+ (red arrows) labels, counterstained with nuclear Hoechst33258 dye (top) or immunostained for the club cell marker CCSP and the alveolar type II cell marker SFTPC (bottom). a, alveoli; b, bronchi; v, vein. See also Figure 1—figure supplements 6–8. (C) Proliferating cell nuclear antigen (PCNA; brown) and hematoxylin (blue)-stained (top) and CCSP (green) and Hoechst33258 (blue)-stained (bottom) lung tumor sections of urethane-treated C57BL/6 mice six months post-treatment (n = 5/group), depicting endobronchial lung adenocarcinomas (white arrows). See also Figure 1—figure supplements 9–11. (D) Lung sections of GFP;CCSP.CRE mice (n = 10) at six months post-urethane treatment bearing hyperplasias and tumors (dashed outlines, top), and immunostained for the club cell marker CCSP (bottom left) and the alveolar type II cell marker SFTPC (bottom right). Note the GFP-labeled lesions of airway origin that have lost CCSP and have acquired SFTPC immunoreactivity. See also Figure 1—figure supplements 12–19. CCSP, Clara cell secretory protein; TUBA1A, acetylated α-tubulin; SFTPC, surfactant protein C; LYZ2, lysozyme 2; FOXJ1, forkhead box J1; KRT5, keratin 5.
Figure 1—figure supplement 1.
Figure 1—figure supplement 1.. Table of pulmonary lineage markers and key abbreviations used in this study.
TUBA1A, Tubulin alpha 1a or acetylated tubulin; KRT5, Keratin 5; FOXJ1, Forkhead box J1; CCSP, Secretoglobin, family 1A, member 1 (uteroglobin) or Clara cell secretory protein or Clara cell 10 KDa protein; SFTPC, Surfactant protein C; LYZ2, Lysozyme 2; AEC, airway epithelial cells; BASC, bronchoalveolar stem cells; ATII, alveolar type II cells or type II pneumocytes; AMΦ, alveolar macrophages.
Figure 1—figure supplement 2.
Figure 1—figure supplement 2.. Genetic labeling of pulmonary lineages in eleven mouse strains and intercrosses: summary of results.
CRE, causes recombination; TOMATO, tdTomato; GFP, green fluorescent protein; CCSP, Clara cell secretory protein; SFTPC, surfactant protein C; LYZ2, lysozyme 2; SOX2, sex determining region Y (SRY)-box 2; VAV, Vav Guanine Nucleotide Exchange Factor 1; NES, nestin; JAX, Jackson Laboratories; EMMA, European Mutant Mouse Archive; MGI, Mouse Genome Informatics; AEC, airway epithelial cells; BASC, bronchoalveolar stem cells; ATII, alveolar type II cells or type II pneumocytes; AMΦ, alveolar macrophages; ΒM, bone marrow (myeloid) cells. Symbols indicate: - (white), no genetic labeling; + (magenta), complete genetic labeling; ± (blue), partial genetic labeling.
Figure 1—figure supplement 3.
Figure 1—figure supplement 3.. Genetic labeling of pulmonary lineages in seven lineage reporter strains on the C57BL/6 background: representative images.
Representative photographs (top row) and green epifluorescence images (second row) of whole lungs, as well as fluorescent microscopic images of lung sections for nuclear Hoechst33258 stain (third row), endogenous TOMATO (fourth row), endogenous GFP (fifth row), and merged images (bottom row) of genetically marked mice on the C57BL/6 background employed in these studies (described in detail in Figure 1—figure supplement 2) at six postnatal weeks (n = 5/mouse strain). b, bronchi; a, alveoli; ps, pleural space.
Figure 1—figure supplement 4.
Figure 1—figure supplement 4.. Genetic labeling of pulmonary lineages in seven lineage reporter strains on the C57BL/6 background: data summary.
XY plot of GFP-labeled airway versus alveolar cells from n = 5 mice/mouse strain. Arrows denote the three lineage-reporter strains selected for further study including GFP;CCSP.CRE (green), GFP;LYZ2.CRE (blue), and GFP;SFTPC.CRE (olive) mice. Data are given as mean ± SD.
Figure 1—figure supplement 5.
Figure 1—figure supplement 5.. Flow cytometric quantification of lineage-labeled cells in three lineage reporter strains on the C57BL/6 background.
Schematic representation of genetic lineage labeling of GFP;CCSP.CRE, GFP;SFTPC.CRE, and GFP;LYZ2.CRE mice (left), flow cytometric gating strategy to quantify GFP+ and TOMATO+ cells (middle), and violin plot from n = 5, 3, and six mice/strain (right). Numbers are mean ± SD. P, overall probability, two-way ANOVA.
Figure 1—figure supplement 6.
Figure 1—figure supplement 6.. Genetic lineage labels of protein-marked cells in three lineage reporter strains on the C57BL/6 background: representative images.
Representative merged fluorescent microscopic images from lineage marker-stained lung sections of 6-week-old lineage-labeled mice (n = 5/group). Arrows indicate cells expressing the respective marker protein with (green) or without (red) genetic lineage-labeling. CCSP, Clara cell secretory protein; TUBA1A, acetylated tubulin; SFTPC, surfactant protein C; LYZ2, lysozyme 2; b, bronchi; a, alveoli.
Figure 1—figure supplement 7.
Figure 1—figure supplement 7.. Genetic lineage labels of protein-marked cells in seven lineage reporter strains on the C57BL/6 background: data summary.
XY plot of ratios of genetic GFP-labeled to protein marker CCSP and SFTPC-immunoreactive cells (n = 5/group). Arrows denote the three lineage-reporter strains selected for further study including GFP;CCSP.CRE (green), GFP;LYZ2.CRE (blue), and GFP;SFTPC.CRE (olive) mice. Data are given as mean ± SD.
Figure 1—figure supplement 8.
Figure 1—figure supplement 8.. Protein markings of lineage-labeled cells in three lineage reporter strains on the C57BL/6 background: data summary.
Quantification of protein marker expression of genetic-labeled cells of GFP;CCSP.CRE, GFP;LYZ2.CRE, and GFP;SFTPC.CRE mice (n = 6/strain) for Clara cell secretory protein (CCSP), surfactant protein C (SFTPC), and lysozyme 2 (LYZ2). Data are given as violin plots. P, overall probability, two-way ANOVA.
Figure 1—figure supplement 9.
Figure 1—figure supplement 9.. Two carcinogen regimens for reproducible lung tumor induction in naturally resistant C57BL/6 mice.
Top: schematic of multi-hit urethane administration tailored to yield 90% tumor incidence in C57BL/6 mice: ten weekly intraperitoneal injections of 1 g/Kg urethane (ethyl carbamate, EC; gray arrows) are initiated at six weeks after birth (pink arrow) and lungs are examined six months after the first urethane injection (black arrow). Bottom: 3-methyl-1,2-dyhydrobenzo[j]aceanthrylene (MCA)/butylated hydroxytoluene (BHT) regimen tailored to yield 90% tumor incidence in C57BL/6 mice. Four weekly intraperitoneal injections of 15 mg/Kg MCA (red arrows) initiated at six weeks after birth (pink arrow) are followed by eight weekly intraperitoneal injections of 200 mg/Kg BHT (blue arrows) and lung examination at six months after first MCA dose (black arrow).
Figure 1—figure supplement 10.
Figure 1—figure supplement 10.. Lung tumors induced in C57BL/6 mice by two carcinogen regimens.
Eighty-four C57BL/6 mice received ten weekly intraperitoneal injections of 1 g/Kg urethane (ethyl carbamate, EC) initiated at six weeks of age and lungs were examined six months after the first urethane injection (black font and symbols). Twenty C57BL/6 mice received four weekly intraperitoneal injections of 15 mg/Kg 3-methyl-1,2-dyhydrobenzo[j]aceanthrylene (MCA) followed by eight weekly intraperitoneal injections of 200 mg/Kg butylated hydroxytoluene (BHT) and lungs were examined six months after the first MCA dose (gray font and symbols). Table shows tumor incidence and graph shows tumor number versus mean tumor diameter. Each small circle represents one mouse and each large circle with error bar the means for each carcinogen regimen.
Figure 1—figure supplement 11.
Figure 1—figure supplement 11.. Airway links of urethane-induced lung adenocarcinomas.
Proliferating cell nuclear antigen (PCNA)-stained lung sections of urethane-treated C57BL/6 mice at six months post-treatment start. Arrows: airway hyperplasias (gray) and lung adenocarcinomas (black) arising within a bronchus (left) and apparently in an alveolar region but adjacent to a bronchus (right).
Figure 1—figure supplement 12.
Figure 1—figure supplement 12.. Genetic labeling of urethane-induced lung adenocarcinomas in four lineage reporter strains on the C57BL/6 background: representative images.
Representative photographs (top row) and green epifluorescence images (second row), as well as merged fluorescent microscopic images of lung sections for nuclear Hoechst33258 stain, endogenous TOMATO, and endogenous GFP (bottom three rows), of tumor-bearing lungs from genetically marked mice employed in these studies (described in detail in Figure 1—figure supplement 2) at six months after initiation of ten weekly intraperitoneal urethane injections (n = 30, 22, 18, and 20/strain, respectively). b, bronchi. Top two rows: arrows indicate lung tumors. Bottom three rows: white arrows indicate GFP-labeled cells in apparently non-affected alveolar areas of GFP;CCSP.CRE mice; green arrow indicates rare GFP+ cell in non-affected central airway of GFP;LYZ2.CRE mouse. Note the absence of GFP-labeling of lung tumors in TOMATO mice, the complete GFP-labeling in GFP;CCSP.CRE and GFP;SFTPC.CRE mice, and the partial GFP-labeling in GFP;LYZ2.CRE mice.
Figure 1—figure supplement 13.
Figure 1—figure supplement 13.. Genetic labeling of urethane-induced lung adenocarcinomas in four lineage reporter strains on the C57BL/6 background: data summary.
XY plot of percentage of GFP-labeled tumors/lung versus GFP-labeled tumor cells/tumor averaged per lung in strains from Figure 1—figure supplement 12 (n = 30, 22, 18, and 20/group, respectively). Data are given as mean ± SD.
Figure 1—figure supplement 14.
Figure 1—figure supplement 14.. Genetic labeling of MCA/BHT-induced lung adenocarcinomas in two lineage reporter strains on the C57BL/6 background: representative images.
Single-channel (endogenous TOMATO and GFP labeling and Hoechst 33258 nuclear stain) and merged images of lung hyperplasias and tumors (dashed outlines) of TOMATO and GFP;CCSP.CRE mice at six months after initiation of treatment with four weekly intraperitoneal injections of 15 mg/Kg 3-methyl-1,2-dyhydrobenzo[j]aceanthrylene (MCA) followed by eight weekly intraperitoneal injections of 200 mg/Kg butylated hydroxytoluene (BHT) (n = 8/group). Note the absence of GFP-labeling in lesions of TOMATO mice and the GFP-labeled lesions of GFP;CCSP.CRE mice.
Figure 1—figure supplement 15.
Figure 1—figure supplement 15.. Protein marker expression of urethane-induced lung adenocarcinomas in three lineage-labeled mouse strains on the C57BL/6 background: representative images.
Lineage marker protein-stained lung adenocarcinomas (dashed outlines) from genetically marked mice (n = 10/group). Note the genetic GFP-labeled tumor cells of GFP;CCSP.CRE mice that have lost CCSP and have acquired SFTPC with or without LYZ2 protein marker expression. CCSP, Clara cell secretory protein; TUBA1A, acetylated α-tubulin; SFTPC, surfactant protein C; LYZ2, lysozyme 2.
Figure 1—figure supplement 16.
Figure 1—figure supplement 16.. Genetic lineage labels of protein-marked cells in three lineage reporter strains on the FVB background: representative images.
Representative merged fluorescent microscopic images from lineage marker-stained lung sections of 6-week-old lineage reporter mice (n = 5/group). Arrows indicate cells expressing the respective marker protein with (green) or without (red) genetic lineage-labeling. CCSP, Clara cell secretory protein; SFTPC, surfactant protein C; LYZ2, lysozyme 2; b, bronchi; a, alveoli.
Figure 1—figure supplement 17.
Figure 1—figure supplement 17.. A single-hit mouse model for urethane-induced lung adenocarcinoma induction in naturally susceptible FVB mice.
Schematic of single-hit urethane administration tailored to yield 100% tumor incidence in FVB mice: one intraperitoneal injection of 1 g/Kg urethane (ethyl carbamate, EC; gray arrow) is delivered at six weeks after birth (pink arrow) and lungs are examined six months later (black arrow).
Figure 1—figure supplement 18.
Figure 1—figure supplement 18.. High-throughput epifluorescent detection of genetic labeling of urethane-induced lung adenocarcinomas in four lineage reporter strains on the FVB background: representative images.
Representative photographs (top) and green (middle) and red (bottom) epifluorescence images of tumor-bearing lungs from genetically lineage-marked FVB mice at six months after a single intraperitoneal urethane injection (n ≥ 8/strain). Arrows indicate all (white), GFP-labeled (green), and TOMATO-labeled (red) lung tumors.
Figure 1—figure supplement 19.
Figure 1—figure supplement 19.. Genetic labeling of urethane-induced lung adenocarcinomas in three lineage reporter strains on the FVB background: representative images.
Representative merged fluorescent microscopic images of lineage marker protein-stained lung tumors (dashed outlines) from genetically marked mice (FVB background) at six months after a single intraperitoneal urethane injection (n ≥ 10/strain). Note the genetic GFP-labeled tumor cells of GFP;CCSP.CRE mice that have lost CCSP and have acquired SFTPC with or without LYZ2 protein marker expression. CCSP, Clara cell secretory protein; SFTPC, surfactant protein C; LYZ2, lysozyme 2.
Figure 2.
Figure 2.. Airway cells sustain KrasQ61R mutations inflicted by urethane and give rise to juxtabronchial lung adenocarcinomas.
(A) DNA was extracted from the lungs of GFP;CCSP.CRE and GFP;LYZ2.CRE mice (FVB strain) one and two weeks post-urethane treatment (n = 5/group). Summary of duplexed digital droplet PCR (ddPCR) results using primers and probes specific for the RosamT and the KrasWT sequences. Note that all cell types equally suffer initial KrasQ61R mutations, but only GFP-labeled cells of GFP;CCSP.CRE mice (i.e. airway cells) maintain the KrasQ61R mutation after two weeks. See also Figure 2—figure supplement 1. Data are shown as violin plot. P, overall probability, two-way ANOVA. ***: p<0.001 compared with all other groups, Bonferroni post-tests. (B) Representative high-resolution micro-computed tomography (μCT) lung sections (top) and three-dimensional reconstructions (bottom) from urethane-treated FVB mice six months after treatment (n = 10). Note lung tumors attached to (green arrows) or contained within (blue arrows) the airways, as well as lung tumors with no obvious link to a bronchus (red arrows). (C) Summary of results from μCT (data from Figure 2B) and pathology (data from Figure 1C) shown as violin plot. P, probability, two-way ANOVA.*, ***, and ****: p<0.05, p<0.001, and p<0.0001, respectively, compared with airway-attached tumors, Bonferroni post-tests. Shown are also Spearman’s correlation coefficient (ρ) and probability (P) for correlation of μCT and pathology results.
Figure 2—figure supplement 1.
Figure 2—figure supplement 1.. Airway cells sustain KrasQ61R mutations inflicted by urethane.
DNA was extracted from the lungs of GFP;CCSP.CRE and GFP;LYZ2.CRE mice (FVB strain) one and two weeks post-urethane treatment (n = 5/group). Representative gating strategy of digital droplet PCR (ddPCR) using primers and probes specific for the RosamT and the KrasWT sequences. Dashed outlines indicated GFP+KrasQ61R+ droplet gates.
Figure 3.
Figure 3.. Expansion of airway cells in the tumor-initiated lung.
(A) Non-neoplastic alveolar regions from lung sections of saline-, urethane (ethyl carbamate, EC)-, and 3-methyl-1,2-dyhydrobenzo[j]aceanthrylene/butylated hydroxytoluene (MCA/BHT)-treated GFP;CCSP.CRE mice at six months into treatment (n = 8 mice/group). Note the few GFP-labeled cells of saline-treated mice and their increased numbers in carcinogen-treated mice (arrows). See also Figure 3—figure supplements 1 and 2. (B) Juxtabronchial region from lung section of urethane-treated GFP;CCSP.CRE mouse at six months into treatment (n = 22) stained for the alveolar type II cell marker SFTPC. Arrows and legend indicate different phenotypes of extrabronchial GFP-labeled cells. See also Figure 3—figure supplements 3–5. (C) Merged high-power image of SFTPC and KRT5 co-staining of human lung adenocarcinoma (n = 10) shows significant co-localization of the two markers in a subset of tumor cells (arrows). See also Figure 3—figure supplement 6. CCSP, Clara cell secretory protein; SFTPC, surfactant protein C; KRT5, keratin 5.
Figure 3—figure supplement 1.
Figure 3—figure supplement 1.. Airway-labeled cells in the alveoli of carcinogen-exposed C57BL/6 mice: representative images.
Single-channel microscopy images (endogenous TOMATO and GFP labeling with Hoechst 33258 nuclear stain) of non-neoplastic alveolar regions of GFP;CCSP.CRE mice treated as in Figure 3A.
Figure 3—figure supplement 2.
Figure 3—figure supplement 2.. Airway-labeled cells in the alveoli of carcinogen-exposed C57BL/6 mice: data summary.
Data summary (shown as violin plot) from GFP;CCSP.CRE mice treated as in Figure 3A (n = 10/group). P, overall probability, one-way ANOVA. ns and **: p>0.05 and p<0.01 for the indicated comparisons, Bonferroni post-tests.
Figure 3—figure supplement 3.
Figure 3—figure supplement 3.. Airway-labeled cells in the alveoli of carcinogen-exposed mice express SFTPC.
Single-channel images of non-neoplastic distal lung regions of urethane-treated GFP;CCSP.CRE mice at six months into treatment (n = 22), stained for the lung cell markers Clara cell secretory protein (CCSP), acetylated α-tubulin (TUBA1A), and surfactant protein C (SFTPC). Note the genetic GFP-labeled tumor cells that have lost CCSP and have acquired SFTPC protein marker expression.
Figure 3—figure supplement 4.
Figure 3—figure supplement 4.. Airway-labeled cells in environmental-induced lung tumors express SFTPC.
Juxtabronchial regions, alveolar hyperplasias, and tumors (dashed lines) of lungs from urethane-treated GFP;CCSP.CRE mice at six months into treatment (n = 22) stained for lineage marker proteins Clara cell secretory protein (CCSP), acetylated α-tubulin (TUBA1A), and surfactant protein C (SFTPC). Arrows and legend indicate different phenotypes of extrabronchial GFP-labeled cells. a, alveoli; b, bronchi.
Figure 3—figure supplement 5.
Figure 3—figure supplement 5.. In vivo bioluminescent detection of the airway lineage in the lungs of saline- and carcinogen-treated mice.
Representative merged bioluminescence/photographic images (left) and data summary (right) of LUC;CCSP.CRE mice (FVB background) before and seven months after saline (one intraperitoneal injection of 100 µL; n = 6) or urethane (one intraperitoneal injection of 1 g/Kg in 100 µL saline; n = 5) treatment. Note that in this model light is emitted exclusively by genetically CCSP-labeled cells over the lungs. Note also the signal decrease in saline- and increase in urethane-treated mice. Data are given as mean ± SD. P, overall probability, two-way ANOVA. ***: p<0.001 for comparison with saline, Bonferroni post-test.
Figure 3—figure supplement 6.
Figure 3—figure supplement 6.. Human lung adenocarcinomas co-express airway and alveolar markers.
Co-staining of human lung adenocarcinomas for SFTPC and either CCSP (A; n = 10) or KRT5 (B; n = 10) shows absence of CCSP expression and significant co-localization of SFTPC and KRT5 in a subset of tumor cells. CCSP, Clara cell secretory protein; KRT5, keratin 5; SFTPC, surfactant protein C.
Figure 4.
Figure 4.. Airway cells in alveolar repair.
(A) Non-neoplastic alveolar regions from lung sections of aging GFP;CCSP.CRE mice (bottom right section is also SFTPC-immunostained) show increasing numbers of alveolar GFP-labeled cells with age (arrows). Green arrows: genetically GFP-labeled, SFTPC-immunoreactive airway cells in alveolus of 15-month-old GFP;CCSP.CRE mouse. (B) Data summary (n = 5 mice/time-point) from (A) shown as violin plot. Color-coded boxes indicate time windows of experiments in (C-H). P, probability, one-way ANOVA. ns, ***, and ****: p>0.05, p<0.001, and p<0.0001, respectively, for comparison with time-point zero by Bonferroni post-tests. (C) SFTPC-immunostained lung sections of GFP;CCSP.CRE mice show accelerated increase of alveolar GFP-labeled SFTPC-immunoreactive airway cells after bleomycin treatment (arrows). See also Figure 4—figure supplement 1 and Figure 4—figure supplement 2. (D) Data summary from (C) shown as violin plots (n = 4 mice/time-point). P, probabilities, one-way ANOVA. ns, *, **, ***, and ****: p>0.05, p<0.05, p<0.01, p<0.001, and p<0.0001, respectively, for comparison with day zero by Bonferroni post-tests. (E) SFTPC-stained lung sections of GFP;CCSP.CRE mice at two months after perinatal exposure to 98% O2 show enlarged alveoli (evident by increased mean linear intercept) enriched in GFP-labeled SFTPC-immunoreactive airway cells (arrows) compared with 21% O2. (F) Data summary from (E) shown as violin plots (n = 6 mice/group). P, probabilities, t-test. (G) Lung sections (top) of GFP;CCSP.CRE mice (n = 5 mice/group) show enrichment of alveoli in GFP-labeled cells post-naphthalene treatment (arrows). Lung sections (bottom) of GFP;LYZ2.CRE mice (n = 5 mice/group) at six weeks post-naphthalene show no bronchial (b) GFP-labeled cells. See also Figure 4—figure supplements 3 and 4. (H) Data summary from (G) shown as violin plot (n = 5 mice/time-point). P, probability, two-way ANOVA. ns and ****: p>0.05 and p<0.0001, respectively, for comparison with corn oil by Bonferroni post-tests. CCSP, Clara cell secretory protein; SFTPC, surfactant protein C; LYZ2, lysozyme 2.
Figure 4—figure supplement 1.
Figure 4—figure supplement 1.. Alveolar type II cell ablation using bleomycin pre-treatment increases airway-labeled cells in urethane-induced lung tumors: representative images.
Representative epifluorescence (top) and merged fluorescent microscopy (bottom) images of tumor-bearing lungs and lung tumors of six-week-old GFP;CCSP.CRE mice that received intratracheal saline or 0.08 units bleomycin (n = 6/group), were allowed to recover for one month, and subsequently received ten weekly intraperitoneal injections of 1 g/Kg urethane to be sacrificed six months after the first urethane injection. Arrows and dashed outlines indicate lung tumors.
Figure 4—figure supplement 2.
Figure 4—figure supplement 2.. Alveolar type II cell ablation using bleomycin pre-treatment increases airway-labeled cells in urethane-induced lung tumors: data summary.
Violin plot of GFP-labeled tumors/mouse (n = 6 mice/group) and GFP-labeled cells/tumor (n = 12 tumors/group; n = 2 tumors/mouse were examined) from experiment described in Figure 4—figure supplement 1. Note the enrichment of lung adenocarcinomas in GFP-labeled cells in response to bleomycin, which depletes resident alveolar type II cells. P, overall probability, two-way ANOVA. **: p<0.01 for comparison with saline, Bonferroni post-test.
Figure 4—figure supplement 3.
Figure 4—figure supplement 3.. Airway epithelial cell ablation using naphthalene is restored by airway-labeled cells: representative images.
Representative fluorescent microscopic images of lungs of GFP;CCSP.CRE mice at different time-points after intraperitoneal injection of 250 mg/Kg naphthalene given at six weeks of age. Shown are merges of Hoechst 33258-stain, endogenous TOMATO- and GFP-labeling, and immunostains for surfactant protein C (SFTPC, left) or Clara cell secretory protein (CCSP, right). Arrows denote naphthalene-induced airway epithelial gaps that are restored by GFP-labeled airway cells that express CCSP, but not SFTPC protein.
Figure 4—figure supplement 4.
Figure 4—figure supplement 4.. Airway epithelial cell ablation by naphthalene: data summary.
Violin plot of percentage of GFP-labeled airway cells from experiment described in Figure 4—figure supplement 3 (n = 6 mice/time-point). P, overall probability, one-way ANOVA. ***: p<0.001 for the comparison with day zero, Bonferroni post-test.
Figure 5.
Figure 5.. Airway cell-ablated mice display alveolar destruction and are protected from carcinogenesis.
(A) Lineage marker-immunostained lung sections of 12-week-old GFP;CCSP.CRE;DTA and GFP;LYZ2.CRE;DTA mice (n = 6/group) show increased bronchial and alveolar size and flat CCSP+ SFTPC+ LYZ2+ cells in the airways of GFP;CCSP.CRE;DTA mice (green arrows), and CCSP-SFTPC-LYZ2+ alveolar macrophages in the airspaces of GFP;LYZ2.CRE;DTA mice (blue arrows). See also Figure 5—figure supplements 1 and 2. (B) Hematoxylin and eosin-stained lung sections (n = 6/group) from 12-week-old DTA (controls), CCSP.CRE;DTA (airway epithelial suicide model), and LYZ2.CRE;DTA (alveolar epithelial suicide model) mice. (C) Data summaries of mean linear intercept, bronchoalveolar lavage (BAL) myeloid cells, pressure-volume curves, airway resistance, and static compliance (n = 6–10/group) from 12-week-old DTA, CCSP.CRE;DTA, and LYZ2.CRE;DTA mice shown as violin plots. P, probabilities, one-way ANOVA. ns, **, and ***: p>0.05, p<0.01, and p<0.001, respectively, for the indicated comparisons, Bonferroni post-tests. (D) Lung photographs of control, CCSP.CRE;DTA, and LYZ2.CRE;DTA mice at six months into treatment with urethane started at six weeks of age. (E) Incidence table and data summaries of lung tumors from (D) (violin plots; n is given in table). P, probabilities, χ2-test (table) and one-way ANOVA (graphs). ns, *, **, and ***: p>0.05, p<0.05, p<0.01, and p<0.001, respectively, for the indicated comparisons, Fischer’s exact tests (table) or Bonferroni post-tests (graphs). a, alveoli; b, bronchi; ps, pleural space; v, vessel. CCSP, Clara cell secretory protein; SFTPC, surfactant protein C; LYZ2, lysozyme 2.
Figure 5—figure supplement 1.
Figure 5—figure supplement 1.. Triple transgenic mouse models for validation of genetic pulmonary lineage ablation: representative images.
Representative lung sections of 12-week-old GFP;CCSP.CRE, GFP;LYZ2.CRE, GFP;CCSP.CRE;DTA, and GFP;LYZ2.CRE;DTA mice (n = 6/group). Shown are merges of Hoechst 33258-stained endogenous TOMATO- and GFP-labeling. Note increased bronchial (b) and alveolar (a) size, complete airway epithelial denudement, and prominent distortion of bronchial and alveolar structure of GFP;CCSP.CRE;DTA mice compared with other strains, mimicking chronic obstructive pulmonary disease. Note also the presence of some GFP-labeled alveolar macrophages in GFP;LYZ2.CRE;DTA mice (arrows). a, alveoli; b, bronchi.
Figure 5—figure supplement 2.
Figure 5—figure supplement 2.. Triple transgenic mouse models for validation of genetic pulmonary lineage ablation: data summary.
Violin plot of GFP-labeling of lung sections of 12-week-old mice from Figure 5—figure supplement 1 (n = 6/group). Note the complete ablation of airway cells in GFP;CCSP.CRE mice and the persistence of some GFP-labeled alveolar macrophages in GFP;LYZ2.CRE;DTA mice. Measurements were from at least five non-overlapping tumor, airway, or alveolar fields/lung. P, overall probability, two-way ANOVA. ns and ****: p>0.05 and p<0.0001, respectively, for the indicated comparisons by Bonferroni post-tests.
Figure 6.
Figure 6.. Airway and alveolar signatures in murine and human lung adenocarcinoma (LUAD).
(A, B) RNA of mouse urethane-induced LUAD cell lines, lungs obtained pre- and one week post-urethane treatment, airway epithelial cells (AEC), alveolar type II cells (ATII), and bone marrow-derived macrophages (BMDM) was examined by Affymetrix Mouse Gene ST2.0 microarrays (n = 4/group). (A) Heat map of genes significantly differentially expressed (overall ANOVA and FDR p<10−6) shows accurate hierarchical clustering. (B) Expression of the 30 top-represented transcripts of AEC, ATII, and BMDM in lungs and LUAD cells. See also Figure 6—figure supplements 1–4. (C, D) RNA of human LUAD (n = 40), never-smoker lung tissue (n = 30), primary AEC (n = 5), primary ATII (n = 4), and alveolar macrophages (AMΦ; n = 9) was analyzed by Affymetrix Human Gene ST1.0 microarrays. (C) Heat map of genes significantly differentially expressed (ΔGE > 5 fold) between LUAD and lung (ANOVA and FDR p<10−3) shows accurate hierarchical clustering. (D) Mean expression levels of the 30 top-represented transcripts of human AEC, ATII, and AMΦ in lungs and LUAD. (E, F) Gene set enrichment analyses, including normalized enrichment scores (NES), of mouse (E) and human (F) AEC, ATII, and BMDM/AMΦ signatures (defined as the top 1% expressed genes overall or exclusive to the cell type; n = 2) in mouse and human LUAD transcriptomes shows significant enrichment of the AEC (but not the ATII and BMDM/AMΦ) signature compared with lung (nominal p<0.0001 for all, family-wise error rates FWER <0.01). Gene symbols indicate the top three lagging genes from each signature and shows loss of Scgb1a1 (encoding CCSP) by LUAD. See also Figure 6—figure supplements 5 and 6. Data are given as violin plots. P, two-way ANOVA probabilities. ns, *, **, and ***: p>0.05, p<0.05, p<0.01, and p<0.001 for the indicated comparisons by Bonferroni post-tests. ANOVA, analysis of variance; FDR, false discovery rate.
Figure 6—figure supplement 1.
Figure 6—figure supplement 1.. Lineage-specific gene expression in mouse lung adenocarcinoma cell lines induced by urethane compared with mouse lungs.
RNA of mouse urethane-induced lung adenocarcinoma (LUAD) cell lines, lungs obtained pre- and one week post-urethane treatment, and airway epithelial cells (AEC), alveolar type II cells (ATII), and bone marrow-derived macrophages (BMDM) was examined by Affymetrix Mouse Gene ST2.0 microarrays (n = 4/group). Shown is the number of genes out of the 30 top-represented transcripts of AEC, ATII, and BMDM within the top-2000-expressed genes of lungs and LUAD cells.
Figure 6—figure supplement 2.
Figure 6—figure supplement 2.. Loss of lineage marker expression in mouse lung adenocarcinoma cell lines induced by urethane.
Mean expression levels of selected transcripts, including lineage markers and markers of histologic subtype in lung adenocarcinoma (LUAD) cell lines compared with lungs pre- and one week post-urethane treatment (A and B, microarrays from Figure 6—figure supplement 1, n = 2/group; C, qPCR, n = 3/group). AD, adenocarcinoma; SQ, squamous cell carcinoma; SC, small cell carcinoma. P, overall probability, two-way ANOVA. ****: p<0.0001 for the highlighted genes compared with lungs (red, significantly down-regulated; green, significantly up-regulated).
Figure 6—figure supplement 3.
Figure 6—figure supplement 3.. Loss of lineage marker expression in mouse lung adenocarcinoma cell lines induced by urethane compared with mouse lungs: heat maps.
528 genes differentially expressed between six different lung adenocarcinoma cell lines cultured from urethane-induced lung tumors and six benign respiratory mouse samples, including lungs of saline- and urethane-treated mice obtained at one week post-treatment, as well as primary mouse tracheal epithelial cells using the cut-offs indicated. Whole heat map (left) showing the accurate hierarchical clustering of the samples according to differentially expressed genes, as well as the top over- and under-represented genes (right). Note the universal loss of expression of lineage markers by lung adenocarcinoma cells (genes in red font). ANOVA, analysis of variance; FDR, false discovery rate.
Figure 6—figure supplement 4.
Figure 6—figure supplement 4.. Loss of lineage marker expression in mouse lung adenocarcinoma cell lines induced by urethane compared with mouse lungs: volcano plot.
Shown are selected top over- and under-represented genes (arrows) from microarrays from Figure 6—figure supplement 2.
Figure 6—figure supplement 5.
Figure 6—figure supplement 5.. Mouse gene set enrichment analyses.
Shown are gene set enrichment analyses of airway epithelial cell (AEC), alveolar type II cell (ATII), and bone marrow-derived macrophage (BMDM) transcriptome signatures in mouse lungs (top) and urethane-induced lung adenocarcinoma (LUAD) cell lines (bottom) transcriptomes. The data were used to design Figure 6E.
Figure 6—figure supplement 6.
Figure 6—figure supplement 6.. Human gene set enrichment analyses.
Affymetrix Human Gene ST1.0 microarrays hybridized with RNA of human lung adenocarcinomas (LUAD; n = 40), never-smoker lung tissues (n = 30), primary airway epithelial cells (AEC; n = 5), primary alveolar type II cells (ATII; n = 4), and alveolar macrophages (AMΦ; n = 9) were cross-examined. Shown are gene set enrichment analyses of AEC, ATII, and AMΦ signatures in lung (top) and LUAD (bottom) transcriptomes. The data were used to design Figure 6F.
Figure 7.
Figure 7.. Proposed role of airway-marked cells in murine lung maintenance and adenocarcinoma.
(A) Our evidence supports the existence of distinct developmental ancestries for airway epithelial (AEC) and alveolar type II (ATII) cells, notwithstanding their common descent from an early (possibly Sftpc+) lung epithelial progenitor. The developmental airway lineage (Scgb1a1+ Sftpc±; green) gives rise to all types of airway cells, including club, ciliated, goblet, basal, and other cells, while the developmental ATII lineage (Sftpc+ Lyz2±; red) gives rise to ATII cells before birth. These lineages appear to be segregated in the growing unaffected lung of the mouse till the age of six weeks, which roughly corresponds to a human age of six years, where cellular proliferation in the human lungs ceases. Thereafter, and likely due to the continuous exposure of the lungs to inhaled noxious agents, gradual expansion of Scgb1a1+ Sftpc± marked cells ensues. Upon lung injury, this process is accelerated. Similarly, during carcinogenesis caused by chemical tobacco smoke carcinogens, Scgb1a1+ Sftpc± marked cells expand and are ubiquitously present in peripheral lung adenocarcinomas. (B) Proposed neonatal proportions and postnatal dynamics of pulmonary epithelial cells during adulthood. Estimated proportions of lineage-marked cells at birth, based on flow cytometry and co-localization of proteinaceous and genetic cell marking. Lung lineages appear to be segregated in the growing lung till the age of full lung development (six weeks in mice and 6–8 years in humans) or till lung injury ensues. Schematic of proposed postnatal redistribution of marked cells in the adult lung. Upon injury, during multi-stage field carcinogenesis, or even during unchallenged aging, Scgb1a1+ marked cells appear in the distal alveolar regions, thereby maintaining lung structure and function. Bubble size indicates relative marked cell abundance. CCSP, Clara cell secretory protein; FOXJ1, forkhead box J1; KRT5, keratin 5; LYZ2, lysozyme 2; SFTPC, surfactant protein C; TUB1A1, acetylated α-tubulin.

References

    1. Aberle DR, Adams AM, Berg CD, Black WC, Clapp JD, Fagerstrom RM, Gareen IF, Gatsonis C, Marcus PM, Sicks JD, National Lung Screening Trial Research Team Reduced lung-cancer mortality with low-dose computed tomographic screening. The New England Journal of Medicine. 2011;365:395–409. doi: 10.1056/NEJMoa1102873. - DOI - PMC - PubMed
    1. Alexandrov LB, Ju YS, Haase K, Van Loo P, Martincorena I, Nik-Zainal S, Totoki Y, Fujimoto A, Nakagawa H, Shibata T, Campbell PJ, Vineis P, Phillips DH, Stratton MR. Mutational signatures associated with tobacco smoking in human cancer. Science. 2016;354:618–622. doi: 10.1126/science.aag0299. - DOI - PMC - PubMed
    1. Barbie DA, Tamayo P, Boehm JS, Kim SY, Moody SE, Dunn IF, Schinzel AC, Sandy P, Meylan E, Scholl C, Fröhling S, Chan EM, Sos ML, Michel K, Mermel C, Silver SJ, Weir BA, Reiling JH, Sheng Q, Gupta PB, Wadlow RC, Le H, Hoersch S, Wittner BS, Ramaswamy S, Livingston DM, Sabatini DM, Meyerson M, Thomas RK, Lander ES, Mesirov JP, Root DE, Gilliland DG, Jacks T, Hahn WC. Systematic RNA interference reveals that oncogenic KRAS-driven cancers require TBK1. Nature. 2009;462:108–112. doi: 10.1038/nature08460. - DOI - PMC - PubMed
    1. Barnes PJ, Burney PG, Silverman EK, Celli BR, Vestbo J, Wedzicha JA, Wouters EF. Chronic obstructive pulmonary disease. Nature Reviews Disease Primers. 2015;1:15076. doi: 10.1038/nrdp.2015.76. - DOI - PubMed
    1. Campbell JD, Alexandrov A, Kim J, Wala J, Berger AH, Pedamallu CS, Shukla SA, Guo G, Brooks AN, Murray BA, Imielinski M, Hu X, Ling S, Akbani R, Rosenberg M, Cibulskis C, Ramachandran A, Collisson EA, Kwiatkowski DJ, Lawrence MS, Weinstein JN, Verhaak RG, Wu CJ, Hammerman PS, Cherniack AD, Getz G, Artyomov MN, Schreiber R, Govindan R, Meyerson M, Cancer Genome Atlas Research Network Distinct patterns of somatic genome alterations in lung adenocarcinomas and squamous cell carcinomas. Nature Genetics. 2016;48:607–616. doi: 10.1038/ng.3564. - DOI - PMC - PubMed

Publication types