. 2019 Aug 1;30(17):2171-2184.
doi: 10.1091/mbc.E18-11-0702. Epub 2019 May 29.

The DEAD-box RNA helicase Ded1 has a role in the translational response to TORC1 inhibition

Affiliations

The DEAD-box RNA helicase Ded1 has a role in the translational response to TORC1 inhibition

Peyman P Aryanpur et al. Mol Biol Cell. .

Abstract

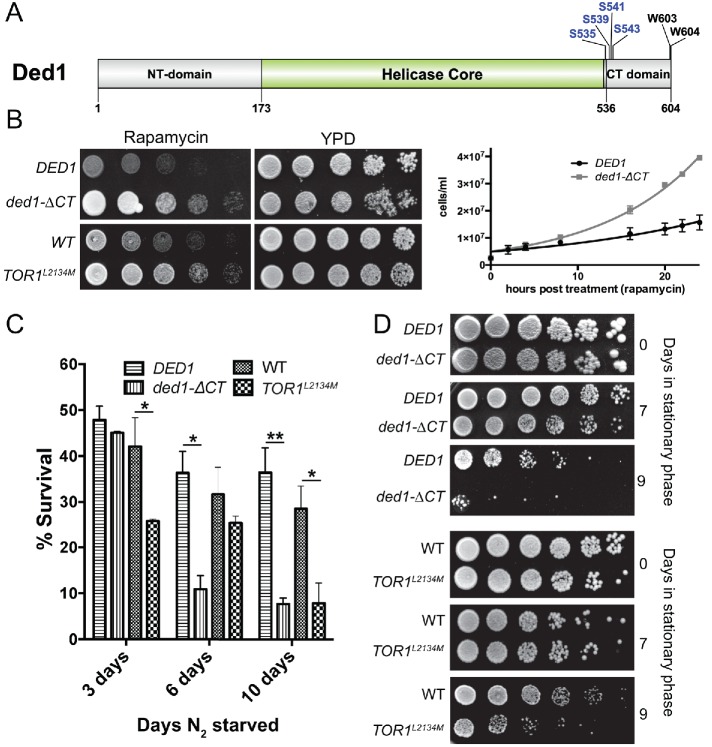
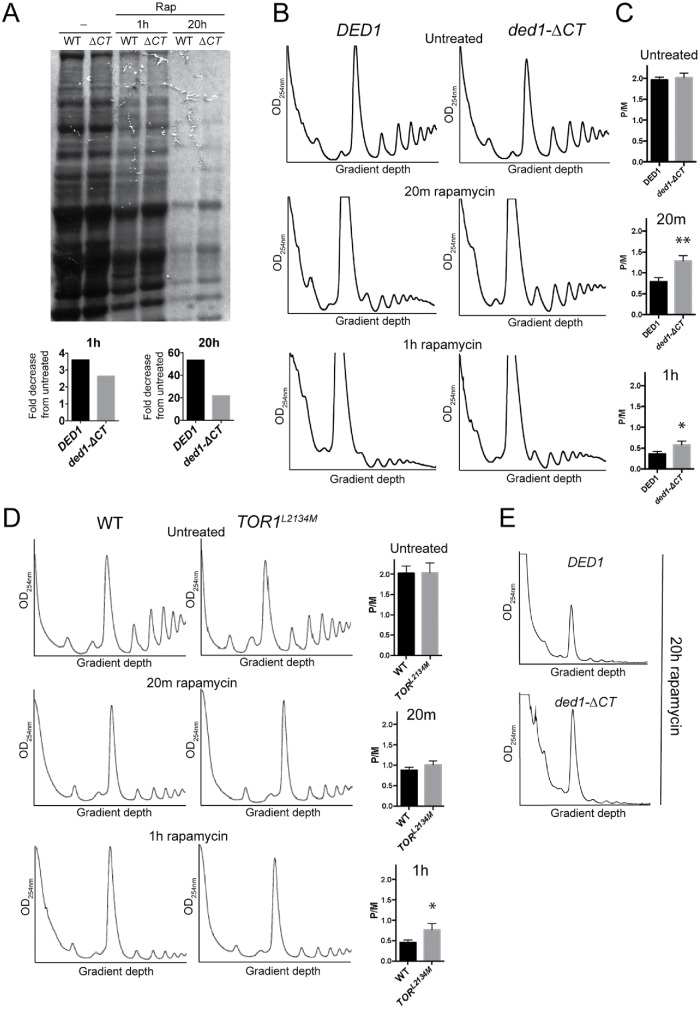
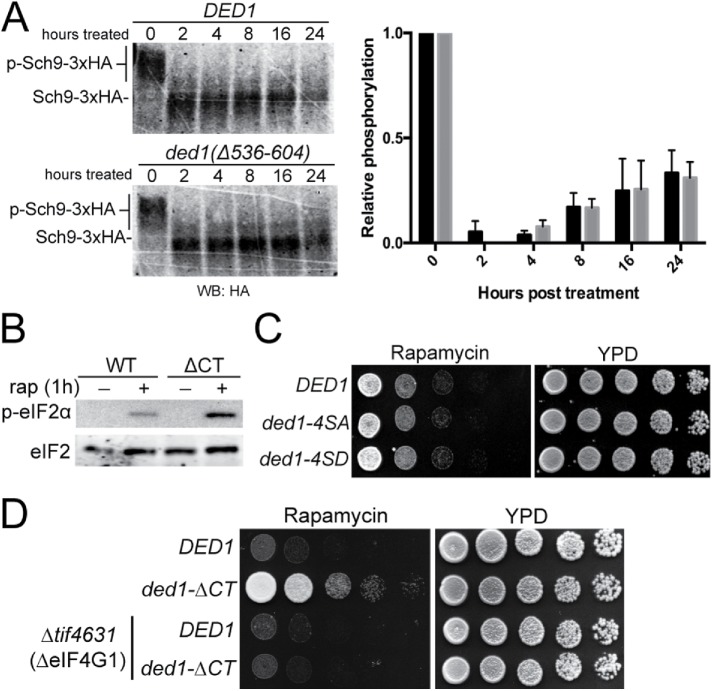
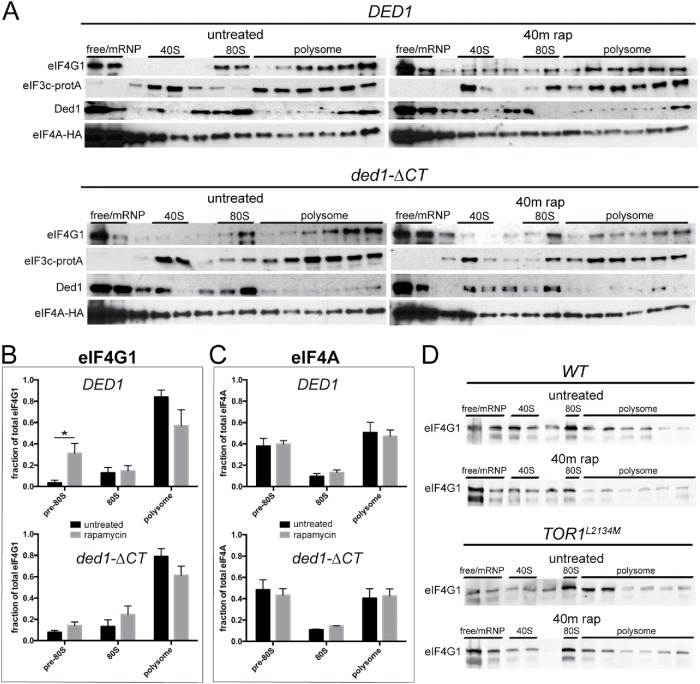
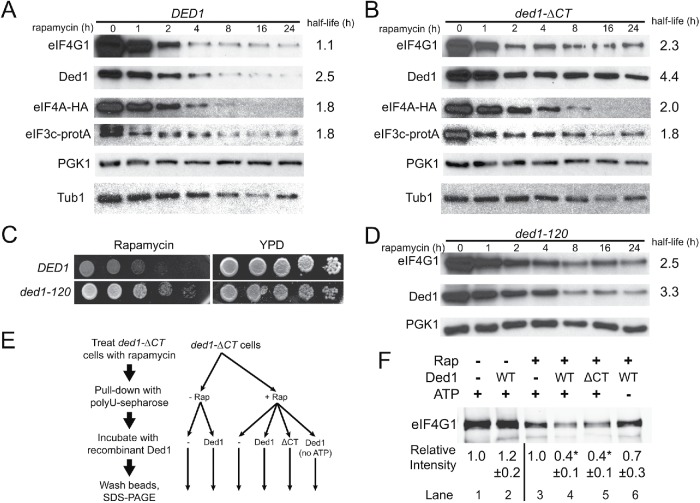
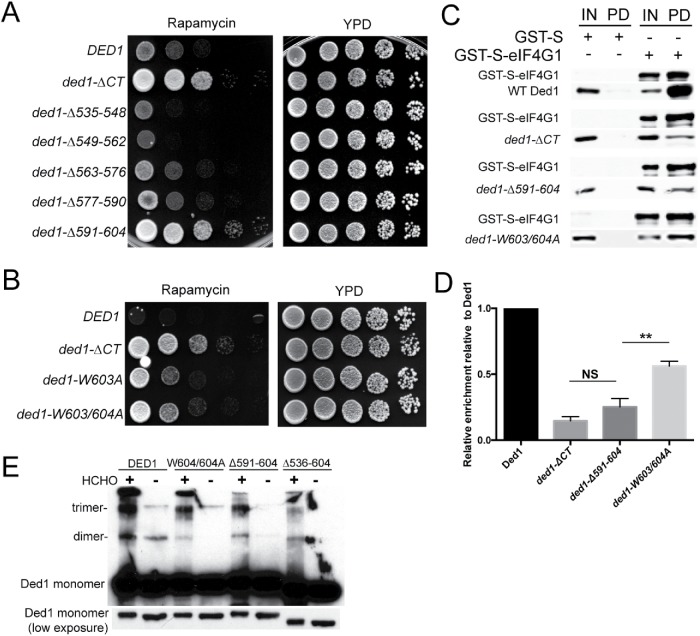
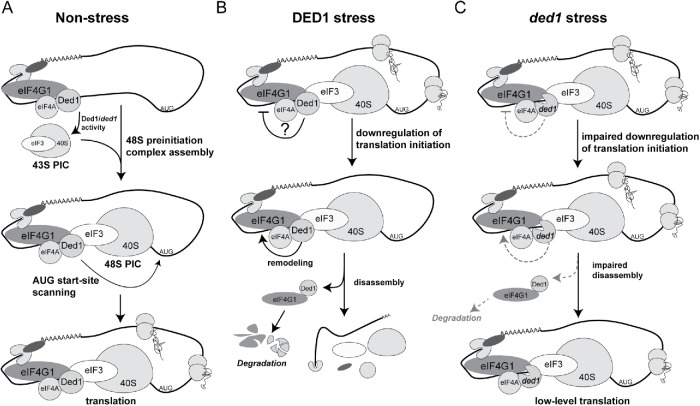
Ded1 is a DEAD-box RNA helicase with essential roles in translation initiation. It binds to the eukaryotic initiation factor 4F (eIF4F) complex and promotes 48S preinitiation complex assembly and start-site scanning of 5' untranslated regions of mRNAs. Most prior studies of Ded1 cellular function were conducted in steady-state conditions during nutrient-rich growth. In this work, however, we examine its role in the translational response during target of rapamycin (TOR)C1 inhibition and identify a novel function of Ded1 as a translation repressor. We show that C-terminal mutants of DED1 are defective in down-regulating translation following TORC1 inhibition using rapamycin. Furthermore, following TORC1 inhibition, eIF4G1 normally dissociates from translation complexes and is degraded, and this process is attenuated in mutant cells. Mapping of the functional requirements for Ded1 in this translational response indicates that Ded1 enzymatic activity and interaction with eIF4G1 are required, while homo-oligomerization may be dispensable. Our results are consistent with a model wherein Ded1 stalls translation and specifically removes eIF4G1 from translation preinitiation complexes, thus removing eIF4G1 from the translating mRNA pool and leading to the codegradation of both proteins. Shared features among DED1 orthologues suggest that this role is conserved and may be implicated in pathologies such as oncogenesis.


Figures

FIGURE 1:
FIGURE 1:
Ded1 has a role in growth regulation and viability following cellular stress. (A) Ded1 domain structure. The carboxy-terminal domain (CT domain) lies outside of the helicase core domain. It contains TORC1-dependent phosphoserines. Two conserved tryptophans at the C-terminal tail are also shown. (B) Wild-type DED1, ded1-ΔCT, WT, and TOR1L2134M cells were serially diluted onto rich media ± rapamycin (200 ng/ml) and incubated at 30°C (left). Wild-type DED1 or ded1-ΔCT cells were grown in rich liquid media ± rapamycin (200 ng/ml) at 30°C, and cell concentration was measured via OD600 at different time points in a 24-h window. Data points represent the mean of four independent experiments and were fit to simple logarithmic curves (right). (C) The strains described in B were starved of amino acids and ammonium sulfate for 3, 6, and 10 d and then plated on rich media to assay for survival. Survival percentages are normalized for the plating efficiency of each strain. The data show the mean and SEM of three to five independent experiments; 3 d, *p < 0.05 TOR1L2134M vs. WT; 6 d, *p < 0.05 ded1-ΔCT vs. wild-type DED1; 10 d, **p < 0.01 ded1-ΔCT vs. wild-type DED1; 10 d, *p < 0.05 TOR1L2134M vs. WT. (D) The strains described in B were grown to stationary phase in minimal media and were incubated at 30°C for either 7 or 9 d before being serially diluted and plated on rich media.
FIGURE 2:
FIGURE 2:
Ded1 has a role in repressing translation following rapamycin treatment. (A) DED1 and ded1-∆CT cells were grown in the presence of rapamycin for 0, 1, or 20 h. 35S-Methionine (200 µCi ) was added to the medium 1 h prior to harvest. SDS–PAGE and autoradiography of the samples were performed to show incorporation of 35S-Met into new proteins, and the total signal in each lane was quantified to calculate fold difference of ded1-∆CT compared with DED1 (numbers below lanes), or fold decrease from untreated (bar graphs). (B) Cultures of the indicated strains were grown in the presence of rapamycin for the indicated time, and polysome profiles were generated by subjecting cell lysates to 7–47% sucrose density centrifugation and OD254 analysis. A representative result is shown. (C) The monosome/polysome (P/M) ratio in B was determined by comparing the sum of the areas of the polysome peaks to the area of the monosome peak. Each P/M ratio shown is the mean and SEM from of three to four independent trials. **p < 0.01 vs. wild-type DED1, *p < 0.05 vs. wild-type DED1. (D) WT and TOR1L2134M strains were grown in the presence of rapamycin for the indicated time, and polysome profiles were generated as in B. A representative trace is shown with the P/M ratio (mean and SEM of three independent trials) shown to the right. *p < 0.05 vs. WT. (E) Representative traces of polysome profiles from the indicated strains after 20 h of rapamycin treatment.
FIGURE 3:
FIGURE 3:
Ded1 phosphorylation and/or misregulation of downstream TORC1 signaling are not the cause of ded1-∆CT rapamycin resistance. (A) Sch9::3xHA cells harboring DED1 or ded1-∆CT were subjected to a time course of rapamycin treatment, NTCB chemical cleavage of cell extracts, and blotted for with 12CA5 antibody (∝HA) to visualize the band-shift. A representative blot is shown along with a graph of the means from three independent trials. (B) DED1 or ded1-∆CT cells were treated for 1 h with 200 ng/ml rapamycin, and cell extracts were prepared and blotted with antibodies against eIF2α, p-eIF2α, and PGK1. (C) Cells containing DED1, ded1-4SA (S535/S539/541/543A: phospho-deficient), or ded1-4SD (S535/539/541/543D: phospho-mimetic) were serially diluted onto rich media ± rapamycin (200 ng/ml) and incubated at 30°C. (D) DED1 or ded1-∆CT, plasmids were shuffled into WT or tif4631∆ (eIF4G1-null) strains. Cells were serially diluted onto YPD ± rapamycin (200 ng/ml) and incubated at 30°C.
FIGURE 4:
FIGURE 4:
The Ded1 C-terminus has a role in remodeling eIF4G1 from translation complexes following rapamycin treatment. (A) DED1 and ded1-ΔCT cells were grown in the presence of rapamycin for 40 min, after which formaldehyde cross-linking was performed. Polysome profiles were generated as in Figure 2, and fractions were collected for Western blotting using antibodies against Tif4631 (eIF4G1), Ded1, HA (Tif1/eIF4A), and rabbit IgG for Protein-A (Nip1/eIF3c). Representative results for the distributions of each protein are shown. (B, C) Densitometry was performed on eIF4G1 (B) and eIF4A (C) from A. The figure depicts the distribution as a percentage of the total protein in each subfraction. The averages of five independent experiments are shown. *p < 0.05 vs. untreated fraction. (D) WT and TOR1L2134M cells were treated with rapamycin for 40 min, and cells were analyzed as in A using antibodies against Tif4631 (eIF4G1).
FIGURE 5:
FIGURE 5:
The Ded1 C-terminus and enzymatic activity are required for eIF4G1 remodeling and degradation. (A) DED1 cells were subjected to a time course of rapamycin treatment, and cell extracts were prepared and blotted for the indicated translation initiation factors (and PGK1 and Tub1 as a loading controls) as in Figure 3. Half-lives were determined via curve fitting, with 95% confidence intervals of 0.8–1.7 h (4G1), 2.3–2.7 (Ded1), 1.4–2.5 (4A), and 1.3–2.9 (3c). (B) Time course as in A for ded1-∆CT cells. Half-life 95% confidence intervals were 1.7–3.7 (4G1), 3.7–5.3 (Ded1), 1.6–2.7 (4A), and 1.1–5.7 (3c). The K values for eIF4G1 and Ded1 for B were significantly different from A by an extra sum-of-squares F test, while eIF4A and eIF3c were not. (C) DED1 and ded1-120 cells were serially diluted onto rich media ± rapamycin (200 ng/ml) and incubated at 30°C. (D) Time course as in A for ded1-120 cells, blotting for the indicated proteins. Half-life 95% confidence intervals were 1.9–3.8 (4G1) and 2.8–4.2 (Ded1), and the K values for eIF4G1 and Ded1 were significantly different from A by an extra sum-of-squares F test. E Diagram showing experimental workflow for F. Cells were incubated ± rapamycin for 40 min and then pull downs with polyuridine sepharose were performed to isolate RNA-binding proteins. Pull downs were then incubated with 2 μM recombinant Ded1 or ded1-∆CT protein ± 2 mM ATP. (F) Blot of eIF4G1 levels from pull downs described in E. Densitometry was performed and normalized to eIF4G1 levels without added Ded1 separately for rapamycin samples and untreated controls. Values represent the mean of four to five independent experiments for each condition. *p < 0.01 vs. no Ded1 control by Student’s t test.
FIGURE 6:
FIGURE 6:
Conserved critical residues in the Ded1 C-terminus are required for its function in stress, interaction with eIF4G1, and efficient oligomerization. (A) Cells containing DED1, ded1-∆CT, or one of a series of 14 amino acid C-terminal deletions were serially diluted onto rich media ± rapamycin (200 ng/ml) and incubated at 30°C. (B) DED1, ded1-∆CT, ded1-W604A, or ded1-W603/604A cells were serially diluted onto rich media ± rapamycin (200 ng/ml), and incubated at 30°C. (C) Bacterially expressed GST-S-eIF4G1 or GST-S was enriched using a glutathione sepharose resin, and affinity chromatography was performed with the addition of recombinant Ded1, ded1-∆CT, ded1-∆591-604, or ded1W603/604A. The bound proteins were analyzed via Western blotting using antibodies to Ded1 and eIF4G1. Input (IN), pull down (PD). (D) Quantitation of the results in C. The data show the mean and SEM of three independent experiments. **p < 0.01 vs. ded1-∆591-604. (E) Recombinant Ded1, ded1-∆CT, ded1-∆591-604, and ded1-W603/604A were cross-linked with formaldehyde or left untreated and visualized via Western blotting with anti-Ded1 antibody. Mobilities of the Ded1 monomer, dimer and trimer are indicated. Note that a lower exposure of Ded1 monomer is also shown to demonstrate equal protein loading.
FIGURE 7:
FIGURE 7:
Speculative model for Ded1 in the translational stress response. (A) In nonstress conditions, Ded1 stimulates translation by promoting assembly of the 48S PIC. (B) In stress, WT Ded1 may be directly involved in two steps of translation repression. First, Ded1 may stall the assembly of the 48S PIC. In a second step, Ded1 promotes the removal of eIF4G1 from stalled translation PICs, which leads to the codegradation of both factors. (C) In cellular stress ded1 mutants (ded1-120/ded1-ΔCT) are not effective in stalling 48S PIC assembly. The removal and degradation of eIF4G1 from PICs is also impaired, as this step requires Ded1 enzymatic activity and/or a functional interaction between the Ded1 C-terminus and eIF4G1. Thus, eIF4G1 is retained in translation complexes and helps sustain translational activity.

Similar articles

Cited by

References

    1. Albuquerque CP, Smolka MB, Payne SH, Bafna V, Eng J, Zhou H. (2008). A multidimensional chromatography technology for in-depth phosphoproteome analysis. Mol Cell Proteomics , 1389–1396. - PMC - PubMed
    1. Aryanpur PP, Regan CA, Collins JM, Mittelmeier TM, Renner DM, Vergara AM, Brown NP, Bolger TA. (2017). Gle1 regulates RNA binding of the DEAD-box helicase Ded1 in its complex role in translation initiation. Mol Cell Biol , e00139-17. - PMC - PubMed
    1. Beckham C, Hilliker A, Cziko A-M, Noueiry A, Ramaswami M, Parker R. (2008). The DEAD-box RNA helicase Ded1p affects and accumulates in Saccharomyces cerevisiae P-bodies. Mol Biol Cell , 984–993. - PMC - PubMed
    1. Berset C, Trachsel H, Altmann M. (1998). The TOR (target of rapamycin) signal transduction pathway regulates the stability of translation initiation factor eIF4G in the yeast Saccharomyces cerevisiae. Biochemistry , 4264–4269. - PMC - PubMed
    1. Bolger TA, Wente SR. (2011). Gle1 is a multifunctional DEAD-box protein regulator that modulates Ded1 in translation initiation. J Biol Chem , 39750–39759. - PMC - PubMed

Publication types

MeSH terms

Substances