Review
. 2019 Oct 1:199:598-608.
doi: 10.1016/j.neuroimage.2019.05.063. Epub 2019 May 26.

Optically pumped magnetometers: From quantum origins to multi-channel magnetoencephalography

Affiliations
Review

Optically pumped magnetometers: From quantum origins to multi-channel magnetoencephalography

Tim M Tierney et al. Neuroimage. .

Abstract

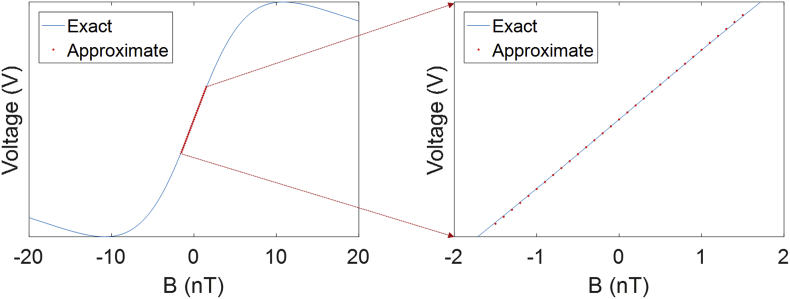
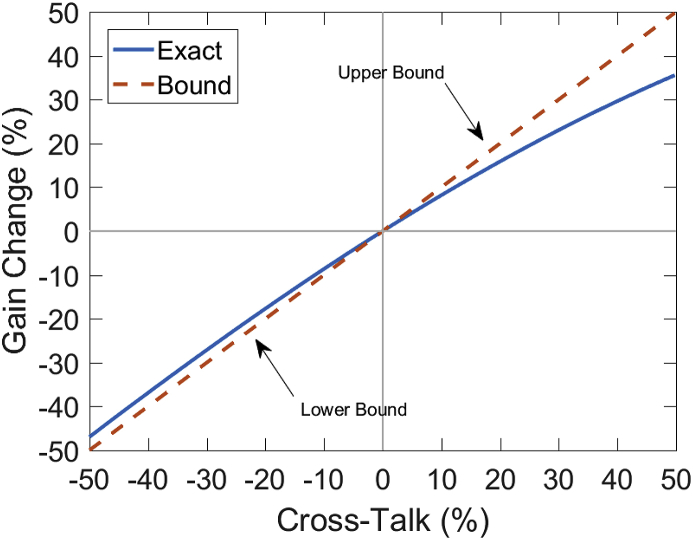
Optically Pumped Magnetometers (OPMs) have emerged as a viable and wearable alternative to cryogenic, superconducting MEG systems. This new generation of sensors has the advantage of not requiring cryogenic cooling and as a result can be flexibly placed on any part of the body. The purpose of this review is to provide a neuroscience audience with the theoretical background needed to understand the physical basis for the signal observed by OPMs. Those already familiar with the physics of MRI and NMR should note that OPMs share much of the same theory as the operation of OPMs rely on magnetic resonance. This review establishes the physical basis for the signal equation for OPMs. We re-derive the equations defining the bounds on OPM performance and highlight the important trade-offs between quantities such as bandwidth, sensor size and sensitivity. These equations lead to a direct upper bound on the gain change due to cross-talk for a multi-channel OPM system.


Figures

Fig. 1
Fig. 1
OPM and schematic. In (a) an internal schematic of a general OPM is described. A Laser light is shone through a glass cell containing a vapour under high pressure. The amount of light detected at the photodiode is a function of the ambient magnetic fields perpendicular to the axis of the laser beam (Bz and By). In (b) a Gen-2 Quspin OPM can be seen with the directions of the measured magnetic fields, laser and position of vapour cell. In (c) an OPM array of 17 sensors inserted into a wearable scanner-cast is displayed.
Fig. 2
Fig. 2
Energy level diagram displaying fine and hyperfine structure splitting of 87Rb. The fine structure splitting (left of panel) is a result of the interaction between the electron's orbital and spin angular momentum. The dimensionless number J defines the magnitude of the total angular momentum of the electron (|J|) in a similar way to which S defines the magnitude of the spin angular momentum of the electron. The hyperfine structure splitting is a result of the interaction between the total angular momentum of the electron (J) and the spin angular momentum of the nucleus (I), resulting in possible values for total angular electron momentum (F) of 2 and 1.
Fig. 3
Fig. 3
Optical pumping of 87Rb. In (a) the laser will always provide an increment in mf and, if possible, a D1 transition (from L = 0 to L = 1). This transition however will only be possible if mf < 2 (as the maximal possible value for mfin the L = 1 state is 2). If the sample is in the L = 1 state it may spontaneously emit light (at 795 nm) reversing the D1 transition (but not necessarily the change in mf as the emitted light is equally likely to emit light withmf=0,1,1 ). The result is that atoms begin to accumulate in the L = 0, F= 2, mf=2 state. At this point (as there is no mf =3 state in L = 1) the laser light can no longer drive a D1 transition and passes through the vapour without attenuation. This process is schematised over time in (b) where initially the probability of an atom in the L = 1 state (due to D1 transition) or the L = 0, mf =2 state is low. The action of the laser initially increases the probability of the L = 1 state being occupied (due to D1 transitions) but also increases the probability of the L = 0, mf =2 state occurring due to optical pumping. As atoms become trapped in the L = 0, mf =2 state the probability of D1 transitions drops towards 0 thus rendering the vapour transparent (Figure b is only intended for illustrative purposes and is not intended to be realistic. It was simulated by measuring the frequency of atoms (N = 10000) in a given state following the application of circularly polarised photons to atoms uniformly distributed throughout the ground state Zeeman sub-levels. On some iterations the atoms were allowed to spontaneously emit light with equal probability of mf=0,1,1.Note this does not include effects of spin exchange which are to be covered later).
Fig. 4
Fig. 4
The polarisation along the axis of the laser (Px) displays an absorption profile while the polarisation along the other axis (Py) has a dispersion shape. In both cases the presence of magnetic field causes a polarisation change that is a function of the effective equilibrium polarisation (P0').
Fig. 5
Fig. 5
In the left hand panel the response of the system is plotted over a 40 nT range. In this range the response of the system is clearly non-linear. However if one examines the curve within the dynamic range of the sensors ( ±1.5 nT) a linear approximation to the curve produces a less than 1% deviation at 1 nT (right hand panel). It should be noted that this deviation will differ between different sensor designs and assumes that the transverse fields are close to zero.
Fig. 6
Fig. 6
Bounding the relationship between cross-talk and gain. The exact solution (eq (43)) is derived using the normalised product of a zeroth and first order Bessel function when B2 and B1 are parallel. The gyromagnetic ratio is assumed to be 7 Hz nT−1, the true amplitude of the modulating field is assumed to be 60 nT and the frequency of the field is 923Hz (based on QuSpin OPMs, but the bound is still valid for any OPM utilising modulating fields as long as γB1ω<1.08-maximum of the Bessel function product). Left of the origin the approximation is a lower bound on the cross talk induced gain changes while right of the origin it is an upper bound on the cross-talk induced gain changes. Note that these curves deviate further from linearity for positive cross-talk. It should also be noted that for realistic values of cross-talk the ( ±10%) this bound is a reasonable approximation for both positive and negative gain changes.

References

    1. Alem O., Benison A.M., Barth D.S., Kitching J., Knappe S. Magnetoencephalography of epilepsy with a microfabricated atomic magnetrode. J. Neurosci. 2014;34(43):14324–14327. doi: 10.1523/JNEUROSCI.3495-14.2014. - DOI - PMC - PubMed
    1. Allred J.C., Lyman R.N., Kornack T.W., Romalis M.V. High-sensitivity atomic magnetometer unaffected by spin-exchange relaxation. Phys. Rev. Lett. 2002;89(13):130801. doi: 10.1103/PhysRevLett.89.130801. - DOI - PubMed
    1. Anderson L.W., Pipkin F.M., Baird J.C. N14 - N15 hyperfine anomaly. Phys. Rev. 1959;116(1):87–98. doi: 10.1103/PhysRev.116.87. - DOI
    1. Bagic A.I., Bowyer S.M., Kirsch H.E., Funke M.E., Burgess R.C. American clinical MEG society (ACMEGS) position statement #2: the value of magnetoencephalography (MEG)/magnetic source imaging (MSI) in noninvasive presurgical mapping of eloquent cortices of patients preparing for surgical interventions. J. Clin. Neurophysiol. 2017;34(3):189–195. doi: 10.1097/WNP.0000000000000366. - DOI - PubMed
    1. Baillet S. Magnetoencephalography for brain electrophysiology and imaging. Nat. Neurosci. 2017;20(3):327–339. doi: 10.1038/nn.4504. - DOI - PubMed

Publication types