

System-level matching of structural and functional connectomes in the human brain
- PMID: 31141738
- PMCID: PMC6688960
- DOI: 10.1016/j.neuroimage.2019.05.064
System-level matching of structural and functional connectomes in the human brain
Abstract
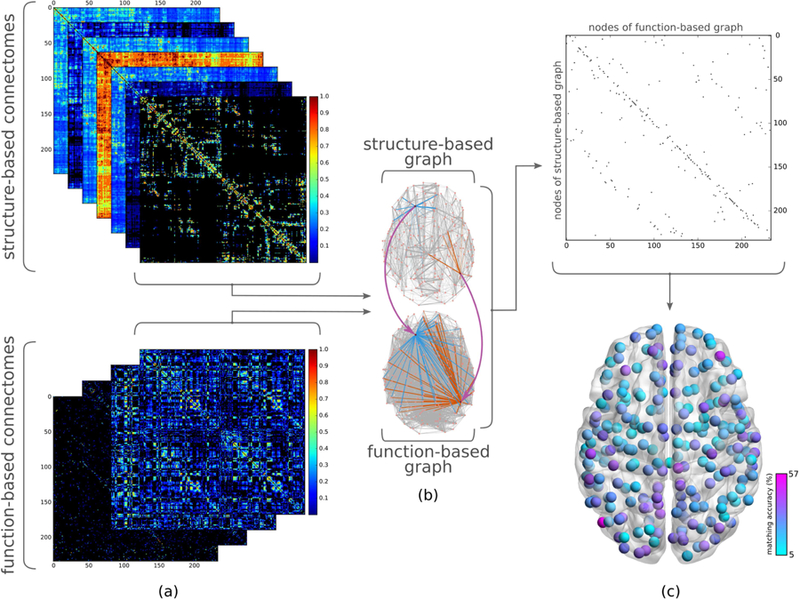
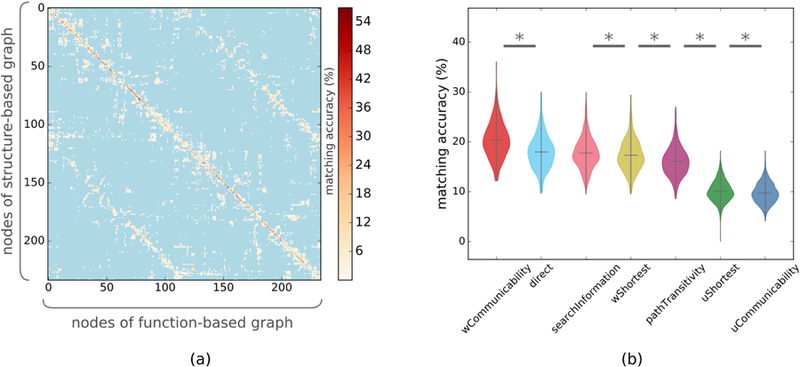
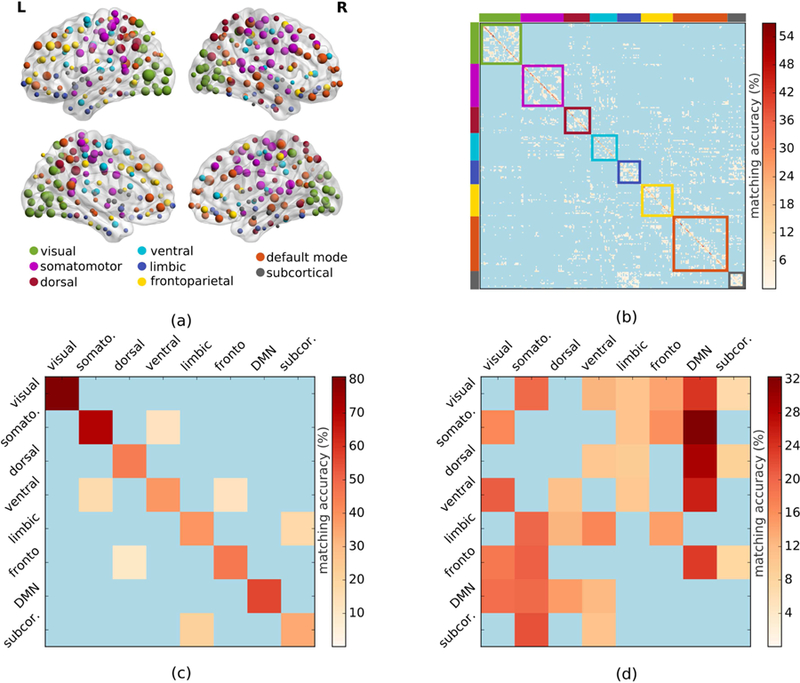
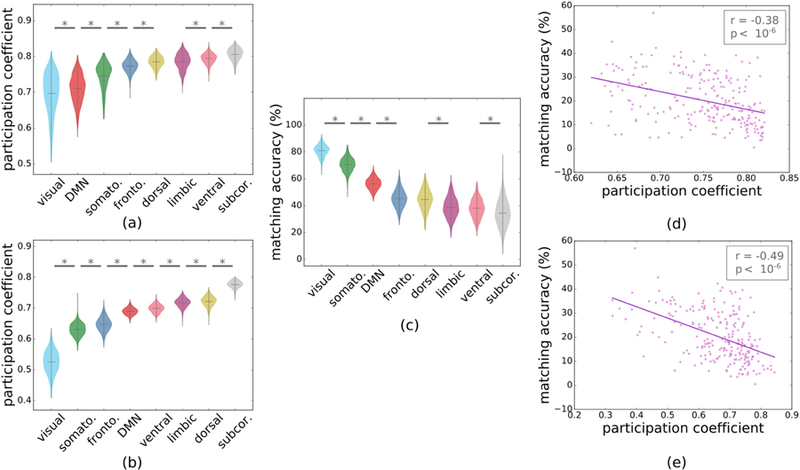
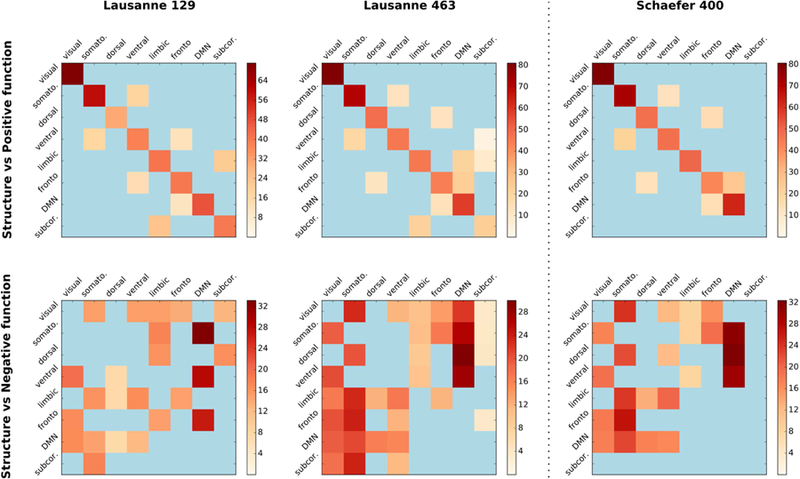
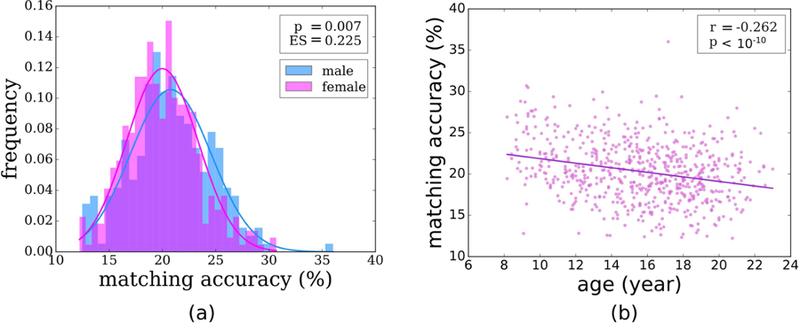
The brain can be considered as an information processing network, where complex behavior manifests as a result of communication between large-scale functional systems such as visual and default mode networks. As the communication between brain regions occurs through underlying anatomical pathways, it is important to define a "traffic pattern" that properly describes how the regions exchange information. Empirically, the choice of the traffic pattern can be made based on how well the functional connectivity between regions matches the structural pathways equipped with that traffic pattern. In this paper, we present a multimodal connectomics paradigm utilizing graph matching to measure similarity between structural and functional connectomes (derived from dMRI and fMRI data) at node, system, and connectome level. Through an investigation of the brain's structure-function relationship over a large cohort of 641 healthy developmental participants aged 8-22 years, we demonstrate that communicability as the traffic pattern describes the functional connectivity of the brain best, with large-scale systems having significant agreement between their structural and functional connectivity patterns. Notably, matching between structural and functional connectivity for the functionally specialized modular systems such as visual and motor networks are higher as compared to other more integrated systems. Additionally, we show that the negative functional connectivity between the default mode network (DMN) and motor, frontoparietal, attention, and visual networks is significantly associated with its underlying structural connectivity, highlighting the counterbalance between functional activation patterns of DMN and other systems. Finally, we investigated sex difference and developmental changes in brain and observed that similarity between structure and function changes with development.
Keywords: Connectomics; Large-scale systems; MRI; Network analysis; Structure-function matching.
Copyright © 2019 Elsevier Inc. All rights reserved.
Figures
Similar articles
-
Complementary contributions of concurrent EEG and fMRI connectivity for predicting structural connectivity.Neuroimage. 2017 Nov 1;161:251-260. doi: 10.1016/j.neuroimage.2017.08.055. Epub 2017 Aug 24. Neuroimage. 2017. PMID: 28842386
-
The structural-functional connectome and the default mode network of the human brain.Neuroimage. 2014 Nov 15;102 Pt 1:142-51. doi: 10.1016/j.neuroimage.2013.09.069. Epub 2013 Oct 4. Neuroimage. 2014. PMID: 24099851
-
Transient networks of spatio-temporal connectivity map communication pathways in brain functional systems.Neuroimage. 2017 Jul 15;155:490-502. doi: 10.1016/j.neuroimage.2017.04.015. Epub 2017 Apr 12. Neuroimage. 2017. PMID: 28412440
-
The parcellation-based connectome: limitations and extensions.Neuroimage. 2013 Oct 15;80:397-404. doi: 10.1016/j.neuroimage.2013.03.053. Epub 2013 Apr 1. Neuroimage. 2013. PMID: 23558097 Review.
-
Connectivity.Curr Top Behav Neurosci. 2014;16:49-77. doi: 10.1007/7854_2013_244. Curr Top Behav Neurosci. 2014. PMID: 23943564 Review.
Cited by
-
Aberrant dynamic structure-function relationship of rich-club organization in treatment-naïve newly diagnosed juvenile myoclonic epilepsy.Hum Brain Mapp. 2022 Aug 15;43(12):3633-3645. doi: 10.1002/hbm.25873. Epub 2022 Apr 13. Hum Brain Mapp. 2022. PMID: 35417064 Free PMC article.
-
Local structure-function relationships in human brain networks across the lifespan.Nat Commun. 2022 Apr 19;13(1):2053. doi: 10.1038/s41467-022-29770-y. Nat Commun. 2022. PMID: 35440659 Free PMC article.
-
Sex differences in structural and functional connectivity in healthy young adults from the Amsterdam Open MRI Collection.Brain Struct Funct. 2025 Jun 16;230(6):98. doi: 10.1007/s00429-025-02965-x. Brain Struct Funct. 2025. PMID: 40522500
-
Structural brain network lateralization across childhood and adolescence.Hum Brain Mapp. 2023 Mar;44(4):1711-1724. doi: 10.1002/hbm.26169. Epub 2022 Dec 7. Hum Brain Mapp. 2023. PMID: 36478489 Free PMC article.
-
DyNAMiC: A prospective longitudinal study of dopamine and brain connectomes: A new window into cognitive aging.J Neurosci Res. 2022 Jun;100(6):1296-1320. doi: 10.1002/jnr.25039. Epub 2022 Mar 16. J Neurosci Res. 2022. PMID: 35293013 Free PMC article.
References
-
- Betzel RF, Byrge L, He Y, Goñi J, Zuo XN and Sporns O, 2014. Changes in structural and functional connectivity among resting-state networks across the human lifespan. Neuroimage, 102, pp.345–357. - PubMed
Publication types
MeSH terms
Grants and funding
LinkOut - more resources
Full Text Sources
Medical
Research Materials
