. 2019 May 28;20(11):2613.
doi: 10.3390/ijms20112613.

Effects of Long-Term Citrate Treatment in the PC3 Prostate Cancer Cell Line

Affiliations

Effects of Long-Term Citrate Treatment in the PC3 Prostate Cancer Cell Line

Carmen Caiazza et al. Int J Mol Sci. .

Abstract

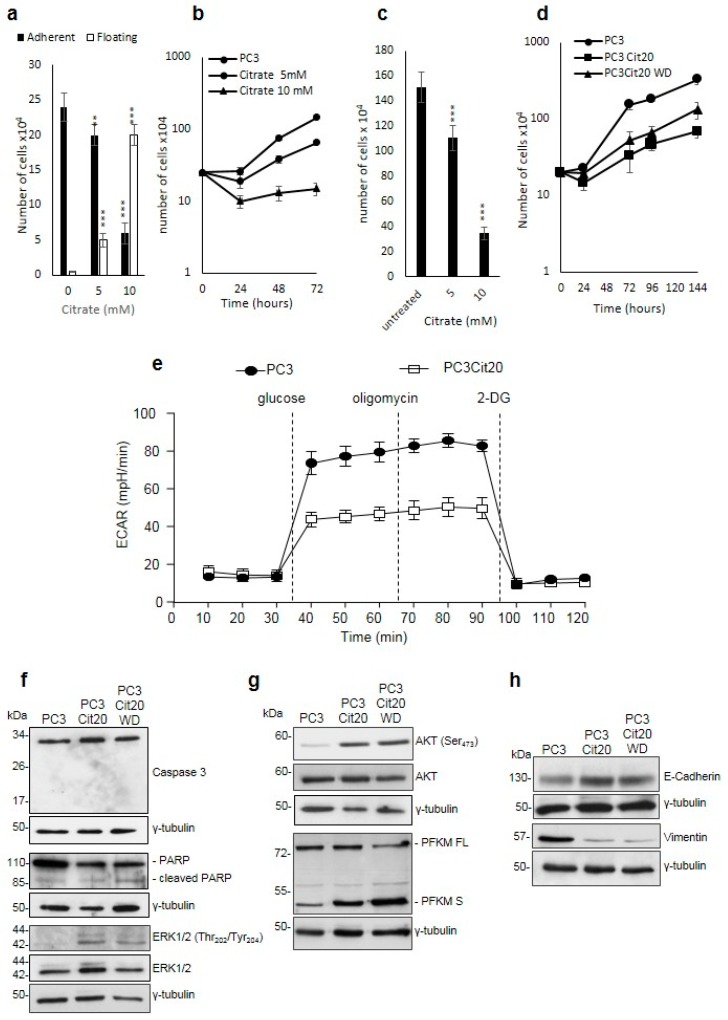
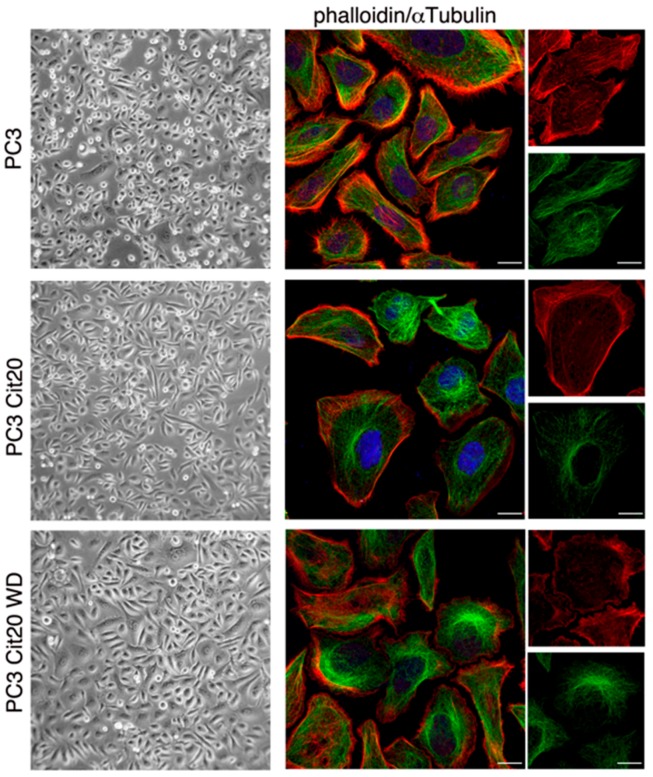
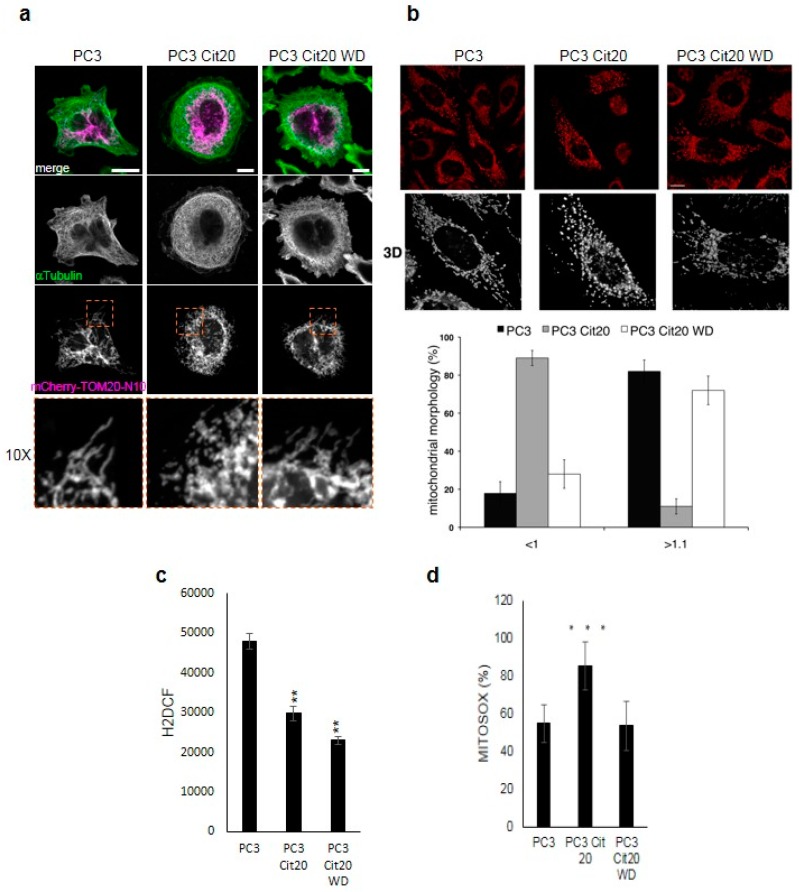
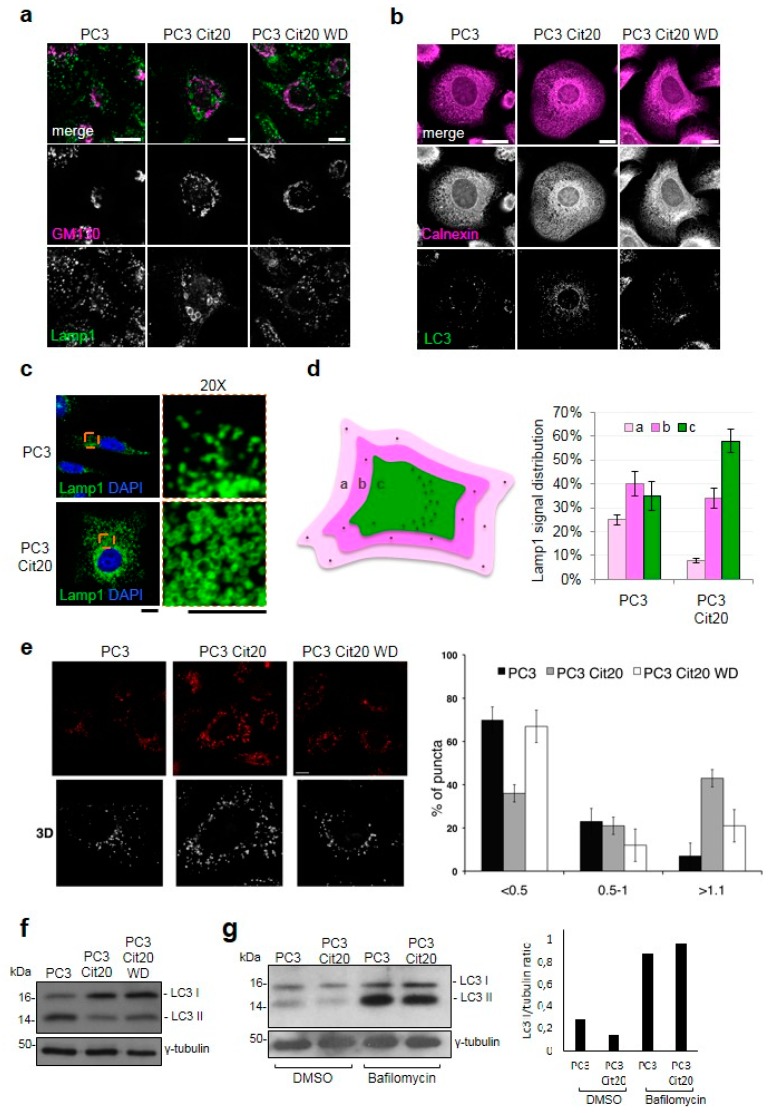
Acute administration of a high level of extracellular citrate displays an anti-proliferative effect on both in vitro and in vivo models. However, the long-term effect of citrate treatment has not been investigated yet. Here, we address this question in PC3 cells, a prostate-cancer-derived cell line. Acute administration of high levels of extracellular citrate impaired cell adhesion and inhibited the proliferation of PC3 cells, but surviving cells adapted to grow in the chronic presence of 20 mM citrate. Citrate-resistant PC3 cells are significantly less glycolytic than control cells. Moreover, they overexpress short-form, citrate-insensitive phosphofructokinase 1 (PFK1) together with full-length PFK1. In addition, they show traits of mesenchymal-epithelial transition: an increase in E-cadherin and a decrease in vimentin. In comparison with PC3 cells, citrate-resistant cells display morphological changes that involve both microtubule and microfilament organization. This was accompanied by changes in homeostasis and the organization of intracellular organelles. Thus, the mitochondrial network appears fragmented, the Golgi complex is scattered, and the lysosomal compartment is enlarged. Interestingly, citrate-resistant cells produce less total ROS but accumulate more mitochondrial ROS than control cells. Consistently, in citrate-resistant cells, the autophagic pathway is upregulated, possibly sustaining their survival. In conclusion, chronic administration of citrate might select resistant cells, which could jeopardize the benefits of citrate anticancer treatment.

Keywords: PC3 cells; autophagy; cell metabolism; citrate; organelle homeostasis; prostate cancer.


Conflict of interest statement

The authors declare no conflict of interest.

Figures

Figure 1
Figure 1
Citrate treatment affects PC3 cell proliferation, survival, and metabolism. (a) Citrate impairs the adhesion of PC3 cells in dose-dependent manner. (b) Citrate inhibits the proliferation in PC3 cells: 5 and 10 mM citrate was added to a culture medium of PC3 cells at the time of seeding, and cells were counted after 48 h in a Neubauer hemocytometer. Data are expressed as mean ± S.D. of a representative experiment performed in triplicate. The differences between treated and untreated cells are statistically significant (p < 0.005 Anova followed by Bonferroni post-test). (c) PC3 cells were seeded, and citrate was added 24 h after plating. Cell number was determined after 72 h. Data represent the mean of quadruplicate values of two independent dishes. (d) Growth curves of PC3 and PC3 Cit20 after citrate withdrawal. Cell number was determined at the indicated time points. Data represent the mean of quadruplicate values of two independent dishes (p < 0.001 Anova followed by Bonferroni post-test). (e) Altered bioenergetic profile in citrate-resistant PC3 cells. Kinetic profile of ECAR in PC3 cells and PC3 cit20 (citrate-resistant) cells. Data are expressed as mean ± S.E.M. of three independent experiments, each of them in triplicate. ECAR was measured in real time, under basal conditions and in response to glucose, oligomycin, and 2-DG. (f–h) Lysates from PC3, PC3 Cit20, and PC3 Cit20 WD cells were analyzed by Western blot using the indicated antibodies. γ tubulin was used as loading control. * p ≤ 0.05; *** p ≤ 0.001, Student t-test.
Figure 2
Figure 2
Cytoskeleton dynamics is altered in citrate-resistant PC3 cells. (left column) Morphological features of PC3 cells wt, Cit20, and Cit20 WD have been analyzed. Cells were observed with Axiovert 25 (Carl Zeiss, Jena, Germany), and representative pictures were taken with Canon GC5 (Canon Italia S.p.A, 20063 Cernusco sul Naviglio, Milan, Italy) (final magnification 40×). (right column) Actin and the microtubule network were labeled using TRITC-conjugated phalloidin, and a specific anti-αtubulin antibody revealed with alexa-488 conjugated secondary antibody, respectively. Nuclei were stained with DRAQ5. Representative images at low (scale bars 10 μm) and higher magnification (rightmost column, scale bars 5 μm) are shown.
Figure 3
Figure 3
The mitochondrial network is altered in citrate-resistant PC3 cells. Representative images of PC3, PC3 Cit20, and PC3 Cit20 WD cells labeled with mCherry-TOM20-N10 (a) or with MitoTracker Red (b) are shown. In (a), cells were also stained using a mouse monoclonal antibody against αtubulin. In (b), a single Z-section and 3D reconstruction of a higher magnification region is shown. Quantification of mitochondrial shape according to length (in μm) is shown. Bars, mean ± S.D. Scale bar 10 μm. (c) Effects of citrate on ROS production in PC3, PC3 Cit20, and PC3 Cit20 WD cells. ROS levels were estimated indirectly by measuring the fluorescence after 45 min H2DCF addition. Data are expressed as mean ± S.D. of a representative experiment performed in triplicate. (**) indicates statistically significant differences (p < 0.05). (d) Effects of citrate on mitochondrial ROS production in PC3, PC3 Cit20, and PC3 Cit20 WD cells. ROS levels were estimated by Mitosox. Data are expressed as mean ± S.D. of a representative experiment performed in triplicate. (***) indicates statistically significant differences (p < 0.0001).
Figure 4
Figure 4
The morphology of Golgi complex and endolysosomal compartment is altered in citrate-resistant PC3 cells. Representative images of PC3, PC3 Cit20, or PC3 Cit20 WD cells labeled with different organelle markers (a-e) are shown. (a,b) PC3, PC3 Cit20, and PC3 Cit20 WD cells were grown on glass coverslips and subjected to indirect immunofluorescence by using the indicated antibodies to stain Golgi complex (GM130), lysosomal compartment (Lamp1), endoplasmic reticulum (Calnexin), and autophagosomes (LC3). A single focal section is shown. Scale bar: 10 μm. (c,d) Lysosomal compartment and nuclei of PC3 and PC3 Cit20 cells were labeled by using a mouse monoclonal antibody against Lamp1 and DAPI, respectively. Magnifications (20×) are shown on the right. Scale bar: 10 μm. In (d), lysosome distribution was analyzed as indicated in the scheme and quantified as reported in the histogram on the right. Data are expressed as mean ± S.D. of three independent experiments on a total of 90 cells. (e) For each condition, single Z-section (scale bar 10 μm) and 3D reconstruction are shown. Quantification of lysosome size expressed as a percentage of total puncta is shown. Bars: mean ± S.D. (f) Western blot analysis of LC3-II protein levels was performed on total cell extracts of PC3, PC3 Cit20, and PC3 Cit20 WD cells. (g) As in (f), LC3-II protein levels were analyzed before and after bafilomycin A1 treatment (400 nM) and quantifications are shown in the histogram on the right.

References

    1. Vander Heiden M.G., DeBerardinis R.J. Understanding the Intersections between Metabolism and Cancer Biology. Cell. 2017;168:657–669. doi: 10.1016/j.cell.2016.12.039. - DOI - PMC - PubMed
    1. Warburg O., Wind F., Negelein E. The Metabolism of Tumors in the Body. J. Gen. Physiol. 1927;8:519–530. doi: 10.1085/jgp.8.6.519. - DOI - PMC - PubMed
    1. Iacobazzi V., Infantino V. Citrate—New functions for an old metabolite. Biol. Chem. 2014;395:387–399. doi: 10.1515/hsz-2013-0271. - DOI - PubMed
    1. Smerc A., Sodja E., Legisa M. Posttranslational modification of 6-phosphofructo-1-kinase as an important feature of cancer metabolism. PLoS ONE. 2011;6:e19645. doi: 10.1371/journal.pone.0019645. - DOI - PMC - PubMed
    1. Sola-Penna M., Da Silva D., Coelho W.S., Marinho-Carvalho M.M., Zancan P. Regulation of mammalian muscle type 6-phosphofructo-1-kinase and its implication for the control of the metabolism. IUBMB Life. 2010;62:791–796. doi: 10.1002/iub.393. - DOI - PubMed