. 2019 May 28;11(6):739.
doi: 10.3390/cancers11060739.

Identification of Novel Anti-Liver Cancer Small Molecules with Better Therapeutic Index than Sorafenib via Zebrafish Drug Screening Platform

Affiliations

Identification of Novel Anti-Liver Cancer Small Molecules with Better Therapeutic Index than Sorafenib via Zebrafish Drug Screening Platform

Han-Syuan Lin et al. Cancers (Basel). .

Abstract

Hepatocellular carcinoma (HCC) ranks as the fourth leading cause of cancer-related deaths worldwide. Sorafenib was the only U.S. Food and Drug Administration (FDA) approved drug for treating advanced HCC until recently, so development of new target therapy is urgently needed. In this study, we established a zebrafish drug screening platform and compared the therapeutic effects of two multiple tyrosine kinase inhibitors, 419S1 and 420S1, with Sorafenib. All three compounds exhibited anti-angiogenesis abilities in immersed fli1:EGFP transgenic embryos and the half inhibition concentration (IC50) was determined. 419S1 exhibited lower hepatoxicity and embryonic toxicity than 420S1 and Sorafenib, and the half lethal concentration (LC50) was determined. The therapeutic index (LC50/IC50) for 419S1 was much higher than for Sorafenib and 420S1. The compounds were either injected retro-orbitally or by oral gavage to adult transgenic zebrafish with HCC. The compounds not only rescued the pathological feature, but also reversed the expression levels of cell-cycle-related genes and protein levels of a proliferation marker. Using a patient-derived-xenograft assay, we found that the effectiveness of 419S1 and 420S1 in preventing liver cancer proliferation is better than that of Sorafenib. With integrated efforts and the advantage of the zebrafish platform, we can find more effective and safe drugs for HCC treatment and screen for personalized medicine.

Keywords: anti-angiogenesis; anti-proliferation; hepatocellular carcinoma (HCC); patient-derived xenograft; zebrafish drug screening.


Conflict of interest statement

The authors declare no conflict of interest.

Figures
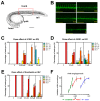
Figure 1
Figure 1
Titrations of 419S1, 420S1, and Sorafenib, and determination of the half maximal inhibitory concentration (IC50) for anti-angiogenesis. (A) Schematic illustration of the zebrafish embryo at two days post fertilization (dpf), indicating the trunk region for measuring the length of intersegmental vessels (ISVs). (B) Representative images of the 2 dpf embryos exposed to compounds for one day with the lengths of ISVs reaching the dorsal longitudinal anastomotic vessel (DLAV) fully (1), three quarters (3/4), halfway (1/2), one-quarter (1/4), or none (0). Scale bar of A and B: 0.2 mm. (C) Bar chart (mean and S.E.M.) showing a significant reduction in the length of ISVs after one day immersion with 419S1 at three concentrations (0.625, 1.25, and 2.5 μM). (D) Quantification of ISVs showed a significant inhibition of angiogenesis after 420S1 treatment at three concentrations (2.5, 5, and 10 μM). (E) Exposure to Sorafenib lead to a significant reduction in the length of ISVs at four concentrations (0.1, 0.3, 0.45, and 0.625 μM). (F) The dose-response fitting curve of 419S1, 420S1, and Sorafenib was generated by Prism8 (GraphPad Software, San Diego, CA, USA). Inhibition of ISV percentage is the percentage of embryos combined with all form of shortened ISVs. *: 0.01 < p ≤ 0.05; **: 0.001 < p ≤ 0.01; ***: p ≤ 0.001.
Figure 2
Figure 2
419S1, 420S1, and Sorafenib exhibit anti-proliferation and anti-migration abilities in a xenotransplantation assay. (A) Schematic diagrams of proliferation and migration changes at one, three, and five days post-injection (dpi). The red fluorescence was the CM-DiI-labeled 293T cells overexpressing EDN1 oncogene microinjected into 2 dpf Tg(fli:EGFP) zebrafish embryos where blood vessels express green fluorescence. One dpi images of embryos carrying 293T/EDN1 were captured, compounds were added to the solution, and images of embryos were captured two days after drug treatment at three dpi, or four days of drug treatment at five dpi. Scale bar: 0.2 mm. (B) Dot-plot (mean and S.E.M.) showing 419S1, 420S1, and Sorafenib treatment significantly decreased the percentage of embryos with tumor cell proliferation. (C) Dot-plot (mean and S.E.M.) showing 419S1, 420S1, and Sorafenib treatment significantly decreased the percentage of embryos with tumor cell migration behavior compared to the dimethyl sulfoxide (DMSO) control. *: 0.01 < p ≤ 0.05; **: 0.001 < p ≤ 0.01; ***: p ≤ 0.001.
Figure 3
Figure 3
Liver red fluorescence and liver size Tg(fabp10a:EGFP-mCherry) embryos treated with 419S1, 420S1, and Sorafenib for two days starting at three dpf. (A) Tg(fabp10a:EGFP-mCherry) embryos treated with 420S1 and Sorafenib showed significant decreases in liver fluorescence intensity compared to DMSO control; 419S1 does not reduce the fluorescence intensity. (B) Tg(fabp10a:EGFP-mCherry) embryos treated with 420S1 and Sorafenib had significant decreases in liver size compared to the DMSO control; 419S1 did not reduce liver size. (C) Representative images with fixed exposure time to capture the liver fluorescence intensity of embryos treated with DMSO, 419S1, 420S1, and Sorafenib. (D) Representative images with sufficient exposure time to show the whole liver size of embryos treated with DMSO, 419S1, 420S1, and Sorafenib. Scale bar of C and D: 0.25 mm. *: 0.01 < p ≤ 0.05; **: 0.001 < p ≤ 0.01; ***: p ≤ 0.001.
Figure 4
Figure 4
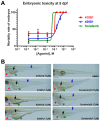
The dose–response fitting mortality curve of wide-type embryos treated with 419S1, 420S1, and Sorafenib for five days, starting six hours post-fertilization. (A) Embryos treated with Sorafenib had a significantly higher mortality rate compared to 419S1 and 420S1. (B) Representative images of wild-type embryos treated with 419S1, 420S1, and Sorafenib at specified concentrations for five days. Abnormal embryonic phenotypes are shown with arrows. Red arrow: pericardial edema; green arrow: retarded yolk sac reabsorption; black arrow: retarded swim bladder inflation; blue arrow: spinal curvature and/or short body length. Scale bar: 0.2mm.
Figure 5
Figure 5
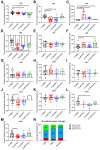
Treatment with 419S1 and 420S1 blocked hepatocellular carcinoma (HCC) formation in Tg(fabp10a:HBx, p53) and Tg(fabp10a:src, p53) transgenic zebrafish. (AC) Dot-plot of the relative expression fold of cell-cycle-related genes ccne1, cdk1, and cdk2 after drug treatment compared to control fish. DMSO-treated Tg(fabp10a:HBx, p53) and Tg(fabp10a:src, p53) transgenic fish exhibited high levels of ccne1, cdk1, and cdk2 expression compared to control fish. DMSO- (black circle), 419S1- (red square), 420S1- (blue triangle), and Sorafenib (green diamond)-treated Tg(fabp10a:HBx, p53) and Tg(fabp10a:src, p53) transgenic fish demonstrated significantly decreased ccne1 expression compared to DMSO. (D,E) Percentage of fish with various histopathological features revealed by hematoxylin and eosin (H&E) staining after different drug treatments for one month. Red indicates HCC, orange denotes dysplasia, yellow represents hyperplasia, green denotes steatosis, and grey is normal hepatocyte. (F) Representative images of H&E stain (400 ×) after one month of 419S1, 420S1, or Sorafenib treatment. Top panels are Tg(fabp10a:HBx, p53) and bottom panels are Tg(fabp10a:src, p53) transgenic fish. Scare bar: 100 μm. *: 0.01 < p ≤ 0.05; **: 0.001 < p ≤ 0.01; ***: p ≤ 0.001.
Figure 6
Figure 6
The treatment of 419S1 and 420S1 blocked HCC formation in Tg(fabp10a:HBx,p53)-TG13 and TG2 transgenic zebrafish revealed by Q-PCR analysis or proliferation markers. (A) Dot-plot of relative expression fold of cell-cycle-related gene ccne1 after drug treatment compared to control fish. DMSO-treated Tg(fabp10a:HBx,p53) fish exhibited high levels of ccne1 expression compared to control fish. DMSO- (black circle), 419S1- (red square), 420S1- (blue triangle), and Sorafenib (green diamond)-treated Tg(fabp10a:HBx,p53) fish demonstrated significantly decreased ccne1 expression compared to DMSO. (B) Expression level of cell-cycle-related genes cdk1 for 419S1 and 420S1 in TG13 and TG2 of Tg(fabp10a:HBx,p53). (C) Expression level of cell-cycle-related genes cdk2 for 419S1 and 420S1 in TG13 and TG2 of Tg(fabp10a:HBx,p53). **: 0.001 < p ≤ 0.01; ***: p ≤ 0.001.
Figure 7
Figure 7
The treatment of 419S1 and 420S1 blocked HCC formation in Tg(fabp10a:HBx,src, p53) transgenic zebrafish. (AC) Dot-plot of relative expression fold of cell-cycle-related genes ccne1, cdk1, and cdk2 after 419S1 and 420S1 oral gavage for one month in Tg(fabp10a:HBx,src, p53) compared to control fish. DMSO-treated Tg(fabp10a:HBx,src, p53) fish exhibited high levels of ccne1, cdk1, and cdk2 expression compared to control fish. DMSO- (black circle), 419S1- (red square), and 420S1 (blue triangle)-treated Tg(fabp10a:HBx,src, p53) fish showed significantly decreased ccne1, cdk1, and cdk2 expression compared to DMSO. (D) Dot-plot of relative expression fold of immunoreactive score (IRS), which was obtained by multiplying the intensity grade by the percentage rating from PCNA IHC stain. (E) Percentage of fish with various histopathological features revealed by H&E stain after different drug treatments for one month. Red indicates HCC, orange denotes dysplasia, yellow represents hyperplasia, green denotes steatosis, and grey is normal hepatocyte. (F) Representative images of H&E stain (400 ×) and PCNA IHC staining after 419S1 and 420S1 oral gavage for one month in Tg(fabp10a:HBx,src, p53) compared to DMSO control. Scare bar: 100 μm. *: 0.01 < p ≤ 0.05; **: 0.001 < p ≤ 0.01; ****: p ≤ 0.0001.
Figure 8
Figure 8
419S1, 420S1 and Sorafenib exhibit anti-proliferation and anti-migration abilities in a liver cancer patient-derived-xenograft (PDX). (AM) Embryos carried tumor cells from different patients (labeled on top) were labeled with fluorescence dye and injected into 2 dpf zebrafish embryos, and treated with DMSO (black circle), 419S1 (red square), 420S1 (blue triangle), and Sorafenib (green diamond) for two days starting one day post-injection of the tumor cells. (N) Different patients’ tumors responded differently to the drugs. The effectiveness of the drugs was summarized and showed 419S1 as the most effective. Red indicates proliferation increased, blue denotes proliferation did not change after drug treatment, and green denotes proliferation decreased after drug treatment. *: 0.01 < p ≤ 0.05; **: 0.001 < p ≤ 0.01; ***: 0.0001 < p ≤ 0.001; ****: p ≤ 0.0001.

References

    1. Villanueva A. Hepatocellular Carcinoma. N. Engl. J. Med. 2019;380:1450–1462. doi: 10.1056/NEJMra1713263. - DOI - PubMed
    1. Gomaa A.-I. Hepatocellular carcinoma: Epidemiology, risk factors and pathogenesis. World J. Gastroenterol. 2008;14:4300. doi: 10.3748/wjg.14.4300. - DOI - PMC - PubMed
    1. Kim H.S., El-Serag H.B. The Epidemiology of Hepatocellular Carcinoma in the USA. Curr. Gastroenterol. Rep. 2019;21:17. doi: 10.1007/s11894-019-0681-x. - DOI - PubMed
    1. Sayiner M., Golabi P., Younossi Z.M. Disease Burden of Hepatocellular Carcinoma: A Global Perspective. Dig. Dis. Sci. 2019;64:910–917. doi: 10.1007/s10620-019-05537-2. - DOI - PubMed
    1. Chong D.Q., Tan I.B., Choo S.P., Toh H.C. The evolving landscape of therapeutic drug development for hepatocellular carcinoma. Contemp. Clin. Trials. 2013;36:605–615. doi: 10.1016/j.cct.2013.03.013. - DOI - PubMed

LinkOut - more resources