

Geographical patterns of the incidence and mortality of colorectal cancer in mainland Portugal municipalities (2007-2011)
- PMID: 31142284
- PMCID: PMC6542026
- DOI: 10.1186/s12885-019-5719-9
Geographical patterns of the incidence and mortality of colorectal cancer in mainland Portugal municipalities (2007-2011)
Abstract
Background: Cancer is a leading cause of morbidity and mortality in the world. In Portugal, colorectal cancer is one of the most incident cancers; thus, it is crucial to act to fight it. Knowledge of the geographical distribution of the incidence and mortality of colorectal cancer can facilitate the execution of these actions and make them more effective.
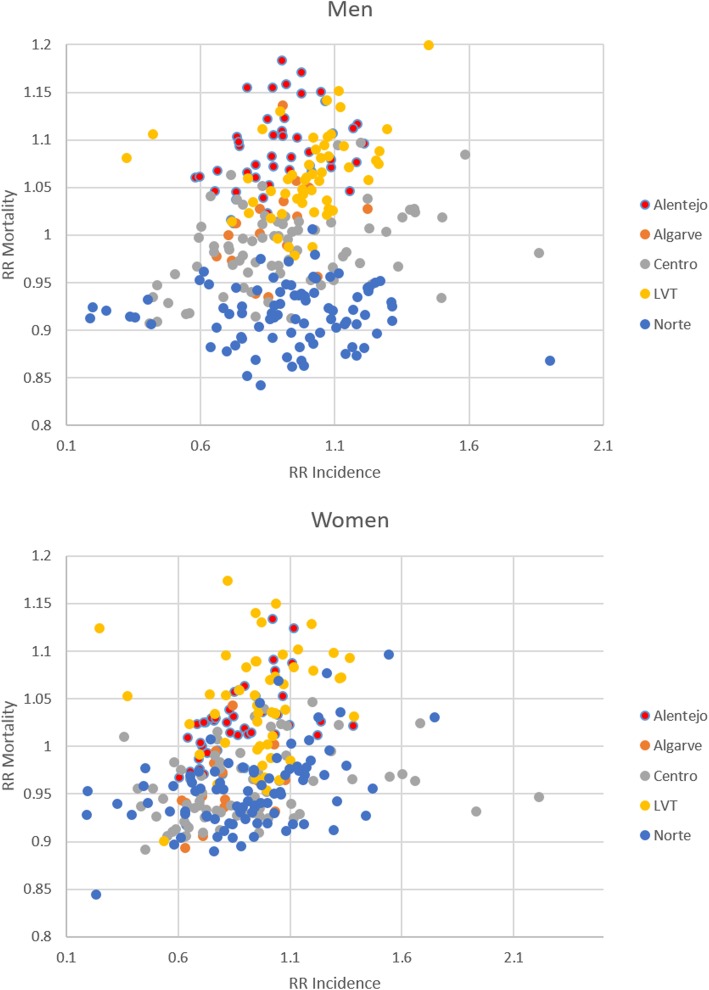
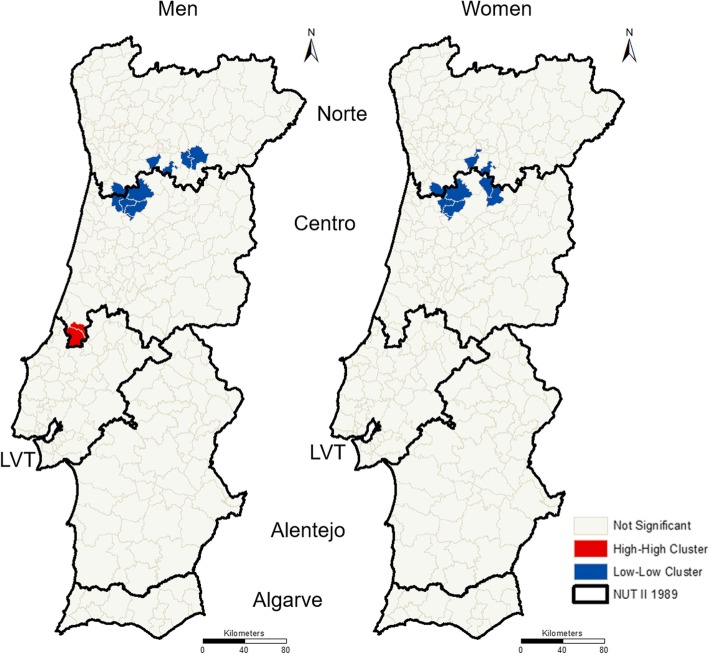
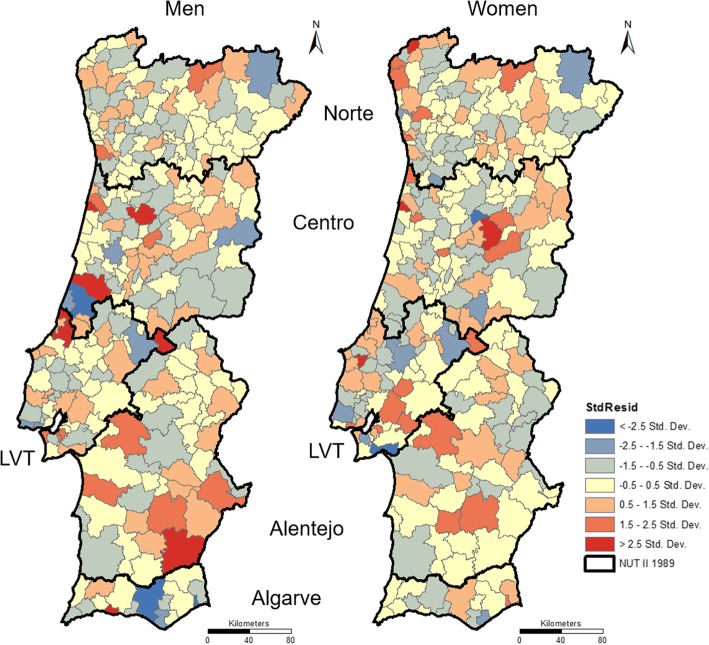
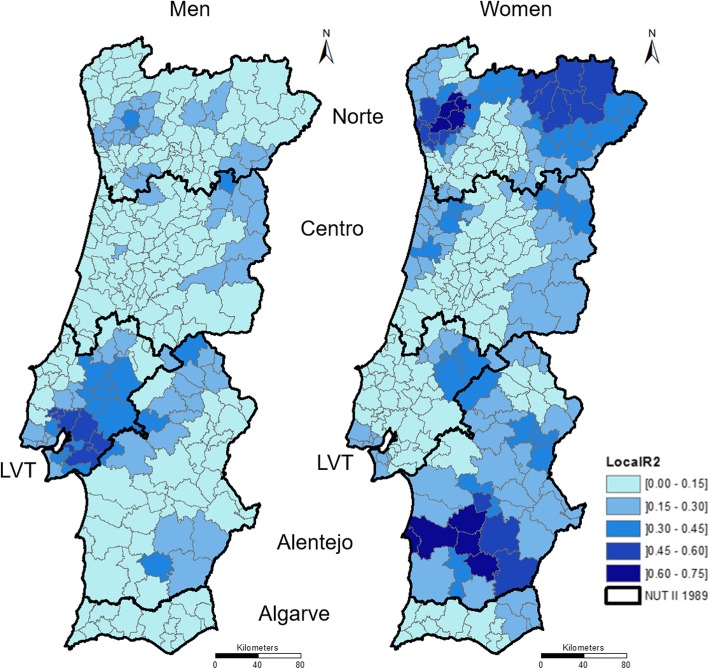
Methods: Our paper aims to describe and discuss the geographical patterns of colorectal cancer incidence and mortality in mainland Portugal municipalities (2007-2011). We used the Besag, York and Mollié (BYM) model to compute the relative risk (RR) and posterior probability (PP). We performed a cluster analysis with Global Moran's Index and Local Moran's Index (LISA). We ran a geographically weighted regression (GWR) to compare incidence and mortality patterns.
Results: Incidence and mortality have different distributions of RR values. The interval of RR concerning incidence was higher than the interval of RR concerning mortality. PP values reinforce the finding of higher heterogeneity of the incidence of colorectal cancer. The comparison of the cluster maps for incidence and mortality shows a few municipalities classified with the same cluster type in both maps. Additionally, the GWR results show that the percentage of RR mortality explained by RR incidence differs throughout mainland Portugal. From the comparison of our results with the prevalence of risk factors (at NUTS II level), the need to be aware of smoking habits, alcohol consumption and the unhealthy diet of the Portuguese population stands out.
Conclusions: There are differences in the geographical distribution of the RR incidence and RR mortality of colorectal cancer in mainland Portugal municipalities. Likewise, it is relevant to highlight the cluster of two municipalities with high RR values concerning colorectal cancer's incidence and mortality. Future research is necessary to explain the geographical differences in the distribution of colorectal cancer in mainland Portugal municipalities. Based on our findings, it may be interesting to examine the influence of smoking, alcohol consumption, diet and screening on colorectal cancer in greater detail. Additionally, it may be relevant to develop an analysis focused on municipalities where the incidence values explain the mortality values poorly (or well).
Keywords: BYM; Colorectal cancer; GWR; Geographical distribution; Incidence; Mortality; Spatial epidemiology.
Conflict of interest statement
The authors declare that they have no competing interests.
Figures


References
-
- Cotter J. Colorectal cancer: Portugal and the world. Acta Medica Port. 2013;26:485–486. - PubMed
-
- Pinheiro P, Tyczynski J, Bray F, Amado J, Matos E, Miranda A, Limbert E. Cancer in Portugal. In: IARC, editor. IARC technical publication no 38. France, IARC, 2002. p. 72.
Publication types
MeSH terms
LinkOut - more resources
Full Text Sources
Medical
Miscellaneous
