. 2019 May 29;16(1):114.
doi: 10.1186/s12974-019-1487-3.

TRPV1 mediates astrocyte activation and interleukin-1β release induced by hypoxic ischemia (HI)

Affiliations

TRPV1 mediates astrocyte activation and interleukin-1β release induced by hypoxic ischemia (HI)

Xing-Liang Yang et al. J Neuroinflammation. .

Abstract

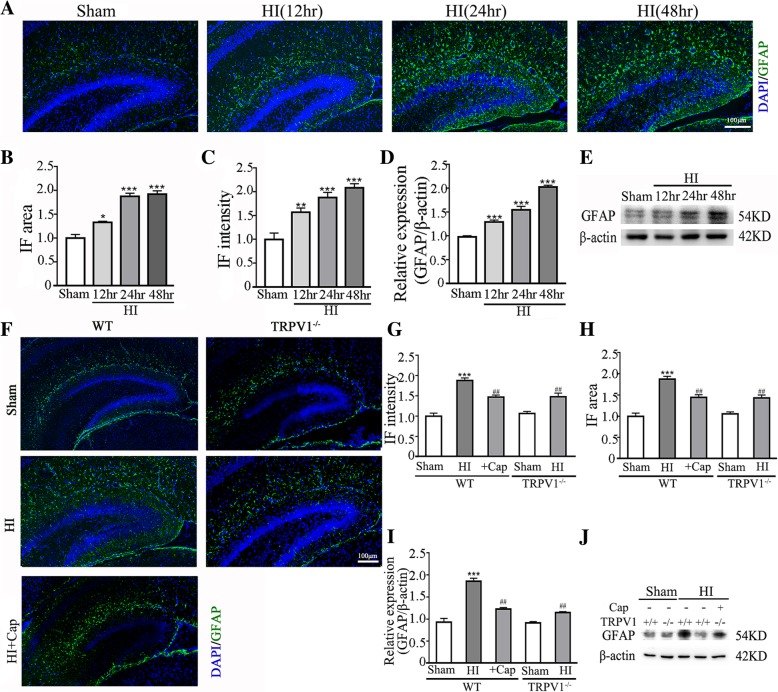
Background: Hypoxic-ischemic encephalopathy (HIE) is a serious birth complication with high incidence in both advanced and developing countries. Children surviving from HIE often have severe long-term sequela including cerebral palsy, epilepsy, and cognitive disabilities. The severity of HIE in infants is tightly associated with increased IL-1β expression and astrocyte activation which was regulated by transient receptor potential vanilloid 1 (TRPV1), a non-selective cation channel in the TRP family.

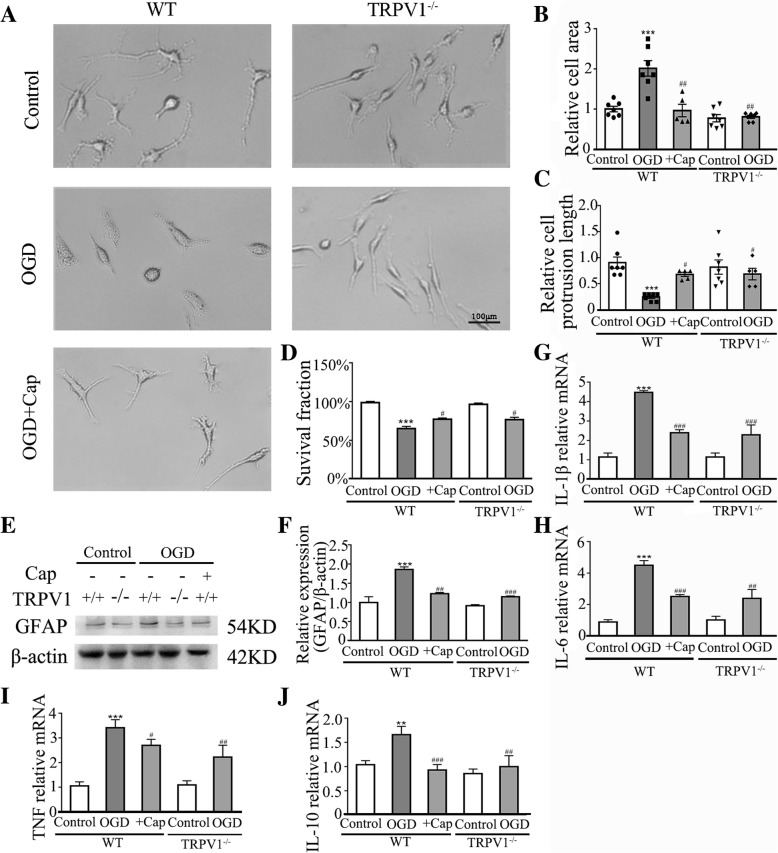
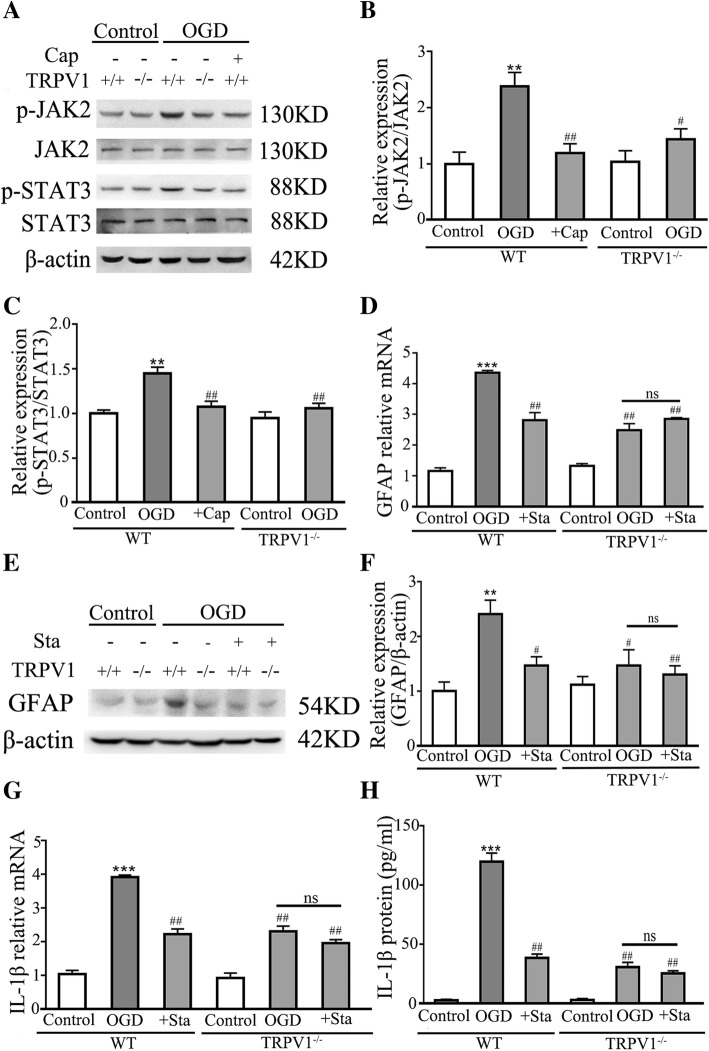
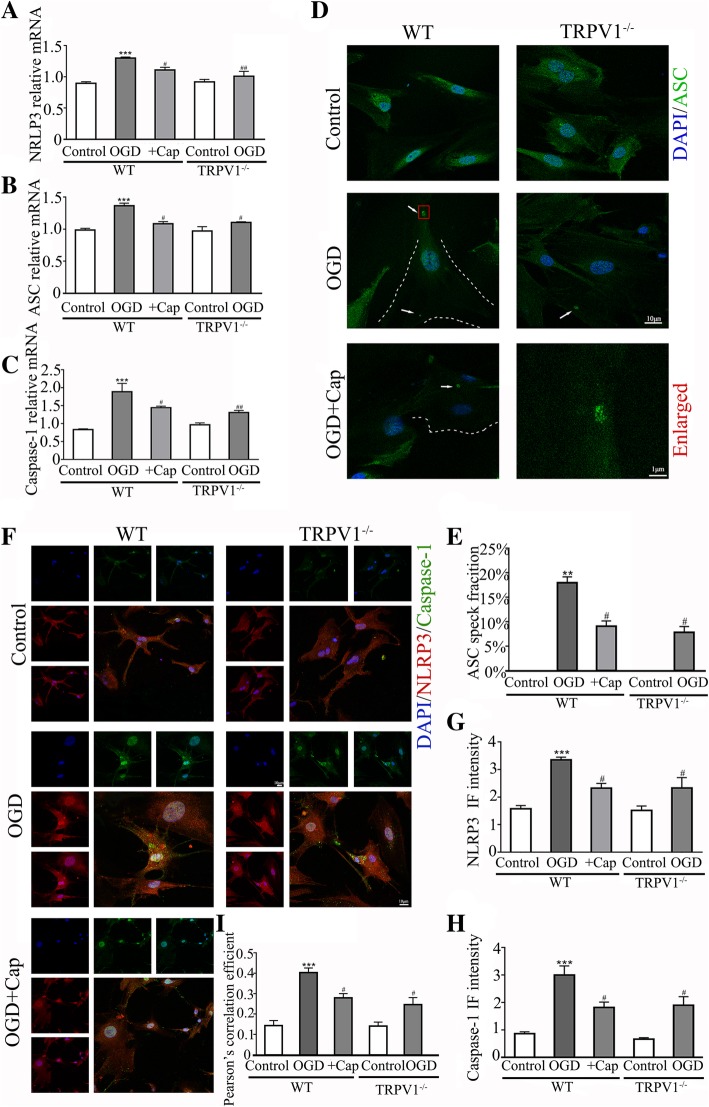
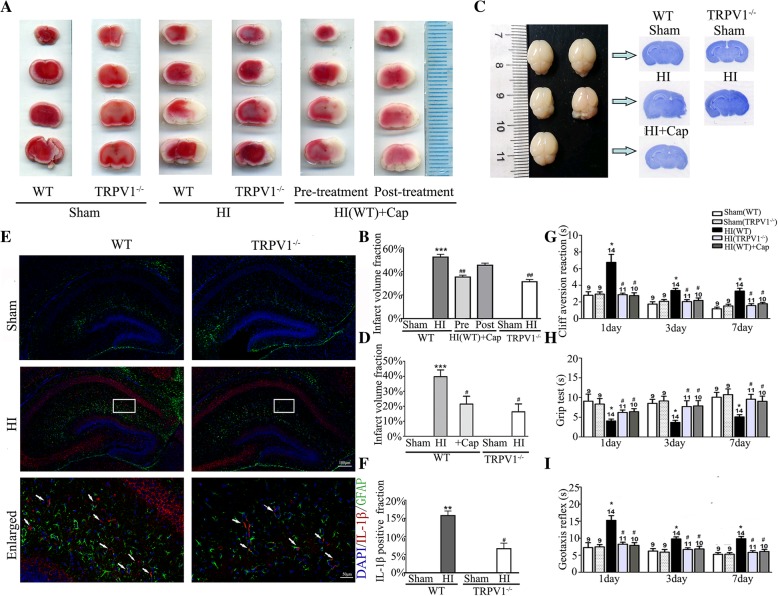
Methods: Neonatal hypoxic ischemia (HI) and oxygen-glucose deprivation (OGD) were used to simulate HIE in vivo and in vitro. Primarily cultured astrocytes were used for investigating the expression of glial fibrillary acidic protein (GFAP), IL-1β, Janus kinase 2 (JAK2), signal transducer and activator of transcription 3 (STAT3), and activation of the nucleotide-binding, oligomerization domain (NOD)-like receptor pyrin domain-containing protein 3 (NLRP3) inflammasome by using Western blot, q-PCR, and immunofluorescence. Brain atrophy, infarct size, and neurobehavioral disorders were evaluated by Nissl staining, 2,3,5-triphenyltetrazolium chloride monohydrate (TTC) staining and neurobehavioral tests (geotaxis reflex, cliff aversion reaction, and grip test) individually.

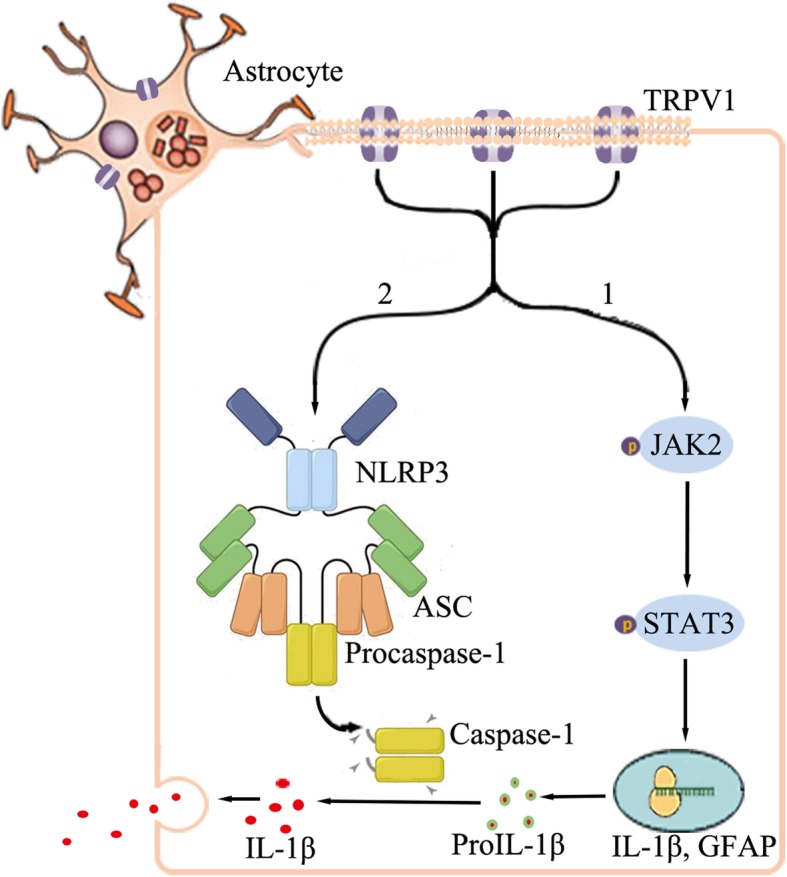
Results: Astrocytes were overactivated after neonatal HI and OGD challenge. The number of activated astrocytes, the expression level of IL-1β, brain atrophy, and shrinking infarct size were all downregulated in TRPV1 KO mice. TRPV1 deficiency in astrocytes attenuated the expression of GFAP and IL-1β by reducing phosphorylation of JAK2 and STAT3. Meanwhile, IL-1β release was significantly reduced in TRPV1 deficiency astrocytes by inhibiting activation of NLRP3 inflammasome. Additionally, neonatal HI-induced neurobehavioral disorders were significantly improved in the TRPV1 KO mice.

Conclusions: TRPV1 promotes activation of astrocytes and release of astrocyte-derived IL-1β mainly via JAK2-STAT3 signaling and activation of the NLRP3 inflammasome. Our findings provide mechanistic insights into TRPV1-mediated brain damage and neurobehavioral disorders caused by neonatal HI and potentially identify astrocytic TRPV1 as a novel therapeutic target for treating HIE in the subacute stages (24 h).

Keywords: Astrocyte; HI; IL-1β; TRPV1.


Conflict of interest statement

The authors declare that they have no competing interests.

Figures

Fig. 1
Fig. 1
Knocking out TRPV1 inhibited GFAP expression in hypoxia-ischemia brain tissue. a After HI, GFAP expression was upregulated at 12 h, 24 h, and 48 h. GFAP expression levels by immunofluorescence were examined in the ipsilateral hemisphere sections from sham and HI groups. Scale bar = 100 μm. b, c Immunofluorescence intensity and cluster size of GFAP in the ipsilateral hemisphere hippocampus significantly increased in HI brain compared to sham brain. n = 6 for each group. d, e Western blot revealed upregulated expression of GFAP at 12 h, 24 h, and 48 h. GFAP expression levels were examined in ipsilateral hemisphere sections from Sham and HI. Quantification of independent blots. n = 5 for each group. f Knocking out TRPV1 or pretreating capsaicin reduced the upregulation of GFAP as shown by immunofluorescence at 24 h. Scale bar = 100 μm. g, h Knocking out TRPV1 or pretreating capsaicin reduced immunofluorescence intensity and cluster size of GFAP compared to HI group. n = 6 for each group. i, j Western blot revealed that knocking out TRPV1 or pretreating capsaicin reduced GFAP upregulation compared to HI group. Quantification of independent blots. n = 5 for each group. Cap, 3 mg/kg capsaicin. Average values represent the mean ± SEM. *P < 0.05, **P < 0.01, ***P < 0.001 versus sham (Tukey’s test after one-way ANOVA). ##P < 0.001 versus WT-HI (Tukey’s test after one-way ANOVA)
Fig. 2
Fig. 2
Knocking out TRPV1-protected astrocyte against ischemia-induced damage and inhibits its activation and expression of inflammatory cytokines. a Knocking out TRPV1 and pretreating with capsaicin (10 μM) 0.5 h before OGD prevented astrocytes from cell body edema, reduction of branch processes after OGD. b, c Cell area and protrusion length were normalized to control for other groups 24 h after OGD. n = 5–7 for each group. d Cell viability of astrocytes was promoted in the TRPV1−/− and pre-treating with capsaicin group compared to OGD group. n = 6 for each group. e Western blot revealed that knocking out TRPV1 or pretreating capsaicin reduced the upregulation of GFAP compared to OGD group. f Quantification of independent blots. n = 5 for each group. gj The graphical representation of the fold changes of the expression of IL-1β, IL-6, TNF, and IL-10. Knocking out TRPV1 or pre-treating with capsaicin inhibited the upregulation of IL-1β, IL-6, TNF, and IL-10 compared to OGD group. n = 5 for each group. Cap, 10 μM capsaicin. Average values represent the mean ± SEM. **P < 0.01, ***P < 0.001 versus control (Tukey’s test after two-way ANOVA). #P < 0.05, ##P < 0.01, ###P < 0.001 versus WT-OGD (Tukey’s test after one-way ANOVA)
Fig. 3
Fig. 3
Knocking out TRPV1 inhibited the phosphorylation of JAK2 and STAT3, astrocytes activation, and the expression of IL-1β. a Western blot analysis showed the upregulated after OGD, and knocking out TRPV1 or pretreating with capsaicin inhibited the phosphorylation of JAK2 and STAT3 compared to OGD group. b, c #P < 0.05 (Tukey’s test after two-way repeated-measures ANOVA). n = 5 for each group. d The graphical representation of the fold changes of the expression of GFAP, treating with Stattic (5 μM) inhibited the upregulation of GFAP. n = 5 for each group. e Western blot revealed treating with Stattic (5 μM) inhibited the upregulation of GFAP. n = 5 for each group. f As confirmed by quantification of independent blots. #P < 0.05 (Tukey’s test after two-way repeated-measures ANOVA). n = 5 for each group. g, h The graphical representation of the fold changes of IL-1β. Treating with Stattic (5 μM) inhibited the upregulation of IL-1β. n = 6 for each group. Cap, 10 μM capsaicin. Sta, 5 μM stattic. Average values represent the mean ± SEM. **P < 0.01, ***P < 0.001 versus control (Tukey’s test after one-way ANOVA). #P < 0.05, ##P < 0.01 versus WT-OGD (Tukey’s test after one-way ANOVA). ns P > 0.05 (Tukey’s test after one-way ANOVA)
Fig. 4
Fig. 4
Knocking out TRPV1 attenuates the formation of NLRP3 inflammasome. ac The graphical representation of the fold changes of NLRP3, ASC, and caspase-1. Knocking out TRPV1 or pretreating with capsaicin reduced the upregulation of NLRP3, ASC, and caspase-1 compared to OGD group. n = 5 for each group. d Confocal images showed ASC specks increased after OGD, and knocking out TRPV1 or pretreating with capsaicin inhibited the increase of ASC specks compared to OGD group. White arrows indicate ASC specks and the scale bar = 10 μm, scale bar = 1 μm for the enlarged image. e ASC speck positive astrocytes percentage was determined in 10 fields/well and divided by the number of cells counterstained with DAPI. n = 4 for each group. f Confocal images showed that NLRP3 and caspase-1 were increased after OGD, and knocking out TRPV1 or pretreating with capsaicin inhibited their upregulation compared to OGD group. Scale bar = 10 μm. g, h The intensity of NLRP3 and caspase-1 fluorescence was determined in 10 fields/well and divided by the number of cells counterstained with DAPI. n = 4 for each group. i Pearson’s correlation coefficient is shown in the graph from the analysis of independent experiments. n = 4 for each group. Cap, 10 μM capsaicin. Average values represent the mean ± SEM. **P < 0.01, ***P < 0.001 versus control (Tukey’s test after one-way ANOVA). #P < 0.05, ##P < 0.01 versus WT-OGD (Tukey’s test after one-way ANOVA)
Fig. 5
Fig. 5
Knocking out TRPV1 reduced infarct volume, brain atrophy, and neurobehavioral loss. a Representative TTC stained coronal brain sections from the sham, HI, and capsaicin treatment groups with different injection times as shown, n = 7–8 for each group. b Quantitative analysis of the infarct volume revealed that knocking out TRPV1 or pretreating with capsaicin reduced the infarct volume. c Whole brain Nissl staining from the sham, HI, and capsaicin treatment groups are shown. n = 8 for each group. d Quantitative analysis of brain atrophy in which knocking out TRPV1 or pretreating with capsaicin produced reduction the infarct volume. n = 8 for each group. e Confocal images showed knocking out TRPV1 inhibited the increase of IL-1β-positive astrocytes compared to HI group in the ipsilateral hemisphere. White arrows indicate IL-1β-positive astrocytes and the scale bar = 100 μm, scale bar = 50 μm for the enlarged image. f IL-1β-positive astrocytes percentage was determined in 10 fields/section and divided by the number of cells counterstained with DAPI. n = 4 for each group. g The geotaxis reflex results at 1, 3, and 7 days, showing the time that pups took to turn around. n = 9–14 for each group. h The cliff aversion reaction results at 1, 3, and 7 days, demonstrating the time that pups took to turn their head at the cliff. n = 9–14 for each group. i The grip test results at 1, 3, and 7 days, showing the time that pups were able to hold onto a horizontal bar. n = 9–14 for each group. Cap, 3 mg/kg capsaicin. Average values represent the mean ± SEM. *P < 0.05, **P < 0.01 versus control (Tukey’s test after one-way ANOVA). #P < 0.05, ##P < 0.001 versus WT-HI (Tukey’s test after one-way ANOVA)
Fig. 6
Fig. 6
Schematic illustration of the proposed mechanism. TRPV1 plays an important role in neonatal HI-induced astrocytes activation and the transcription and post-translational protein modification of IL-1β. (1) TRPV1 stimulated the phosphorylation of JAK2, and phosphorylated JAK2 promoted the phosphorylation of STAT3. And activated STAT3 bound to its target genes (GFAP and IL-1β) and upregulated their expression. (2) TRPV1 promoted the formation of NLRP3 inflammasome (NLRP3, ASC, and caspase-1), which mediated the activation of caspase-1 and then stimulated the cleavage of pro-IL-1β

References

    1. Confortim Heloísa Deola, Deniz Bruna Ferrary, de Almeida Wellington, Miguel Patrícia Maidana, Bronauth Loise, Vieira Milene Cardoso, de Oliveira Bruna Chaves, Pereira Lenir Orlandi. Neonatal hypoxia-ischemia caused mild motor dysfunction, recovered by acrobatic training, without affecting morphological structures involved in motor control in rats. Brain Research. 2019;1707:27–44. doi: 10.1016/j.brainres.2018.11.021. - DOI - PubMed
    1. Zaitoun IS, Cikla U, Zafer D, Udho E, Almomani R, Suscha A, Cengiz P, Sorenson CM, Sheibani N. Attenuation of retinal vascular development in neonatal mice subjected to hypoxic-ischemic encephalopathy. Sci Rep. 2018;8:9166. doi: 10.1038/s41598-018-27525-8. - DOI - PMC - PubMed
    1. Liu F, McCullough LD. Inflammatory responses in hypoxic ischemic encephalopathy. Acta Pharmacol Sin. 2013;34:1121–1130. doi: 10.1038/aps.2013.89. - DOI - PMC - PubMed
    1. Seifert G, Schilling K, Steinhauser C. Astrocyte dysfunction in neurological disorders: a molecular perspective. Nat Rev Neurosci. 2006;7:194–206. doi: 10.1038/nrn1870. - DOI - PubMed
    1. Swanson RA, Ying W, Kauppinen TM. Astrocyte influences on ischemic neuronal death. Curr Mol Med. 2004;4:193–205. doi: 10.2174/1566524043479185. - DOI - PubMed