

Association between consumption of ultra-processed foods and all cause mortality: SUN prospective cohort study
- PMID: 31142450
- PMCID: PMC6538973
- DOI: 10.1136/bmj.l1949
Association between consumption of ultra-processed foods and all cause mortality: SUN prospective cohort study
Abstract
Objective: To evaluate the association between consumption of ultra-processed foods and all cause mortality.
Design: Prospective cohort study.
Setting: Seguimiento Universidad de Navarra (SUN) cohort of university graduates, Spain 1999-2018.
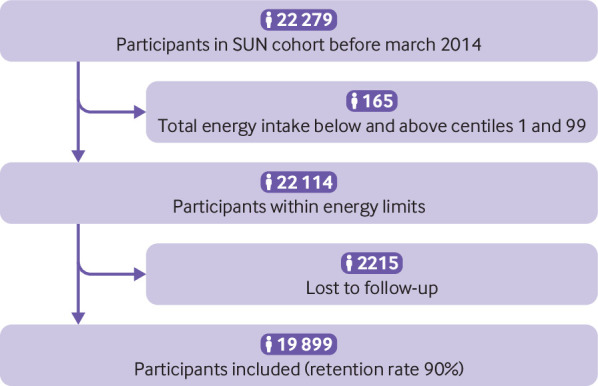
Participants: 19 899 participants (12 113 women and 7786 men) aged 20-91 years followed-up every two years between December 1999 and February 2014 for food and drink consumption, classified according to the degree of processing by the NOVA classification, and evaluated through a validated 136 item food frequency questionnaire.
Main outcome measure: Association between consumption of energy adjusted ultra-processed foods categorised into quarters (low, low-medium, medium-high, and high consumption) and all cause mortality, using multivariable Cox proportional hazard models.
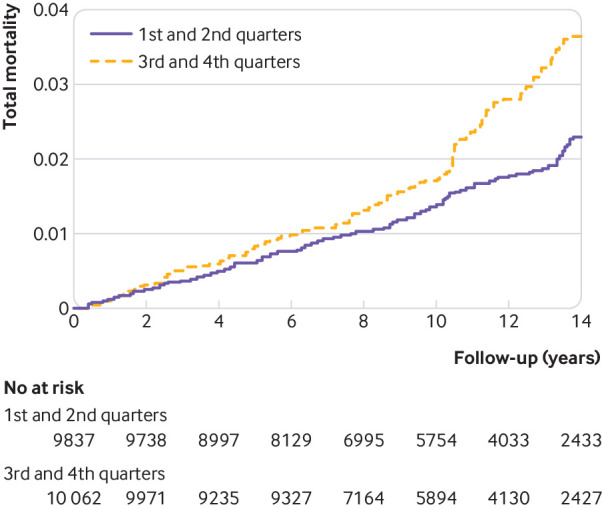
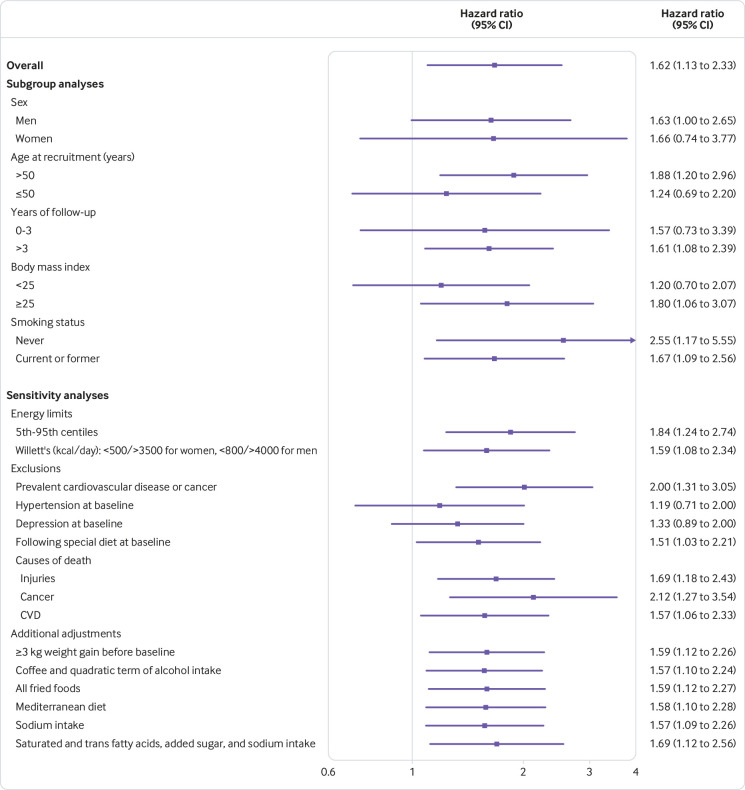
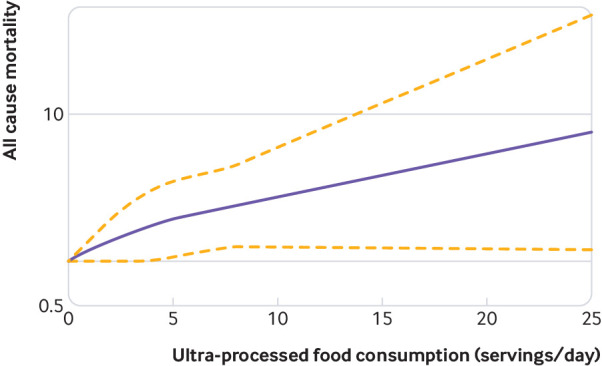
Results: 335 deaths occurred during 200 432 persons years of follow-up. Participants in the highest quarter (high consumption) of ultra-processed foods consumption had a higher hazard for all cause mortality compared with those in the lowest quarter (multivariable adjusted hazard ratio 1.62, 95% confidence interval 1.13 to 2.33) with a significant dose-response relation (P for linear trend=0.005). For each additional serving of ultra-processed foods, all cause mortality relatively increased by 18% (adjusted hazard ratio 1.18, 95% confidence interval 1.05 to 1.33).
Conclusions: A higher consumption of ultra-processed foods (>4 servings daily) was independently associated with a 62% relatively increased hazard for all cause mortality. For each additional serving of ultra-processed food, all cause mortality increased by 18%.
Study registration: ClinicalTrials.gov NCT02669602.
Published by the BMJ Publishing Group Limited. For permission to use (where not already granted under a licence) please go to http://group.bmj.com/group/rights-licensing/permissions.
Conflict of interest statement
Competing interests: All authors have completed the ICMJE uniform disclosure form at www.icmje.org/coi_disclosure.pdf and declare: no support from any organisation for the submitted work; no financial relationships with any organisations that might have an interest in the submitted work in the previous three years; no other relationships or activities that could appear to have influenced the submitted work.
Figures
References
-
- Gakidou E, Afshin A, Abajobir AA, et al. GBD 2016 Risk Factors Collaborators Global, regional, and national comparative risk assessment of 84 behavioural, environmental and occupational, and metabolic risks or clusters of risks, 1990-2016: a systematic analysis for the Global Burden of Disease Study 2016. Lancet 2017;390:1345-422. 10.1016/S0140-6736(17)32366-8 - DOI - PMC - PubMed
-
- United Nations. Political declaration of the high-level meeting of the General Assembly on the prevention and control of non-communicable diseases. Agenda item 117. 2011;(January). 10.1007/BF03038934 - DOI
-
- World Health Organization. Global action plan for the prevention and control of noncommunicable diseases 2013-2020. Geneva: WHO. www.who.int/nmh/events/ncd_action_plan/en/. Published 2013.
Publication types
MeSH terms
Associated data
LinkOut - more resources
Full Text Sources
Medical