

Molecular Classification of Epithelial Ovarian Cancer Based on Methylation Profiling: Evidence for Survival Heterogeneity
- PMID: 31142506
- PMCID: PMC6774865
- DOI: 10.1158/1078-0432.CCR-18-3720
Molecular Classification of Epithelial Ovarian Cancer Based on Methylation Profiling: Evidence for Survival Heterogeneity
Abstract
Purpose: Ovarian cancer is a heterogeneous disease that can be divided into multiple subtypes with variable etiology, pathogenesis, and prognosis. We analyzed DNA methylation profiling data to identify biologic subgroups of ovarian cancer and study their relationship with histologic subtypes, copy number variation, RNA expression data, and outcomes.
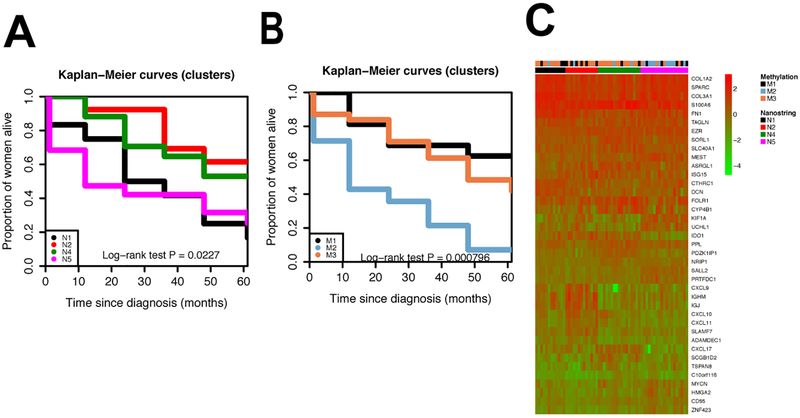
Experimental design: A total of 162 paraffin-embedded ovarian epithelial tumor tissues, including the five major epithelial ovarian tumor subtypes (high- and low-grade serous, endometrioid, mucinous, and clear cell) and tumors of low malignant potential were selected from two different sources: The Polish Ovarian Cancer study, and the Surveillance, Epidemiology, and End Results Residual Tissue Repository (SEER RTR). Analyses were restricted to Caucasian women. Methylation profiling was conducted using the Illumina 450K methylation array. For 45 tumors array copy number data were available. NanoString gene expression data for 39 genes were available for 61 high-grade serous carcinomas (HGSC).
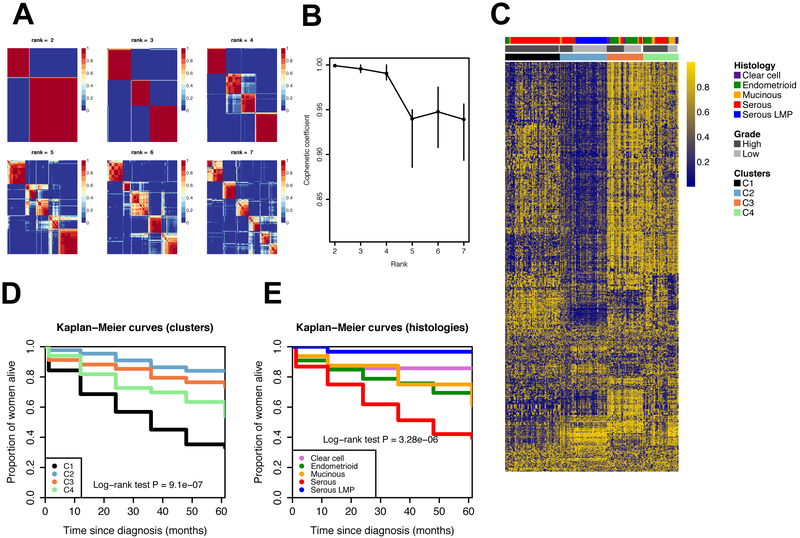
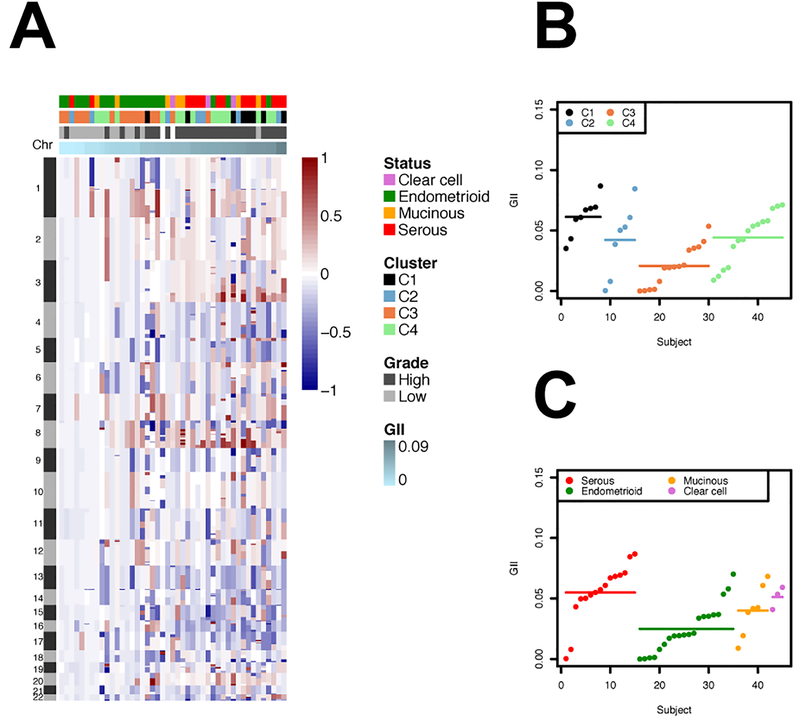
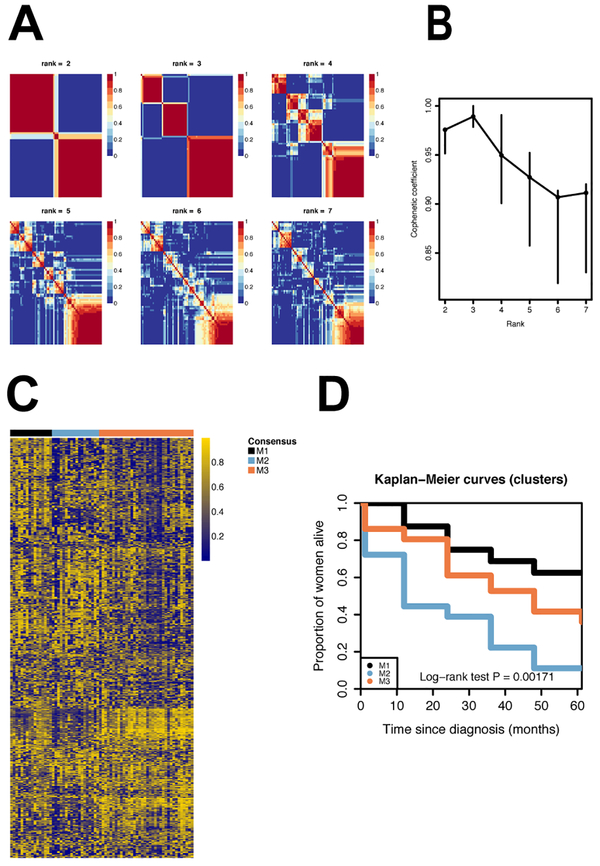
Results: Consensus nonnegative matrix factorization clustering of the 1,000 most variable CpG sites showed four major clusters among all epithelial ovarian cancers. We observed statistically significant differences in survival (log-rank test, P = 9.1 × 10⁻⁷) and genomic instability across these clusters. Within HGSC, clustering showed three subgroups with survival differences (log-rank test, P = 0.002). Comparing models with and without methylation subgroups in addition to previously identified gene expression subtypes suggested that the methylation subgroups added significant survival information (P = 0.007).
Conclusions: DNA methylation profiling of ovarian cancer identified novel molecular subgroups that had significant survival difference and provided insights into the molecular underpinnings of ovarian cancer.See related commentary by Ishak et al., p. 5729.
©2019 American Association for Cancer Research.
Conflict of interest statement
Disclaimers
The authors have no conflicts of interest.
Figures
Comment in
-
DNA Methylation as a Robust Classifier of Epithelial Ovarian Cancer.Clin Cancer Res. 2019 Oct 1;25(19):5729-5731. doi: 10.1158/1078-0432.CCR-19-1797. Epub 2019 Jul 23. Clin Cancer Res. 2019. PMID: 31337645
Comment on
-
DNA Methylation as a Robust Classifier of Epithelial Ovarian Cancer.Clin Cancer Res. 2019 Oct 1;25(19):5729-5731. doi: 10.1158/1078-0432.CCR-19-1797. Epub 2019 Jul 23. Clin Cancer Res. 2019. PMID: 31337645
References
-
- Siegel RL, Miller KD, Jemal A. Cancer statistics, 2015. CA Cancer J Clin 2015;65:5–29 - PubMed
-
- Köbel M, Bak J, Bertelsen BI, Carpen O, Grove A, Hansen ES, et al. Ovarian carcinoma histotype determination is highly reproducible, and is improved through the use of immunohistochemistry. Histopathology 2014;64:1004–13 - PubMed
-
- Seidman JD, Horkayne-Szakaly I, Haiba M, Boice CR, Kurman RJ, Ronnett BM. The histologic type and stage distribution of ovarian carcinomas of surface epithelial origin. International journal of gynecological pathology : official journal of the International Society of Gynecological Pathologists 2004;23:41–4 - PubMed
-
- Koonings PP, Campbell K, Mishell DR Jr. Grimes DA. Relative frequency of primary ovarian neoplasms: a 10-year review. Obstet Gynecol 1989;74:921–6 - PubMed
Publication types
MeSH terms
Grants and funding
LinkOut - more resources
Full Text Sources
Medical
