. 2019 Aug 15;79(16):4242-4257.
doi: 10.1158/0008-5472.CAN-19-0218. Epub 2019 May 29.

The Highly Recurrent PP2A Aα-Subunit Mutation P179R Alters Protein Structure and Impairs PP2A Enzyme Function to Promote Endometrial Tumorigenesis

Affiliations

The Highly Recurrent PP2A Aα-Subunit Mutation P179R Alters Protein Structure and Impairs PP2A Enzyme Function to Promote Endometrial Tumorigenesis

Sarah E Taylor et al. Cancer Res. .

Abstract

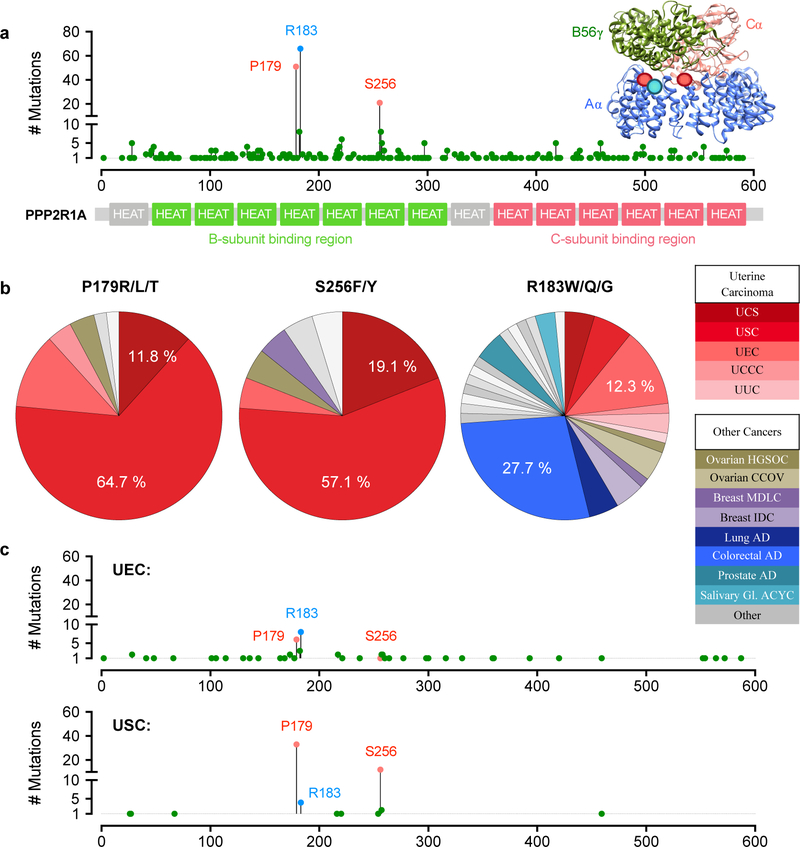
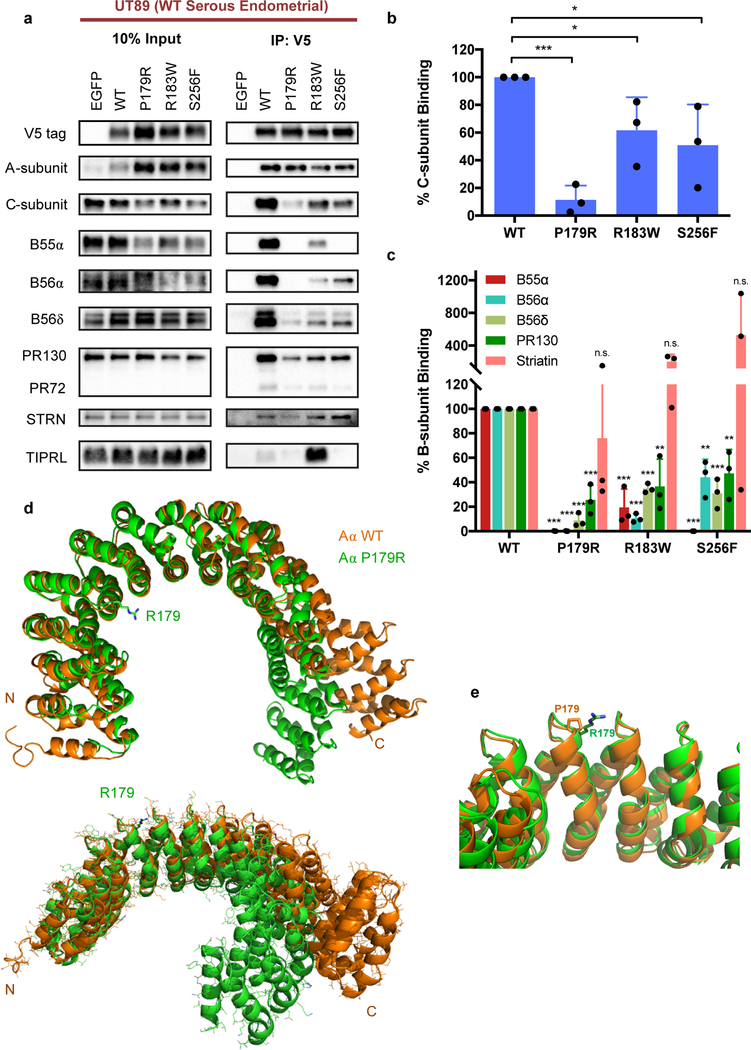
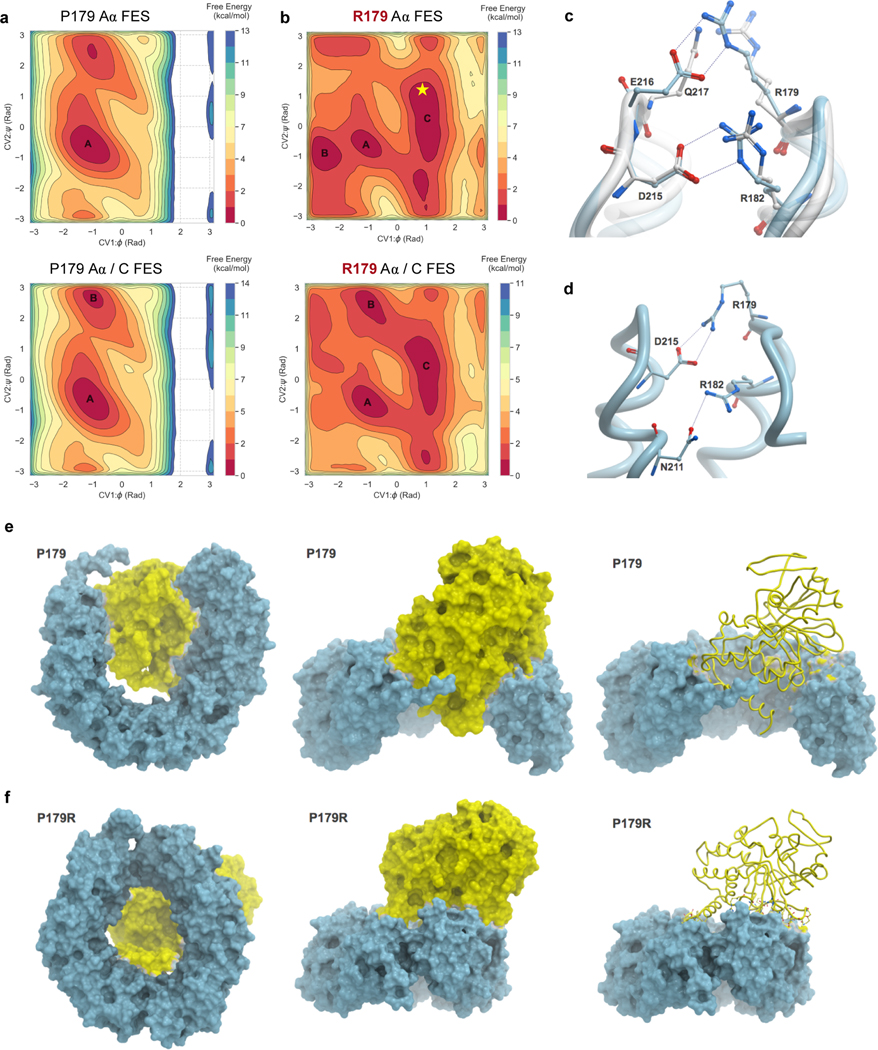
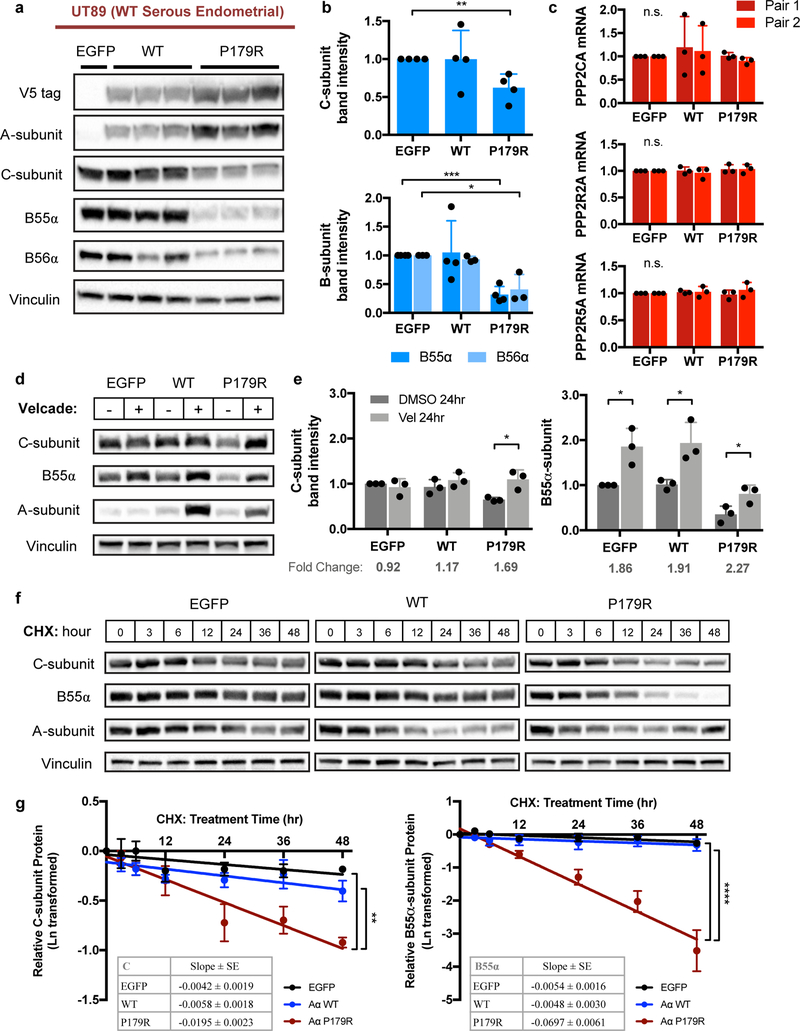
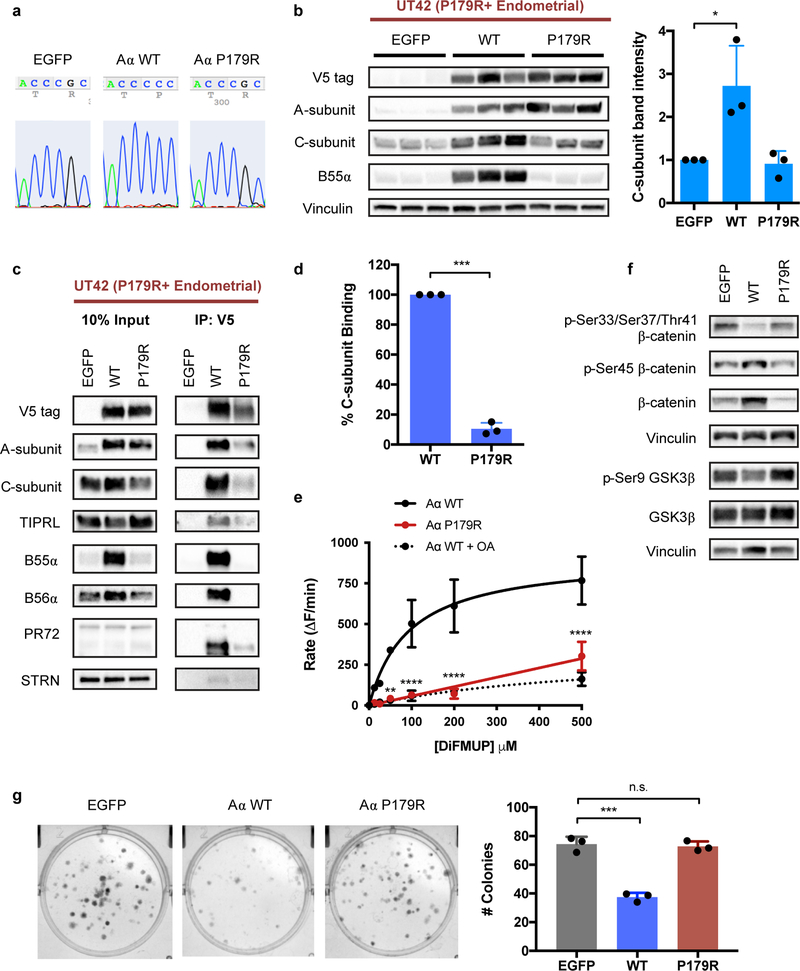
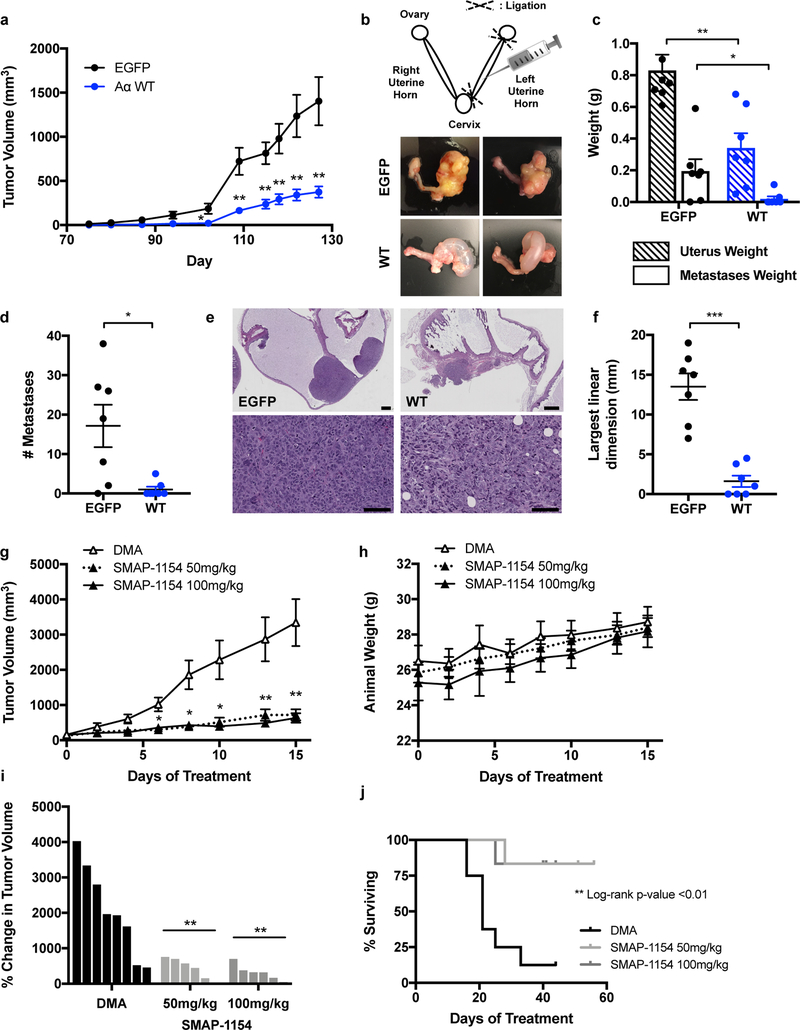
Somatic mutation of the protein phosphatase 2A (PP2A) Aα-subunit gene PPP2R1A is highly prevalent in high-grade endometrial carcinoma. The structural, molecular, and biological basis by which the most recurrent endometrial carcinoma-specific mutation site P179 facilitates features of endometrial carcinoma malignancy has yet to be fully determined. Here, we used a series of structural, biochemical, and biological approaches to investigate the impact of the P179R missense mutation on PP2A function. Enhanced sampling molecular dynamics simulations showed that arginine-to-proline substitution at the P179 residue changes the protein's stable conformation profile. A crystal structure of the tumor-derived PP2A mutant revealed marked changes in A-subunit conformation. Binding to the PP2A catalytic subunit was significantly impaired, disrupting holoenzyme formation and enzymatic activity. Cancer cells were dependent on PP2A disruption for sustained tumorigenic potential, and restoration of wild-type Aα in a patient-derived P179R-mutant cell line restored enzyme function and significantly attenuated tumorigenesis and metastasis in vivo. Furthermore, small molecule-mediated therapeutic reactivation of PP2A significantly inhibited tumorigenicity in vivo. These outcomes implicate PP2A functional inactivation as a critical component of high-grade endometrial carcinoma disease pathogenesis. Moreover, they highlight PP2A reactivation as a potential therapeutic strategy for patients who harbor P179R PPP2R1A mutations. SIGNIFICANCE: This study characterizes a highly recurrent, disease-specific PP2A PPP2R1A mutation as a driver of endometrial carcinoma and a target for novel therapeutic development.See related commentary by Haines and Huang, p. 4009.


Conflict of interest statement

Conflict of Interest Statement:

The Icahn School of Medicine at Mount Sinai and Case Western Reserve University on behalf of the author G.N. have filed patents covering composition of matter on the small molecules disclosed herein for the treatment of human cancer and other diseases and for methods of use for using these small molecule PP2A activators. RAPPTA Therapeutics LLC has licensed this intellectual property for the clinical and commercial development of this series of small molecule PP2A activators. The author G.N. has an ownership interest in RAPPTA Therapeutics LLC.

Figures

Figure 1.
Figure 1.. P179R/L/T and S256F/Y Aα mutations are highly specific to high-grade endometrial cancer subtypes.
a, The distribution of PPP2R1A mutations identified in human cancers across the Aα-subunit protein length (adapted from cBioportal.org) [64, 65]. Inset image of a PP2A heterotrimer (PDB: 2IAE) indicating the location of mutated amino acids at the A-/B-subunit interface. b, The cancers in which point mutation of the P179, S256, or R183 residue was identified. c, Occurrence and distribution of PPP2R1A mutations in endometrioid (UEC) and serous (USC) subtypes of endometrial cancer. Acronyms: UCS, uterine carcinosarcoma; USC, uterine serous carcinoma; UEC, uterine endometrioid carcinoma; UCCC, uterine clear cell carcinoma; UUC, uterine undifferentiated carcinoma; HGSOC, high-grade serous ovarian carcinoma; CCOV, clear cell ovarian carcinoma; MDLC, mixed ductal and lobular carcinoma; IDC, invasive ductal carcinoma; AD, adenocarcinoma; ACYC, adenoid cystic carcinoma.
Figure 2.
Figure 2.. P179R-Aα displays impaired binding to both PP2A B- and C-subunits, which is supported by a global protein conformation change in the resolved crystal structure.
a, Western blots of co-immunoprecipitation (IP) isolates reveals altered interactome with mutant P179R-Aα protein. b–c, Quantification of the percent C- or B-subunit binding relative to WT. Band intensity measurements for subunit protein in the co-IP samples has been normalized to the amount of subunit protein present in the pre-IP input. Data is the average of three independent co-IP experiments (n=3), and represents the mean ± SD. Statistical significance was determined by Student’s t-test (P179R vs. WT). * p ≤ 0.05, ** p ≤ 0.01, *** p ≤ 0.001, n.s. = not significant. d–e, Overlay of the resolved P179R-Aα crystal structure (green; PDB: 6EF4) with a published WT-Aα crystal structure (orange; PDB: 1B3U) [42]. Crystallographic data collection and refinement details are provided in Supplementary Methods.
Figure 3.
Figure 3.. Molecular modeling reveals distinct conformational dynamics of the P179R-Aα mutant protein.
a–b, Free energy surfaces (FES) plots of the apo Aα-subunit (top) and Aα/C complex (bottom) generated as a function of φ and ψ dihedral angles of residues P179 and R179. a, The P179 wildtype residue explores a similar conformational landscape in both apo and complex states. b, By comparison, the R179 mutant FES is modified, indicating sampling of additional conformations. The landscape between apo and complex states of R179 is also altered, highlighting additional sampling of interactions when in the Aα/C complex. Labelled basins represent energy minima, with basins A and C representing the most populated minima for P179 and R179, respectively. The resolved crystal structure (Figure 2d–e) extrapolates onto basin C of R179, indicated by the star. c–d, A comparison of inter-residue interactions made by R179. c, Overlay of the P179R-Aα crystal structure (white), with the representative conformation extracted from the largest populated basin of the apo R179 Aα FES (cyan). In the crystal structure, R179 makes ion pair interactions with Q217 while R182 interacts with D215. In the simulated apo P179R-Aα, R179 interacts with E216 while the interaction between R182 and D215 remains unaltered. d, In the representative conformation of P179R-Aα in the Aα/C complex, R179 makes an ion pair with D215 while R182 interacts with the side chain of N211. e–f, Conformational changes observed in the representative structures extracted from the most populated minima for the WT Aα/C complex (e) and the P179R mutant Aα/C complex (f).
Figure 4.
Figure 4.. P179R-Aα expression induced a loss of PP2A C- and B-subunit stability.
a, Western blots demonstrating loss of total C, B55α, and B56α protein upon expression of the P179R mutant Aα isoform that has impaired subunit binding. Triplicate lanes represent independent clonal lines generated from parental cells transduced in parallel wells. b, Quantification of total C-, B55α-, and B56α-subunits for selected clones used in subsequent experiments; presented as fold change relative to EGFP (n=3). c, mRNA transcript levels of PPP2CA (Cα), PPP2R2A (B55α), and PPP2R5A (B56α) from real-time PCR; normalized to β-Actin (n=3). Statistical significance for b and c was determined by Student’s t-test (WT or P179R vs. EGFP) with data graphed as mean ± SD. d–e, Representative westerns and quantification of total C and B55α protein present following treatment with DMSO or Velcade (1.0 μM) for 24 hours (hr) (n=3). Statistical significance was determined by Student’s t-test (Treated vs. Untreated), with data graphed as mean ± SD. f, Representative westerns for change in total C and B55α protein following treatment with Cycloheximide (CHX; 100 μg/ml) for the indicated time. g, Linear regression analysis was performed on Ln-transformed western blot densitometries to represent the change in protein abundance across time-points. Graphs represent the mean ± SEM; tables provide the slope ± SE of the best-fit line (n=3). Details of the statistical analysis of CHX data are provided in Supplementary Methods. * p ≤ 0.05, ** p ≤ 0.01, *** p ≤ 0.001, n.s. = not significant.
Figure 5.
Figure 5.. Restoration of C-subunit protein and PP2A catalytic activity upon expression of WT-Aα in a P179R+ tumor-derived cell line, UT42.
a, Sanger sequencing of UT42 cell lines transduced with expression vectors for EGFP, WT-Aα, or P179R-Aα. b, Representative western blots demonstrate significantly increased C and B55α protein with expression of WT-Aα. Triplicate lanes are independent clonal lines generated from parental cells transduced in parallel wells. Graphed is the total C-subunit protein for clones selected for subsequent experiments (n=3). Data is presented as the mean ± SD fold change relative to EGFP, and statistical significance was determined by Student’s t-test (WT or P179R vs. EGFP). c, Western blots of co-IP isolates from the UT42 isogenic lines show that the expressed WT-Aα protein is capable of binding to other PP2A C- and B-subunits; expressed P179R-Aα protein does not. d, Percent C-subunit binding of P179R-Aα relative to WT from co-IP in the UT42 cell lines (n=3). Data presented as mean ± SD with significance determined by Student’s t-test. e, Co-IP isolates of WT or P179R Aα-containing complexes were assessed for phosphatase activity using a DiFMUP-based fluorescence assay (n=3), wherein WT-Aα isolates displayed robust dephosphorylation activity. This phosphatase activity could be blocked by Okadeic Acid treatment (OA, 50 nM). Data was analyzed by two-way ANOVA (p<0.0001, dF=28) with Tukey’s post-hoc t-tests. f, Expression of WT-Aα results in dephosphorylation of the PP2A substrates β-catenin and GSK3β. Images are representative of western blotting results from three independent biological replicates (n=3). g, Representative images and quantification of colony formation by UT42 cells expressing EGFP, WT-Aα, or P179R-Aα (n=3). Data presented as mean ± SD. Statistical significance was determined by Student’s t-test (WT or P179R vs. EGFP). * p ≤ 0.05, ** p ≤ 0.01, *** p ≤ 0.001, **** p ≤ 0.0001, n.s. = not significant.
Figure 6.
Figure 6.. PP2A activation in UT42 suppressed tumorigenesis and metastasis in vivo.
a, Tumor growth following sub-cutaneous injection of EGFP- or WT-Aα-expressing UT42 cells into the animal’s hind flank (n=11). b, Schematic of the intra-uterine cell injection method (adapted from ref. 21) with representative images of primary tumor formation in the extracted gynecologic tract (images for all animals presented in Supplementary Figure 6c). c, Weight of the injected left uterine horn, and of collected metastatic nodules, isolated from mice at 8 weeks post-injection (n=7). d, Number of metastatic nodules per animal and group. e, H&E stained sections of representative EGFP and WT primary uterine tumors at low magnification (top, scale bar = 1 mm) and high magnification (bottom, scale bar = 100 μm). f, The largest linear dimension was calculated as the sum of the lengths of all tumor foci observed within the sampled H&E stained tissue section. g, Tumor growth of sub-cutaneous UT42 PDX implants treated with vehicle (DMA; n=8), 50 mg/kg SMAP (n=6), or 100 mg/kg SMAP (n=6). h, Animal weights recorded across the duration of treatment. i, Waterfall plot presenting the percent change in tumor volume between the start of treatment and treatment day 15. j, Kaplan-Meier curves for animal survival within each treatment group. Data for all in vivo experiments are presented as the mean ± SEM with statistical significance determined by Student’s t-test, except for survival curves which were evaluated for significance by Log-rank (Mantel-Cox) test. * p ≤ 0.05, ** p ≤ 0.01, *** p ≤ 0.001, n.s. = not significant.

Comment in

References

    1. Siegel RL, Miller KD & Jemal A Cancer statistics, 2018. CA Cancer J Clin 68, 7–30 (2018). - PubMed
    1. Hamilton CA et al. Uterine papillary serous and clear cell carcinomas predict for poorer survival compared to grade 3 endometrioid corpus cancers. Br J Cancer 94, 642–646 (2006). - PMC - PubMed
    1. Remmerie M & Janssens V Targeted Therapies in Type II Endometrial Cancers: Too Little, but Not Too Late. Int J Mol Sci 19, (2018). - PMC - PubMed
    1. Cantrell LA, Blank SV & Duska LR Uterine carcinosarcoma: A review of the literature. Gynecol Oncol 137, 581–588 (2015). - PubMed
    1. Arend R, Doneza JA & Wright JD Uterine carcinosarcoma. Curr Opin Oncol 23, 531–536 (2011). - PubMed

Substances