. 2019 Jun 12;146(12):dev174557.
doi: 10.1242/dev.174557.

Lgr5+ stem and progenitor cells reside at the apex of a heterogeneous embryonic hepatoblast pool

Affiliations

Lgr5+ stem and progenitor cells reside at the apex of a heterogeneous embryonic hepatoblast pool

Nicole Prior et al. Development. .

Abstract

During mouse embryogenesis, progenitors within the liver known as hepatoblasts give rise to adult hepatocytes and cholangiocytes. Hepatoblasts, which are specified at E8.5-E9.0, have been regarded as a homogeneous progenitor population that initiate differentiation from E13.5. Recently, scRNA-seq analysis has identified sub-populations of transcriptionally distinct hepatoblasts at E11.5. Here, we show that hepatoblasts are not only transcriptionally but also functionally heterogeneous, and that a subpopulation of E9.5-E10.0 hepatoblasts exhibit a previously unidentified early commitment to cholangiocyte fate. Importantly, we also identify a subpopulation constituting 2% of E9.5-E10.0 hepatoblasts that express the adult stem cell marker Lgr5, and generate both hepatocyte and cholangiocyte progeny that persist for the lifespan of the mouse. Combining lineage tracing and scRNA-seq, we show that Lgr5 marks E9.5-E10.0 bipotent liver progenitors residing at the apex of a hepatoblast hierarchy. Furthermore, isolated Lgr5+ hepatoblasts can be clonally expanded in vitro into embryonic liver organoids, which can commit to either hepatocyte or cholangiocyte fates. Our study demonstrates functional heterogeneity within E9.5 hepatoblasts and identifies Lgr5 as a marker for a subpopulation of bipotent liver progenitors.

Keywords: Bipotent; Hepatoblast; Lgr5; Liver development; Liver stem/progenitor cells; Organoid.


Conflict of interest statement

Competing interestsThe authors declare no competing or financial interests.

Figures
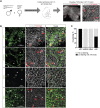
Fig. 1.
Fig. 1.
Lgr5 expression marks cells with hepatoblast features in the developing liver. (A-C) Lgr5-IRES-CreERT2hom; R26R-TdTomatohom males were mated with MF1-WT females in order to generate Lgr5-IRES-CreERT2het;R26R-TdTomatohet embryos. Administration of tamoxifen to pregnant females at E9.5 leads to activation of Cre in Lgr5+ cells and recombination at the ROSA locus to induce expression of TdTomato in E9.5-E10 Lgr5+ cells and their progeny. (A) Schematic of experimental approach. Expression of TdTomato can be detected in E11.5 livers following induction at E9.5, indicating the presence of Lgr5+ cells in the developing liver at E9.5 (n≥3 independent experiments, n=2 independent litters). Representative images of TdTomato epi-fluorescence (red) are shown. Nuclei were counterstained with Hoechst (grey). (B) Representative immunofluorescent staining of TdTomato-expressing cells co-stained for the hepatoblast marker AFP (green, top panel), the endothelial marker VEGFR3 (green, middle top panel), the pan-haematopoietic marker CD45 (green, middle bottom panel) and the proliferative marker Ki67 (green, bottom panel). (C) Quantification of the immunostaining shown in B. All TdTomato+ cells co-express AFP and are negative for endothelial and haematopoietic fate markers (n>30, n=2 independent litters). At least half of the TdTomato+ cells are proliferative (Ki67+, n>50, n=2 independent litters).
Fig. 2.
Fig. 2.
Lgr5 is a marker of bona fide hepatoblasts in vivo. (A) Schematic of experimental approach. TdTomato expression was induced at E9.5 and livers collected at the indicated postnatal time-points. (B) Lgr5+ progeny (TdTomato+ cells, red) are found distributed along all three zones of the liver lobule; the portal triad (PT, zone 1), the central vein (CV, zone 3) and the intermediate region (zone 2), at all time-points analysed, up to 12 months after birth. In zone 1, labelled cells include both hepatocytes and cholangiocytes (osteopontin, green), indicating that E9.5-E10 Lgr5+ cells are bona fide hepatoblasts. Right panels are enlargements of the boxed areas in zone 1.
Fig. 3.
Fig. 3.
E9.5 Lgr5+ hepatoblasts are bipotent. (A-D) Lgr5-IRES-CreERT2hom mice were mated with multicolour Confetti reporter R26R-Confettihom mice to generate Lgr5-IRES-CreERT2het;R26R-Confettihet embryos. Induction with tamoxifen at E9.5 results in Lgr5+ cells and progeny being labelled in one of four colours (RFP, YFP, mCFP or nGFP). (A) Schematic of the experimental design. Two potential outcomes are illustrated: a single Lgr5+ hepatoblast (red circle) is bipotent and gives rise to both hepatocytes (red squares) and cholangiocytes (red triangles); alternatively, single Lgr5+ hepatoblasts (blue and yellow circles) are unipotent and independently give rise to hepatocytes (blue squares) and cholangiocytes (yellow triangles). (B,C) Representative images of P0 Lgr5-IRES-CreERT2het;R26R-Confettihet liver following induction at E9.5. Ductal cells were co-stained for osteopontin (blue, white arrows). Nuclei were counter-stained with Hoechst. (B) Low-power magnification of a liver section showing a red and a yellow clone (white arrows). (C) Magnification showing that the red clone contains both hepatocytes and cholangiocytes (white arrows). (D) Pie charts showing the total number of clones identified (n=70) and the fraction of these that are located in zone 1 (n=26). From the total number of clones found in zone 1, half (n=13) contained both hepatocytes and cholangiocytes of the same colour. At the induction dose used, the frequency of mergers of clusters of the same colour is less than 3.6±1.9% for all colours (see Fig. S2B), which confirms that at least 12 of the 13 bipotent clones identified arise from a single Lgr5+ cell, thus demonstrating that a fraction of Lgr5+ cells are bipotent at E9.5. Experiments were performed in n=3 embryos.
Fig. 4.
Fig. 4.
Lgr5+ embryonic liver cells form both cholangiocyte-like and hepatocyte-like organoids in vitro. (A) Section of an E10.5 liver showing co-labelling of Lgr5-GFP+ cells (green) with the liver progenitor marker Liv2 (purple). Nuclei were counterstained with Hoechst. (B-H) Embryonic liver organoids were generated from sorted Lgr5-GFP+ hepatoblasts isolated from E10.5-E12.5 Lgr5-EGFP-IRES-creERT2 livers. (B) Schematic of the experimental approach. (C,D) Representative image of a mouse embryo liver organoid derived from a single Lgr5-GFP+ cell and cultured in (C) cholangiocyte-like medium or (D) hepatocyte-like medium. Scale bars: 10 µm in day 0 and day 2 images. The cells in the organoids grown in hepatocyte-like medium have hepatocyte morphology. (E) Expression of the ductal marker Krt19 is predominantly detected in embryonic organoids grown in cholangiocyte-like medium and in control adult ductal liver organoids, while the hepatocyte marker albumin (Alb) is detected at much higher levels in embryonic cells cultured in hepatocyte-like medium. (F) Immunofluorescence staining of organoids derived from Lgr5-GFP+ embryonic liver cells shows clear expression of either the ductal marker Krt19 in organoids grown in cholangiocyte-like medium (left panel) or the hepatocyte marker HNF4α in organoids grown in hepatocyte-like medium (right panel) (nuclei are counterstained with Hoechst, membranes are labelled with Ctnnb1). The image of embryonic organoids grown in cholangiocyte-like medium represents a projection of 6 µm; hence, giving a multiple cell layer appearance of the single cell epithelial structure. The hepatocyte-like organoids grow as solid structures, with all cells marked by HNF4α. (G) The level of albumin secreted into the supernatant collected after 24 h is significantly higher in embryonic organoids cultured with hepatocyte-like medium compared with cholangiocyte-like medium. (H) AFP secretion into the supernatant after 24 h is increased in embryonic organoids cultured with hepatocyte-like medium when compared with cholangiocyte-like medium and with adult ductal liver organoids. Data are mean±s.e.m. of n≥2 experiments.
Fig. 5.
Fig. 5.
scRNA-seq of hepatoblasts reveals heterogeneity in the hepatoblast population. (A) Schematic of the experimental approach. Briefly, bulk (Liv2+) hepatoblasts and Lgr5-GFP-positive (Liv2+ Lgr5-GFP+) hepatoblasts from E10.5 or E13.5 Lgr5-EGFP-IRES-creERT2 embryos were obtained by FACS and were processed for scRNA-seq analysis using the Smartseq2 protocol. (B) Clustering analysis (Louvain clustering) of all cells analysed (653 sorted cells from E10.5 and E13.5 embryos) classified cells into three different clusters: a cluster that exhibits features of hepatoblasts only (HB, blue), a hepatoblast cluster with hepatocyte-like features (Hep, green) and a hepatoblast cluster with cholangiocyte-like features (Chol, orange). Representative marker genes of each of these three clusters are shown: Id3 (HB), Ttr (Hep) and Car2 (Chol). Clusters are represented using tSNE plots. (C) Diffusion pseudotime analysis of E10.5 and E13.5 cells shows the HB cluster precedes the divergence of the Hep cluster or Chol cluster, and has a higher proportion of cells in G2M phase. Left panel, diffusion map showing DC1 and DC2 components; middle panel, diffusion map where the three clusters identified by Louvain clustering are shown; right panel, diffusion map showing the cell cycle phase. Arrows represent the developmental trajectory originating from the HB cluster. (D) Lgr5 transcript levels as determined using single cell sequencing superimposed on the pseudotime analysis of all cells. (E) Lgr5-GFP+ cells as identified by FACS data superimposed on the pseudotime analysis of all cells. There are some Lgr5-GFP+ cells that were sorted as GFP+ but that have downregulated the Lgr5 transcript (black arrows), indicating that these are immediate descendants of Lgr5+ cells. (F) Diffusion map showing the cells segregated by time-point (blue, E10.5; orange, E13.5). Cells sorted at E10.5 map to the HB cluster, to cells moving towards and located in the Hep cluster, and to cells located in the Chol cluster. At E13.5, the sorted cells map to the HB cluster, to the cells moving towards the Chol cluster and to the Chol cluster. Sorted cells no longer map to the Hep cluster, which may indicate that hepatocyte-committed hepatoblasts do not express the Liv2 epitope at E13.5.
Fig. 6.
Fig. 6.
Lgr5+ hepatoblasts are at the apex of the hepatoblast hierarchy. (A-F) Embryos expressing either the Lgr5-Cre (Lgr5-IRES-CreERT2) or the ubiquitous Cre (R26R-CreERT2) were induced at E9.5 or E13.5 in order to lineage trace the early hepatoblast pool. (A) Representative images of Confetti-labelled descendants following tamoxifen induction in Lgr5-IRES-CreERT2;R26R-Confetti embryos at E9.5 and liver collection at P17. The magnified area highlights cholangiocytes (osteopontin, purple) outlined in blue. Arrows indicate hepatocyte clones of the same colour (yellow) as the adjacent ductal clone marked by OPN, thus indicating that they share a clonal origin. (B) Schematic displaying the possible outcomes of labelled proportions following lineage tracing of Lgr5+ cells at E9.5 depending on where Lgr5+ cells are in the hepatoblast hierarchy (indicated with a blue arrow). If E9.5 Lgr5+ hepatoblasts are at the apex of the hepatoblast hierarchy, it is expected that their contribution to the postnatal liver will recapitulate the homeostatic proportions of hepatocytes and ductal cells (97% versus 3%) as detailed in Fig. S6D. In the left panel, Lgr5+ cells (blue arrow) are not at the apex; hence, the homeostatic proportions are not achieved. By contrast, in the right panel, Lgr5+ cells are at the apex and therefore generate the homeostatic proportions. (C) Quantification of labelled epithelial cells following induction at E9.5 from Lgr5-IRES-CreERT2 shows that 3.5%±0.5% were ductal, which is equivalent to the homeostatic proportion of ductal cells in the postnatal liver (no Cre driver). In contrast, the proportion of labelled ductal cells using R26R-CreERT2 at E9.5 to drive labelling was significantly higher. At E13.5, lineage tracing from the Lgr5-IRES-CreERT2 allele resulted in no labelled ductal cells, whereas induction from the R26R-CreERT2 allele at E13.5 resulted in the homeostatic proportion (data are mean±s.e.m., each data point represents an individual liver). Analysis of postnatal livers was conducted at time-points P0-P30; later time-points were not considered to prevent homeostatic cellular turnover confounding the data. **P<0.01; ****P<0.0001. (D) Representative images of Confetti-labelled descendants following tamoxifen induction of R26R-CreERT2;R26R-Confetti embryos at E9.5 with liver collection at P14. (E) Cumulative distribution of cluster size frequency at P14-P30, comparing labelled clusters derived from Lgr5+ cells (Lgr5-IRES-CreERT2) and the bulk population (R26R-CreERT2) induced at E9.5 (mean±s.e.m., n≥6). Tracing from Lgr5+ cells results in larger clusters than tracing from the bulk population (F), suggesting that Lgr5+ cells have greater proliferative potential than the bulk population at E9.5 (data are mean±s.e.m.; ***P<0.001).

References

    1. Amir E.-D., Davis K. L., Tadmor M. D., Simonds E. F., Levine J. H., Bendall S. C., Shenfeld D. K., Krishnaswamy S., Nolan G. P. and Pe'er D. (2013). viSNE enables visualization of high dimensional single-cell data and reveals phenotypic heterogeneity of leukemia. Nat. Biotechnol. 31, 545-552. 10.1038/nbt.2594 - DOI - PMC - PubMed
    1. Aragona M., Dekoninck S., Rulands S., Lenglez S., Mascré G., Simons B. D. and Blanpain C. (2017). Defining stem cell dynamics and migration during wound healing in mouse skin epidermis. Nat. Commun. 8, 14684 10.1038/ncomms14684 - DOI - PMC - PubMed
    1. Barker N., van Es J. H., Kuipers J., Kujala P., van den Born M., Cozijnsen M., Haegebarth A., Korving J., Begthel H., Peters P. J. et al. (2007). Identification of stem cells in small intestine and colon by marker gene Lgr5. Nature 449, 1003-1007. 10.1038/nature06196 - DOI - PubMed
    1. Barker N., Bartfeld S. and Clevers H. (2010). Tissue-resident adult stem cell populations of rapidly self-renewing organs. Cell Stem Cell 7, 656-670. 10.1016/j.stem.2010.11.016 - DOI - PubMed
    1. Barker N., Rookmaaker M. B., Kujala P., Ng A., Leushacke M., Snippert H., van de Wetering M., Tan S., Van Es J. H., Huch M. et al. (2012). Lgr5+ve stem/progenitor cells contribute to nephron formation during kidney development. Cell Rep. 2, 540-552. 10.1016/j.celrep.2012.08.018 - DOI - PubMed

Publication types

MeSH terms

Substances